How to Use Chart Patterns for Predicting Bitcoin Price Movements
In the fast-paced world of cryptocurrency trading, understanding how to predict price movements is crucial for success. One of the most effective tools in a trader's arsenal is the use of chart patterns. These patterns serve as visual indicators of potential market movements, allowing traders to make informed decisions based on historical price behavior. By studying these formations, traders can gain insights into market psychology, investor sentiment, and potential future price trends. In this article, we will delve into various chart patterns that can be utilized to forecast Bitcoin price movements, providing you with the knowledge needed to enhance your trading strategies.
Chart patterns are essentially formations created by the price movements of an asset over time. They are like the fingerprints of market behavior, revealing how traders have reacted to price changes in the past. By analyzing these patterns, traders can identify potential future movements and trends, which is invaluable in the volatile world of Bitcoin trading. Think of chart patterns as a map that guides you through the unpredictable landscape of cryptocurrency. They provide a visual representation of market psychology and investor behavior, allowing traders to anticipate what might happen next.
Among the myriad of chart patterns, several stand out due to their reliability and frequency of occurrence. Understanding these common formations can significantly enhance a trader's ability to predict Bitcoin price movements effectively. Some of the most notable patterns include:
- Head and Shoulders
- Triangles (ascending, descending, symmetrical)
- Flags
Each of these patterns carries its own implications and can signal different market conditions, making it essential for traders to familiarize themselves with their characteristics and meanings.
The head and shoulders pattern is one of the most recognized formations in technical analysis. It typically indicates a reversal in trend and consists of three peaks: the left shoulder, the head, and the right shoulder. When this pattern emerges, it often signals a potential downturn in Bitcoin prices, making it crucial for traders to recognize it early. Imagine this pattern as a warning sign on the road; if you see it, you might want to slow down and reconsider your strategy.
Conversely, the inverse head and shoulders pattern serves as a bullish reversal signal. It suggests that after a downtrend, Bitcoin prices may rise, presenting traders with potential buying opportunities. This pattern is like spotting a light at the end of a tunnel; it indicates that brighter days may be ahead for those who act decisively.
To effectively trade the head and shoulders pattern, traders should look for confirmation signals. These can include changes in volume and breakout points that enhance the likelihood of successful trades. Recognizing the right moment to enter or exit a position can be the difference between profit and loss, so being vigilant is key.
Triangle patterns, including ascending, descending, and symmetrical triangles, indicate periods of consolidation. These patterns often precede significant price movements, and recognizing them can help traders predict potential breakouts in Bitcoin prices. Think of these triangles as a coiled spring; the tighter they become, the more explosive the potential movement once the price breaks free.
When interpreting chart patterns, volume analysis is essential. Increased volume during a breakout can confirm the validity of the pattern, enhancing the reliability of price predictions. Volume acts as a supportive force, validating that the price movement is backed by strong market interest.
Traders should actively seek volume spikes that accompany chart pattern breakouts. This confirmation can provide additional confidence in the predicted price movements of Bitcoin. Imagine volume as the cheering crowd at a sports event; when the crowd is loud and excited, you know something significant is happening.
On the flip side, volume divergence occurs when price movements and volume trends do not align. Recognizing this can alert traders to potential false breakouts or reversals, allowing for more informed trading decisions. It's like hearing a fire alarm but seeing no smoke; sometimes, the signals don’t match up, and it’s crucial to remain cautious.
1. What are chart patterns?
Chart patterns are formations created by the price movements of an asset, used to predict future price trends based on historical behavior.
2. How reliable are chart patterns for predicting Bitcoin price movements?
While chart patterns can provide valuable insights, they are not foolproof. Traders should use them in conjunction with other analysis tools for better accuracy.
3. What is the significance of volume in trading?
Volume indicates the strength of a price movement; high volume during breakouts suggests strong interest, while low volume can indicate weak momentum.
4. Can beginners use chart patterns?
Absolutely! While it may take some time to learn, chart patterns are a fundamental part of trading that can be mastered with practice.
Understanding Chart Patterns
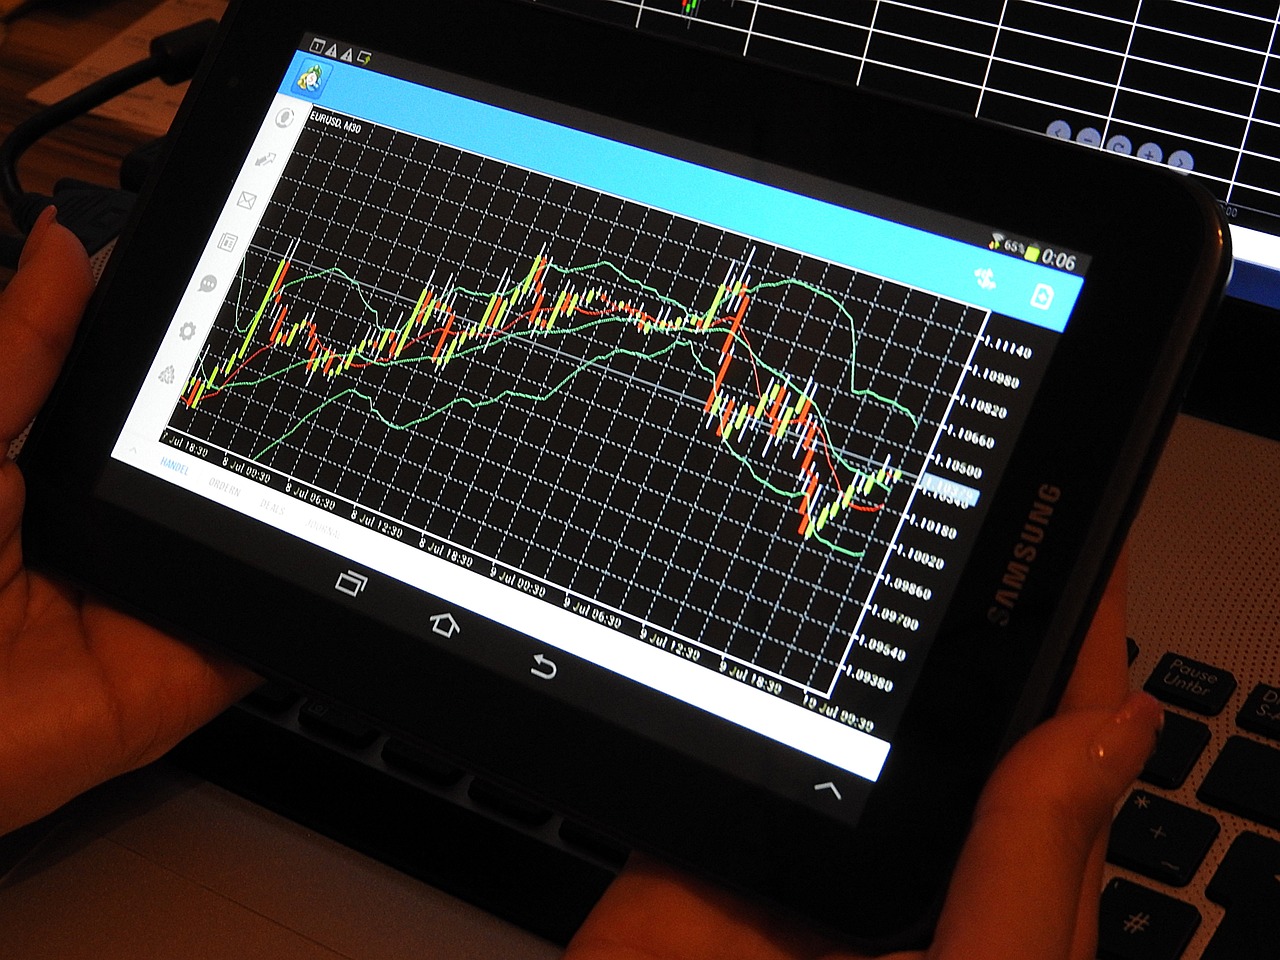
Chart patterns are fascinating formations created by the price movements of an asset, and they serve as a crucial tool for traders in the world of cryptocurrency, especially Bitcoin. These patterns are not just random squiggles on a chart; they reflect the underlying market psychology and the behavior of investors. By analyzing these patterns, traders can gain insights into potential future price movements, enabling them to make informed decisions. Think of chart patterns as the weather forecasts of trading; just as meteorologists use data to predict storms or sunshine, traders use chart patterns to anticipate market trends.
At the core of chart patterns lies the understanding that price movements are influenced by human emotions such as fear and greed. When traders become overly optimistic, prices may rise sharply, forming a pattern that signals a potential reversal. Conversely, when panic sets in, the market may plummet, creating other patterns that indicate a buying opportunity. Recognizing these emotional triggers is essential for traders aiming to navigate the volatile waters of Bitcoin trading.
There are various types of chart patterns, each with its unique implications. Some of the most common include:
- Head and Shoulders: A classic reversal pattern that can indicate a trend change.
- Triangles: These patterns signify periods of consolidation and can lead to breakouts.
- Flags and Pennants: Often seen as continuation patterns, they indicate a brief pause before the previous trend resumes.
Understanding these patterns is not just about recognizing shapes; it's about interpreting the story they tell. For instance, a head and shoulders pattern suggests that after a bullish run, the market may be ready for a downturn. On the other hand, a triangle pattern indicates that the market is in a state of indecision, and a breakout could happen in either direction. By learning to read these patterns, traders can position themselves strategically, either to capitalize on impending price movements or to protect their investments from potential losses.
Moreover, combining chart patterns with other analytical tools, like volume analysis, can significantly enhance their predictive power. Volume, which measures the number of shares or contracts traded in a security, can provide additional context to the patterns observed. A breakout accompanied by high volume is often seen as a stronger signal than one with low volume. Therefore, understanding chart patterns in conjunction with volume analysis creates a more robust trading strategy.
In summary, chart patterns serve as a window into the market's soul, offering traders a glimpse of what might come next. By mastering these patterns, you can navigate the turbulent waters of Bitcoin trading with greater confidence and insight.

Common Chart Patterns
When it comes to trading Bitcoin, understanding chart patterns is like having a map in a dense forest. These patterns provide valuable insights into market trends and potential price movements. Among the myriad of patterns, a few stand out due to their frequency and significance. By recognizing these formations, traders can make informed decisions that could lead to profitable outcomes.
One of the most recognized patterns is the head and shoulders formation. This pattern typically indicates a reversal in the current trend, consisting of three distinct peaks: a higher peak (the head) flanked by two lower peaks (the shoulders). When traders spot this pattern, it can signal a potential downturn in Bitcoin prices, making it essential for them to act swiftly. Conversely, the inverse head and shoulders is a bullish reversal pattern that suggests a potential rise in Bitcoin prices after a downtrend. This pattern can offer traders a fantastic opportunity to buy at a lower price before the upward movement begins.
Another important category of chart patterns includes triangles. These can be classified into three types: ascending, descending, and symmetrical triangles. Each of these patterns indicates a period of consolidation where the price is narrowing down. For instance, an ascending triangle typically suggests that buyers are becoming more aggressive, which could lead to a breakout to the upside. On the other hand, a descending triangle indicates that sellers are gaining control, possibly leading to a downward breakout. Recognizing these patterns can significantly enhance a trader's ability to predict Bitcoin price movements effectively.
Lastly, we have the flag and pennant patterns. These formations often occur after a strong price movement and represent a brief consolidation period before the previous trend resumes. Flags are characterized by parallel lines that slope against the prevailing trend, while pennants are small symmetrical triangles that form after a strong price movement. Understanding these patterns can provide traders with crucial insights into market momentum and potential continuation of trends.
In summary, recognizing and understanding common chart patterns is vital for any trader looking to navigate the volatile waters of Bitcoin trading. By identifying these formations early, traders can position themselves advantageously, whether they're looking to capitalize on a price rise or protect themselves from potential downturns. The art of trading is not just about numbers; it’s about interpreting the story that the market is telling through these patterns.

Head and Shoulders Pattern
The is one of the most recognized formations in technical analysis and a key indicator for traders looking to forecast price movements in Bitcoin. This pattern typically signals a reversal in the prevailing trend, making it essential for traders to understand its implications. The formation consists of three peaks: the left shoulder, the head, and the right shoulder. The left shoulder represents a price increase followed by a decline, the head is a higher peak followed by another decline, and finally, the right shoulder mirrors the left shoulder but does not surpass the head. This sequence creates a distinctive shape that resembles a person’s silhouette, hence the name.
What makes the head and shoulders pattern particularly powerful is its ability to indicate potential downturns in Bitcoin prices. When traders identify this pattern forming on a chart, it can signal that the bullish trend is losing momentum and that a bearish reversal might be imminent. However, recognizing this pattern is only the first step; traders must also look for confirmation signals to validate their predictions. For instance, a breakout below the neckline—the horizontal line drawn across the lows of the two shoulders—can confirm the reversal and provide a strong entry point for short positions.
Let’s take a closer look at the characteristics of the head and shoulders pattern:
| Component | Description |
|---|---|
| Left Shoulder | Initial rise in price followed by a decline. |
| Head | Higher peak followed by another decline. |
| Right Shoulder | Price rise that peaks lower than the head, followed by a decline. |
| Neckline | Horizontal line connecting the lows of the shoulders. |
In trading the head and shoulders pattern, it’s crucial to combine technical analysis with other indicators to bolster your strategy. For example, observing volume changes during the formation of the pattern can provide additional insights. A significant increase in volume as the price breaks below the neckline can serve as a strong confirmation of the reversal, suggesting that the trend change is backed by substantial market activity.
Moreover, traders should also be wary of false breakouts. Sometimes, the price might dip below the neckline only to quickly recover, leading to confusion and potential losses. Therefore, employing a stop-loss order above the right shoulder can help mitigate risks associated with such scenarios. By understanding and applying the head and shoulders pattern effectively, traders can enhance their ability to navigate the volatile waters of Bitcoin trading.

Inverse Head and Shoulders
The inverse head and shoulders pattern is one of the most exciting formations that traders look for on Bitcoin charts. Why? Because it signals a potential bullish reversal after a downtrend. Imagine a roller coaster: it drops down (the downtrend), and then it prepares for a thrilling climb (the potential uptrend). This pattern consists of three distinct troughs, where the middle trough (the head) is the deepest, flanked by two shallower troughs (the shoulders) on either side. Recognizing this pattern is crucial for traders, as it can indicate a shift in market sentiment and the possibility of rising prices.
To visualize this, picture the following representation:
| Part of the Pattern | Description |
|---|---|
| Left Shoulder | First trough forms after a downtrend, indicating initial selling pressure. |
| Head | Second, deeper trough forms, showing increased selling pressure but also potential exhaustion. |
| Right Shoulder | Final, shallower trough forms, indicating a possible end to the downtrend. |
Now, you might wonder, how do traders capitalize on this pattern? Well, the key is to wait for a breakout above the neckline, which is drawn across the peaks of the left shoulder and the right shoulder. This breakout serves as a confirmation signal that the downtrend is likely over and a new uptrend may be beginning. But hold on; it’s not just about the breakout. Traders often look for additional signals, such as increasing volume, to bolster their confidence in the trade.
In trading, timing is everything. So, once the breakout occurs, many traders set their price targets based on the distance from the head to the neckline, projecting that distance upward from the breakout point. This method provides a reasonable expectation of how high Bitcoin's price might rise following the bullish reversal. However, as with any trading strategy, it’s essential to apply risk management techniques. Always consider setting stop-loss orders to protect your capital in case the market doesn’t behave as anticipated.
In summary, the inverse head and shoulders pattern is a powerful tool in a trader's arsenal. By recognizing this pattern and understanding its implications, traders can position themselves to take advantage of potential price increases in Bitcoin. But remember, it’s not a foolproof method; it requires careful analysis and consideration of other market factors to make informed trading decisions.
- What is the significance of the inverse head and shoulders pattern?
This pattern indicates a potential reversal from a downtrend to an uptrend, making it a valuable signal for traders looking for buying opportunities. - How can I identify the inverse head and shoulders pattern?
Look for three troughs: two shallower ones (shoulders) and one deeper one (head), with a neckline connecting the peaks of the shoulders. - What should I do after identifying this pattern?
Wait for a breakout above the neckline for confirmation, and consider using volume analysis to increase the reliability of your trade. - Can this pattern fail?
Yes, like any trading pattern, the inverse head and shoulders can fail. It’s essential to use risk management strategies to mitigate potential losses.

Trading the Head and Shoulders
Trading the head and shoulders pattern can be an exhilarating yet challenging endeavor for traders looking to capitalize on potential market reversals. This pattern is not just a mere coincidence; it represents a shift in market psychology, where buyers and sellers are engaged in a battle of wills. To effectively trade this formation, one must be vigilant and prepared to act swiftly. Here’s how you can enhance your trading strategy when you spot this pattern:
First and foremost, identifying the pattern correctly is crucial. The head and shoulders pattern consists of three peaks: the left shoulder, the head, and the right shoulder. The left shoulder forms after an uptrend, followed by a higher peak (the head), and then a decline to a neckline. The right shoulder forms as the price rises again but fails to reach the height of the head before declining once more. This sequence signals a potential reversal, indicating that sellers may soon gain control.
Once you've identified the pattern, the next step is to look for confirmation signals. These signals can include changes in trading volume and price action at critical breakout points. For instance, a significant increase in volume during the breakout below the neckline can bolster your confidence in the trade. A table summarizing the key steps for trading the head and shoulders pattern can provide clarity:
| Step | Description |
|---|---|
| 1 | Identify the head and shoulders pattern. |
| 2 | Confirm with volume changes during the breakout. |
| 3 | Set your stop-loss just above the right shoulder. |
| 4 | Determine your profit target based on the height of the pattern. |
Another essential aspect of trading this pattern is setting a stop-loss order. Placing your stop-loss just above the right shoulder can help protect your capital in case the market moves against you. This way, you can minimize potential losses while allowing for some fluctuation in price. Additionally, it’s wise to establish a profit target based on the height of the pattern. For example, if the height from the head to the neckline is 100 points, you could set your profit target 100 points below the breakout point.
Moreover, keep an eye on the overall market sentiment and any external factors that might influence Bitcoin prices. Economic news, regulatory changes, and market trends can all impact the effectiveness of the head and shoulders pattern. By staying informed, you can make more educated decisions and adapt your strategy accordingly.
In conclusion, trading the head and shoulders pattern requires a blend of technical analysis, market awareness, and a solid trading plan. By following the steps outlined, you can enhance your chances of success and navigate the often tumultuous waters of Bitcoin trading with greater confidence.
- What is the head and shoulders pattern?
This pattern is a technical analysis tool that indicates a reversal in trend, consisting of three peaks: the left shoulder, head, and right shoulder. - How do I confirm a head and shoulders pattern?
Confirmation can be achieved by observing volume spikes during the breakout, as well as price action at the neckline. - Where should I place my stop-loss order?
It’s advisable to place your stop-loss just above the right shoulder to minimize potential losses. - How can I set a profit target?
Your profit target can be determined based on the height of the pattern from the head to the neckline.

Triangles and Their Implications
Triangles are fascinating chart patterns that play a pivotal role in the world of trading, especially when it comes to predicting Bitcoin price movements. They represent a period of consolidation, where the price oscillates within converging trend lines. This tightening of price action often leads to a significant breakout or breakdown, making it crucial for traders to identify these patterns early. In the realm of Bitcoin trading, understanding the nuances of triangle patterns can be the difference between a profitable trade and a missed opportunity.
There are three primary types of triangle patterns: ascending triangles, descending triangles, and symmetrical triangles. Each of these patterns has its own implications and can signal different market sentiments:
- Ascending Triangles: This pattern is characterized by a flat upper trend line and an upward-sloping lower trend line. It typically indicates bullish sentiment, suggesting that buyers are becoming increasingly aggressive. When the price breaks above the upper trend line, it often signals a strong upward movement in Bitcoin prices.
- Descending Triangles: In contrast, descending triangles feature a flat lower trend line and a downward-sloping upper trend line. This pattern usually reflects bearish sentiment, as sellers are gaining control. A breakout below the lower trend line can indicate a potential decline in Bitcoin prices.
- Symmetrical Triangles: This pattern has both upper and lower trend lines converging towards a point, indicating indecision in the market. Traders should be cautious, as the breakout can occur in either direction. The direction of the breakout often aligns with the preceding trend, so it’s essential to analyze the context of the pattern.
Recognizing these triangle patterns can significantly enhance a trader's ability to forecast Bitcoin price movements. However, it’s not just about spotting the triangles; traders must also consider the volume accompanying these patterns. For instance, a breakout from an ascending triangle on high volume is generally more reliable than one on low volume. Similarly, a breakout from a descending triangle with increased volume can reinforce the bearish sentiment.
In summary, triangles can serve as powerful indicators of potential price movements in the Bitcoin market. By understanding the implications of each type of triangle and monitoring volume trends, traders can position themselves to capitalize on upcoming price shifts. As always, combining technical analysis with sound risk management strategies will help ensure a balanced approach to trading.

Using Volume with Chart Patterns
When it comes to trading Bitcoin, understanding volume in conjunction with chart patterns is like having a secret weapon in your arsenal. Volume, simply put, refers to the number of assets traded during a specific period. It serves as a crucial indicator of the strength behind price movements. Imagine trying to push a heavy object: if you have a lot of people helping you, it’s much easier to move it. Similarly, high trading volume can signify strong investor interest, which can validate price movements indicated by chart patterns.
For instance, when a chart pattern, such as a head and shoulders or a triangle, forms, traders often look for volume spikes that accompany breakouts. If the price of Bitcoin breaks out of a triangle pattern and is met with a surge in volume, it’s a strong indication that the breakout is genuine and not just a fleeting moment. This scenario is akin to a crowd cheering at a concert; if the noise level suddenly increases, it’s a sign that something significant is happening on stage.
On the flip side, if the price breaks through a resistance level but volume remains low, it might raise a red flag. Low volume during a breakout can suggest that the move lacks support, making it more susceptible to reversal. Think of it like a balloon that’s been inflated but has a small hole; it might look full, but it’s bound to deflate quickly. Therefore, volume analysis is essential for traders looking to make informed decisions based on chart patterns.
To effectively incorporate volume into your trading strategy, consider the following key points:
- Volume Confirmation: Always look for volume spikes that accompany breakouts from chart patterns. This can provide additional confidence in the predicted price movements.
- Volume Divergence: Be aware of situations where price movements and volume trends do not align. For example, if Bitcoin’s price is rising but volume is declining, it may indicate a weakening trend.
- Volume at Support/Resistance Levels: Pay attention to volume levels at key support and resistance points. High volume at these levels can indicate strong buying or selling interest.
Incorporating volume analysis into your trading strategy can significantly enhance your ability to predict Bitcoin price movements. By recognizing the interplay between volume and chart patterns, you can make more informed decisions and increase the likelihood of successful trades. Remember, a well-rounded approach that combines both technical analysis and volume metrics can be the difference between a profitable trade and a missed opportunity.
Q: What is the significance of volume in trading?
A: Volume indicates the strength of a price movement. High volume typically confirms the validity of a breakout or trend, while low volume may signal weakness.
Q: How can I identify volume spikes?
A: Volume spikes can be identified by observing significant increases in the number of trades during a specific period, often visible on volume indicators in trading platforms.
Q: Can low volume lead to false breakouts?
A: Yes, low volume during a breakout can suggest that the move lacks support and may lead to a reversal, making it essential to analyze volume alongside price movements.

Volume Confirmation
When it comes to trading Bitcoin, understanding can be a game changer. Volume confirmation refers to the increase in trading volume that often accompanies a breakout from a chart pattern. Imagine you're at a concert, and the crowd's energy peaks just as the band plays their hit song. That's the kind of excitement you want to see in the market when a breakout occurs. If the price of Bitcoin breaks out of a pattern, but the volume remains low, it’s like a concert with no audience—there's something off. This lack of volume can indicate that the breakout may not hold, leading to potential losses for traders who jump in without proper confirmation.
So, how do you spot volume confirmation? First, look for a noticeable spike in volume that coincides with the breakout. This spike indicates that more traders are entering the market, supporting the price movement. For example, if Bitcoin breaks above a resistance level after forming a triangle pattern, a significant increase in volume during this breakout can signal a strong bullish trend. Conversely, if the breakout occurs with low volume, it might be wise to sit on the sidelines and wait for more confirmation.
To illustrate the importance of volume confirmation, consider the following table:
| Chart Pattern | Volume Behavior | Implication |
|---|---|---|
| Head and Shoulders | High volume during breakout | Strong reversal signal |
| Triangles | Volume increase at breakout point | Potential for significant price movement |
| Flags | Volume spikes on breakout | Continuation of the prevailing trend |
In summary, volume confirmation is not just a technical detail; it’s a crucial aspect of trading that can help you avoid costly mistakes. Always keep an eye on volume trends when analyzing chart patterns. If you notice a breakout but the volume doesn't back it up, it’s better to be cautious. After all, in the world of Bitcoin trading, it’s better to wait for the right moment than to rush in blindly. Remember, trading is as much about patience as it is about action!
- What is volume confirmation? Volume confirmation is the increase in trading volume that occurs during a breakout from a chart pattern, indicating the strength of the price movement.
- Why is volume important in trading? Volume is essential because it provides insight into the strength of a price movement. High volume during a breakout suggests strong interest and support for that movement.
- How can I identify volume spikes? Traders can identify volume spikes by using volume indicators on their trading platforms, which visually represent changes in trading activity.

Volume Divergence
When it comes to trading Bitcoin, one of the most crucial aspects to consider is . This phenomenon occurs when the price of Bitcoin is moving in one direction, while the volume is moving in the opposite direction. It’s like watching a car drive forward while the driver is trying to reverse; it just doesn’t add up! This discrepancy can signal potential market reversals or false breakouts, making it essential for traders to be aware of these indicators.
Understanding volume divergence can be a game-changer in your trading strategy. It often indicates a lack of conviction in the current price trend. For instance, if Bitcoin's price is climbing, but the trading volume is decreasing, it could suggest that the upward movement is losing momentum. This situation can lead to a sudden price drop, catching many traders off guard. Conversely, if prices are falling and volume is decreasing, it could signal a weakening downtrend, hinting at a possible reversal.
To put it into perspective, think of volume as the fuel for the price movement engine. If the engine is revving up but the fuel supply is dwindling, it’s only a matter of time before the engine sputters out. Therefore, recognizing these patterns allows traders to make more informed decisions. Here’s a quick breakdown of how to spot volume divergence:
- Price Up, Volume Down: This suggests that the upward trend may not be sustainable.
- Price Down, Volume Down: Indicates a potential bottoming out, where sellers are losing interest.
- Price Up, Volume Up: Confirms a strong bullish trend.
- Price Down, Volume Up: Signals a strong bearish trend, often leading to further declines.
Traders should also utilize technical indicators like the Relative Strength Index (RSI) or the Moving Average Convergence Divergence (MACD) in conjunction with volume analysis to enhance their predictions. For example, if you observe a bullish divergence on the RSI while the price is dropping, it could indicate that buyers are starting to step in, even if the price has not yet reflected this change.
Moreover, keeping an eye on the overall market sentiment and news can provide additional context to volume divergence. For instance, if there’s positive news about Bitcoin adoption but the price is declining with low volume, it might indicate that traders are hesitant to act, which could lead to an explosive move once the sentiment shifts.
In summary, volume divergence is a powerful tool in a trader's arsenal. By understanding and recognizing these patterns, traders can make more calculated decisions, potentially avoiding pitfalls associated with false breakouts and enhancing their overall trading strategy.
- What is volume divergence? Volume divergence occurs when the price of an asset moves in one direction while the trading volume moves in the opposite direction, signaling potential reversals or false breakouts.
- How can I identify volume divergence? Look for discrepancies between price trends and volume trends, such as rising prices with declining volume or vice versa.
- Why is volume important in trading? Volume provides insight into the strength of a price movement. High volume during a price increase indicates strong buying interest, while low volume may suggest weakness in the trend.
- Can volume divergence predict Bitcoin price movements? Yes, recognizing volume divergence can help traders anticipate potential reversals or breakouts, allowing for more informed trading decisions.
Frequently Asked Questions
- What are chart patterns?
Chart patterns are formations created by the price movements of an asset, like Bitcoin. They help traders identify potential future trends and movements, giving a visual representation of market psychology and investor behavior. Think of them as road signs guiding you through the twists and turns of trading!
- How can I recognize the head and shoulders pattern?
The head and shoulders pattern consists of three peaks: a higher peak (the head) flanked by two lower peaks (the shoulders). It typically signals a reversal in trend, indicating that Bitcoin prices may decline. Spotting this pattern can be crucial for making timely trading decisions!
- What does the inverse head and shoulders pattern indicate?
The inverse head and shoulders pattern is a bullish reversal signal that suggests Bitcoin prices may rise after a downtrend. It looks like an upside-down version of the traditional head and shoulders, and recognizing it can provide great buying opportunities for traders.
- How do I trade the head and shoulders pattern?
To trade the head and shoulders pattern effectively, look for confirmation signals, such as changes in volume and breakout points. These indicators can help increase the likelihood of successful trades, making your trading strategy more robust!
- What are triangle patterns and their implications?
Triangle patterns, including ascending, descending, and symmetrical triangles, indicate periods of consolidation in the market. Recognizing these patterns can help traders predict potential breakouts in Bitcoin prices, allowing them to position themselves advantageously.
- Why is volume analysis important in trading?
Volume analysis is crucial when interpreting chart patterns. Increased volume during a breakout can confirm the validity of the pattern, enhancing the reliability of your price predictions. It’s like having a loud cheer from the crowd when your team scores a goal!
- What is volume divergence and why should I be aware of it?
Volume divergence occurs when price movements and volume trends do not align. Being aware of this can alert traders to potential false breakouts or reversals, allowing for more informed trading decisions. It’s like having a warning light on your dashboard when something’s off with your car!


