How to Analyze Cryptocurrency Charts for Maximum Profit
In the exhilarating world of cryptocurrency trading, understanding how to analyze charts can be the difference between making a fortune and watching your investments dwindle. The volatile nature of cryptocurrencies means that prices can skyrocket or plummet in the blink of an eye, making it essential for traders to have a solid grasp of chart analysis techniques. Whether you're a seasoned trader or a newcomer to the crypto scene, this guide will arm you with the knowledge and tools you need to make informed decisions and maximize your profits.
Chart analysis is not just about looking at lines and numbers; it's about interpreting the market's pulse. Think of it as reading a map before embarking on a journey. Without a clear understanding of where you are and where you're headed, you might end up lost in the wilderness of market fluctuations. By mastering the art of chart analysis, you can navigate through the chaos and emerge victorious.
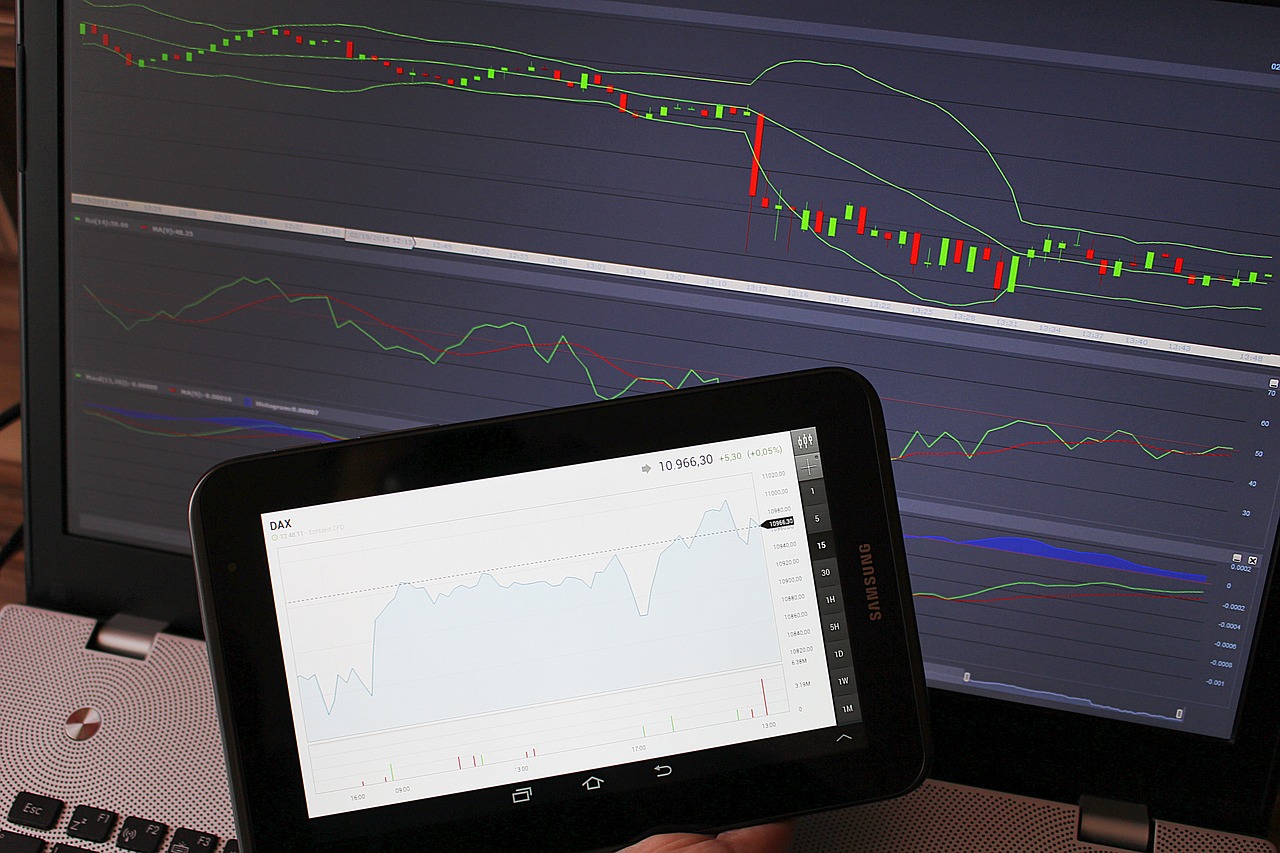
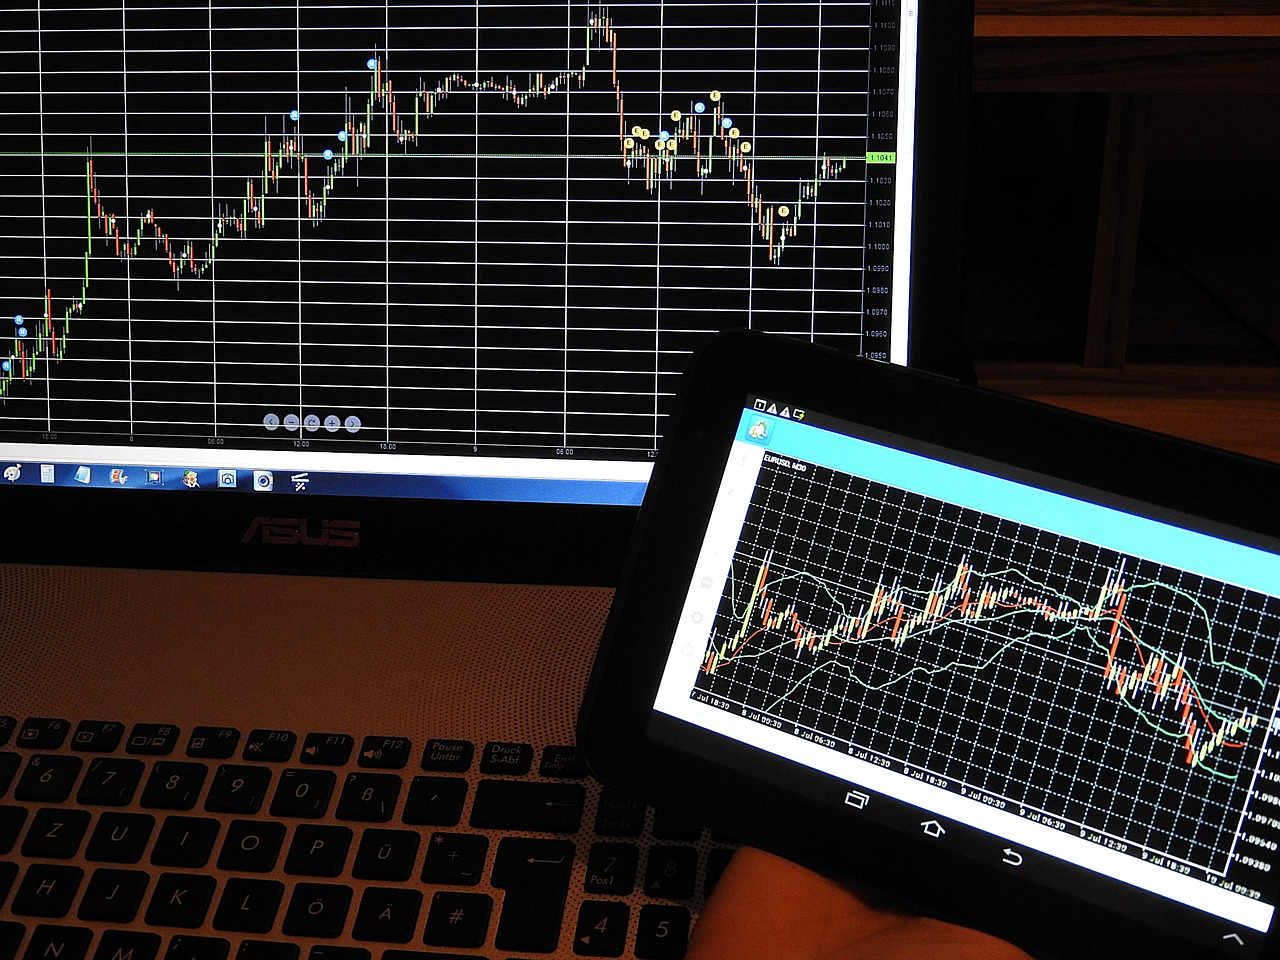
So, what exactly does it take to become proficient in analyzing cryptocurrency charts? First, you'll need to familiarize yourself with candlestick patterns, which are like the heartbeat of market sentiment. These patterns reveal the emotions of traders—fear, greed, and everything in between. Next, you'll delve into key technical indicators that provide insights into market trends. Indicators like the Relative Strength Index (RSI) and Moving Average Convergence Divergence (MACD) can enhance your trading strategies, allowing you to make data-driven decisions.
But it doesn't stop there! Understanding support and resistance levels is crucial for identifying potential price reversals. Think of support as a safety net that catches prices when they fall and resistance as a ceiling that holds them back from rising too high. By pinpointing these levels, you can better manage your risk and optimize your entry and exit points.
As you become more comfortable with charting techniques, you'll encounter various chart patterns that can signal future market movements. Patterns like head and shoulders, triangles, and flags can provide valuable insights into potential breakouts or reversals. Recognizing these patterns is akin to spotting a hidden treasure map that leads you to profitable trades.
Finally, no trading strategy is complete without effective risk management. Setting stop-loss orders and determining position sizes are vital steps to protect your capital. After all, in the unpredictable world of cryptocurrency, safeguarding your investments should always be a top priority.
In summary, analyzing cryptocurrency charts is a multifaceted skill that combines technical knowledge, market psychology, and risk management. By equipping yourself with these essential techniques, you can navigate the crypto landscape with confidence and aim for maximum profit. So, are you ready to dive into the world of chart analysis and unlock your trading potential?
- What are candlestick patterns? Candlestick patterns are graphical representations of price movements over time, helping traders gauge market sentiment.
- How do I use technical indicators? Technical indicators like RSI and MACD provide insights into market trends and can enhance your trading strategies.
- What is the importance of support and resistance levels? Support and resistance levels help traders identify potential price reversals and manage risk effectively.
- What are some common chart patterns? Common chart patterns include head and shoulders, triangles, and flags, which can indicate future market movements.
- How can I manage risk while trading? Setting stop-loss orders and calculating position sizes are essential strategies for managing risk in trading.

Understanding Candlestick Patterns
Candlestick patterns are the lifeblood of technical analysis in the cryptocurrency market. They provide a visual representation of price movements over a specific time frame, allowing traders to gauge market sentiment at a glance. Think of these patterns as the emotional heartbeat of the market; they reveal whether traders are feeling bullish (optimistic) or bearish (pessimistic). By mastering candlestick patterns, you can unlock the secrets behind price movements and make informed decisions that could lead to maximum profit.
Each candlestick consists of four essential components: the open, close, high, and low prices within a given time frame. The body of the candle represents the price range between the open and close, while the wicks (or shadows) extend to show the highest and lowest prices during that period. For instance, if a candlestick has a long body and closes higher than it opened, it indicates strong buying pressure, while a long body that closes lower suggests selling pressure. Understanding these nuances is crucial for interpreting market trends and making timely trading decisions.
There are several key candlestick patterns that every trader should be aware of. Here are a few of the most significant:
- Doji: A doji candlestick forms when the open and close prices are virtually the same, indicating indecision in the market. It often signals a potential reversal.
- Hammer: This pattern appears at the bottom of a downtrend and suggests a potential reversal. The hammer has a small body and a long lower wick.
- Engulfing: An engulfing pattern occurs when a small candle is followed by a larger candle that completely engulfs it. A bullish engulfing pattern indicates a potential upward reversal, while a bearish engulfing pattern suggests a downward reversal.
Recognizing these patterns can significantly enhance your trading strategy. For example, if you spot a hammer pattern after a downtrend, it might be time to consider entering a long position. Conversely, if you see a bearish engulfing pattern at a resistance level, it may signal a good opportunity to sell or short the asset. The key is to combine candlestick analysis with other technical indicators for a more robust trading approach.
In summary, understanding candlestick patterns is essential for any trader looking to navigate the volatile world of cryptocurrencies. By paying close attention to these visual cues, you can better anticipate market movements and make more informed trading decisions. Remember, the market is constantly evolving, so staying updated on new patterns and trends will keep you one step ahead of the game!
Q1: What is a candlestick pattern?
A candlestick pattern is a graphical representation of price movements in a specific time frame, showing the open, close, high, and low prices. It helps traders interpret market sentiment.
Q2: How can I use candlestick patterns in trading?
You can use candlestick patterns to identify potential entry and exit points. By recognizing patterns like hammers or engulfing candles, you can make more informed trading decisions.
Q3: Are candlestick patterns reliable?
While candlestick patterns provide valuable insights, they should not be used in isolation. It's best to combine them with other technical indicators and market analysis for more reliable trading signals.

Key Technical Indicators
When diving into the world of cryptocurrency trading, understanding technical indicators is like having a treasure map in a vast wilderness. These indicators provide traders with essential insights into market trends and potential price movements, allowing them to navigate the often-turbulent waters of the crypto market with confidence. Among the myriad of indicators available, a few stand out for their effectiveness and popularity, including the Relative Strength Index (RSI) and the Moving Average Convergence Divergence (MACD). Each of these tools serves a unique purpose, helping traders to make informed decisions based on market behavior.
The Relative Strength Index (RSI) is a momentum oscillator that measures the speed and change of price movements. Ranging from 0 to 100, the RSI helps traders identify overbought or oversold conditions in a market. Typically, an RSI above 70 indicates that an asset may be overbought, while an RSI below 30 suggests it may be oversold. This information is crucial for traders looking to pinpoint potential reversal points. For instance, if a trader notices the RSI climbing above 70, it might be a signal to consider selling or taking profits, while a dip below 30 could prompt a buying opportunity.
On the other hand, the Moving Average Convergence Divergence (MACD) is a trend-following momentum indicator that shows the relationship between two moving averages of a security's price. The MACD is calculated by subtracting the 26-period Exponential Moving Average (EMA) from the 12-period EMA. The result of this calculation is the MACD line, which traders can use alongside the signal line (the 9-period EMA of the MACD line) to identify potential buy or sell signals. When the MACD line crosses above the signal line, it may indicate a bullish trend, while a cross below could signal a bearish trend. This dual approach allows traders to gauge both momentum and trend direction simultaneously.
To make the most of these indicators, traders often combine them with other analysis methods. For example, using the RSI in conjunction with MACD can provide a more comprehensive view of market dynamics. By analyzing these indicators together, traders can increase their chances of making profitable trades. Here’s a simple table to illustrate the key differences between RSI and MACD:
| Indicator | Type | Purpose | Typical Range |
|---|---|---|---|
| Relative Strength Index (RSI) | Momentum Oscillator | Identifies overbought/oversold conditions | 0 - 100 |
| Moving Average Convergence Divergence (MACD) | Trend-Following Indicator | Indicates trend direction and momentum | Not fixed |
Understanding these key technical indicators can significantly enhance your trading strategy. However, it’s essential to remember that no indicator is foolproof. Market conditions can change rapidly, and relying solely on one or two indicators can lead to missed opportunities or losses. Therefore, it's wise to incorporate a combination of technical indicators, alongside fundamental analysis, to create a well-rounded trading strategy.
In conclusion, mastering the use of technical indicators like RSI and MACD can empower traders to make more informed decisions in the cryptocurrency market. By understanding how these indicators work and how to interpret their signals, you can increase your chances of success and navigate the unpredictable landscape of cryptocurrency trading with greater ease.
- What is the best technical indicator for cryptocurrency trading? There isn't a one-size-fits-all answer, as different indicators serve different purposes. However, many traders find a combination of RSI and MACD effective.
- How do I use RSI in my trading strategy? You can use RSI to identify potential reversal points by looking for overbought (above 70) or oversold (below 30) conditions.
- Can I rely solely on technical indicators for trading? While technical indicators are valuable tools, it's essential to consider other factors, such as market news and fundamentals, to make well-informed trading decisions.

Moving Averages
When it comes to analyzing cryptocurrency charts, are like the trusty compass that guides traders through the turbulent waters of the market. They help smooth out price data, allowing traders to spot trends more easily. Think of moving averages as a way to filter out the noise of sudden price fluctuations, giving you a clearer picture of where the market might be heading. They are essential tools that can enhance your trading strategy and improve your decision-making process.
There are two primary types of moving averages that traders commonly use: the Simple Moving Average (SMA) and the Exponential Moving Average (EMA). Each has its unique characteristics and applications, making them suitable for different trading scenarios. Let’s dive deeper into what makes these moving averages tick and how you can effectively use them in your trading endeavors.
The Simple Moving Average (SMA) is calculated by taking the average price of a cryptocurrency over a specified period. For instance, a 50-day SMA sums up the closing prices of the last 50 days and divides it by 50. This average moves along the chart, creating a smooth line that helps traders identify the overall trend. The SMA is particularly useful for long-term traders who want to catch significant price movements without getting distracted by daily volatility. However, it can lag behind the price action, which is something to keep in mind.
On the other hand, the Exponential Moving Average (EMA) places a greater emphasis on recent prices, making it more responsive to price changes. This characteristic makes the EMA an excellent choice for short-term traders who want to capitalize on quick price movements. For example, a 20-day EMA reacts faster to recent price shifts than a 50-day SMA would, providing traders with timely signals for entering or exiting trades. The key takeaway here is that while both moving averages are valuable, the choice between SMA and EMA depends on your trading style and goals.
To illustrate the differences between these two types of moving averages, consider the following table:
| Type of Moving Average | Calculation Method | Best For |
|---|---|---|
| Simple Moving Average (SMA) | Averages prices over a specified period | Long-term trends |
| Exponential Moving Average (EMA) | Gives more weight to recent prices | Short-term trends |
Incorporating moving averages into your trading strategy can significantly enhance your ability to predict future price movements. For instance, many traders look for crossovers between the SMA and EMA as potential buy or sell signals. A bullish crossover occurs when a shorter-term moving average crosses above a longer-term moving average, suggesting a potential upward trend. Conversely, a bearish crossover happens when the shorter-term moving average crosses below the longer-term moving average, indicating a potential downward trend.
Ultimately, understanding moving averages is just one piece of the puzzle in the world of cryptocurrency trading. By combining them with other technical indicators and analysis methods, you can create a more robust trading strategy that increases your chances of success. So, the next time you look at a cryptocurrency chart, remember to keep an eye on those moving averages—they might just be the key to unlocking your trading potential!
- What is the main difference between SMA and EMA? The SMA gives equal weight to all prices in the period, while the EMA gives more weight to recent prices, making it more responsive to price changes.
- How can I use moving averages in my trading strategy? You can use moving averages to identify trends, look for crossovers as buy/sell signals, and combine them with other indicators for a more comprehensive analysis.
- Are moving averages effective for all cryptocurrencies? Yes, moving averages can be applied to any cryptocurrency, but their effectiveness may vary based on market conditions and trading styles.

Simple Moving Average (SMA)
The is one of the most fundamental tools in a trader's arsenal. It’s like a smooth operator in the chaotic world of cryptocurrency, helping to filter out the noise and reveal the underlying trend. The SMA is calculated by taking the average of a specific number of past prices, which allows traders to see the direction in which the market is moving over a set period. For instance, if you're looking at a 10-day SMA, you simply add up the closing prices of the last 10 days and divide by 10.
One of the biggest advantages of using the SMA is its simplicity. It’s easy to understand and apply, making it a go-to choice for both novice and experienced traders. However, while the SMA is great for identifying trends, it does have some drawbacks. For instance, it can lag behind the price action because it relies on historical data. This means that by the time the SMA indicates a trend change, the market may have already moved significantly.
But don't let that deter you! The SMA can be incredibly effective when used in conjunction with other indicators. For example, you might want to look at how the SMA interacts with the price. If the price crosses above the SMA, it might be a signal to buy, while a price drop below the SMA could indicate a sell signal. This crossover strategy is popular among traders because it combines the clarity of the SMA with real-time price action.
Let’s take a look at a simple example:
| Day | Closing Price | SMA (10-day) |
|---|---|---|
| 1 | $100 | - |
| 2 | $102 | - |
| 3 | $101 | - |
| 4 | $104 | - |
| 5 | $103 | - |
| 6 | $105 | - |
| 7 | $107 | - |
| 8 | $108 | - |
| 9 | $110 | - |
| 10 | $112 | $105.2 |
In this table, you can see how the SMA is calculated after the 10th day. This average provides a clearer picture of the price trend, smoothing out the fluctuations that can lead to impulsive trading decisions. By keeping an eye on the SMA, traders can maintain a more disciplined approach to their trading strategies.
In conclusion, the Simple Moving Average is a powerful tool for anyone looking to navigate the sometimes turbulent waters of cryptocurrency trading. It may not be perfect, but when combined with other indicators and a solid understanding of market dynamics, it can significantly enhance your trading strategy. Remember, it’s all about finding the right balance and using the SMA as one of many tools in your trading toolkit!
- What is the main purpose of the SMA? The main purpose of the SMA is to help traders identify the direction of the trend by smoothing out price data over a specific period.
- How do I calculate the SMA? To calculate the SMA, add the closing prices of the selected period and divide by the number of periods.
- Can I use the SMA for day trading? Yes, many day traders use the SMA to identify short-term trends and make quick trading decisions.
- What are the limitations of using the SMA? The SMA can lag behind the price action and may not react quickly to sudden market changes, which could lead to missed opportunities.

Exponential Moving Average (EMA)
The is a powerful tool in the arsenal of any cryptocurrency trader. Unlike the Simple Moving Average (SMA), which treats all price points equally, the EMA gives greater weight to more recent prices. This characteristic makes it particularly responsive to price changes, allowing traders to react swiftly to market movements. Imagine the EMA as a keen-eyed hawk, always alert and ready to swoop in at the first sign of opportunity. By focusing on the latest data, the EMA helps traders stay ahead of the curve in the fast-paced world of cryptocurrency.
To calculate the EMA, you need to know the previous EMA, the current price, and a smoothing factor, which is derived from the number of periods you wish to analyze. The formula looks like this:
EMA (Current Price x (Smoothing Factor)) + (Previous EMA x (1 - Smoothing Factor))
For example, if you're using a 10-day EMA, the smoothing factor would be calculated as:
Smoothing Factor 2 / (N + 1)
Where N is the number of periods (in this case, 10). This results in a smoothing factor of 0.1818. The EMA's responsiveness makes it a favorite among short-term traders looking for quick entry and exit points. However, it’s essential to remember that while the EMA can signal potential trends, it’s not foolproof. Like any tool, it works best when combined with other indicators and analysis techniques.
Traders often use the EMA in conjunction with other moving averages, such as the SMA, to identify potential crossover points. A common strategy is to look for the golden cross and death cross, which occur when a short-term EMA crosses above or below a long-term EMA, respectively. These crossovers can serve as powerful buy or sell signals. Picture it as a dance between two partners: when they move in sync, it signals harmony in the market; when they diverge, it can indicate impending volatility.
In summary, the EMA is not just another line on a chart; it's a dynamic indicator that can provide valuable insights into market trends. By understanding how to calculate and interpret the EMA, traders can enhance their decision-making process, leading to more informed and potentially profitable trading strategies.
- What is the main difference between EMA and SMA? The EMA reacts more quickly to recent price changes compared to the SMA, making it more suitable for short-term trading.
- How can I use EMA in my trading strategy? Traders often use EMA crossovers, along with other indicators, to identify potential buy and sell signals.
- Is EMA suitable for all trading styles? While the EMA is particularly beneficial for short-term traders, it can also be used by long-term traders when combined with other analysis techniques.
Volume Analysis
When diving into the world of cryptocurrency trading, one of the most significant yet often overlooked aspects is . This crucial factor acts as a barometer for market activity, helping traders gauge the strength of price movements. Think of trading volume as the heartbeat of the market; when it's strong, you can feel the momentum, and when it's weak, the market can feel lifeless. Understanding how to interpret trading volume can be the difference between making a profitable trade and watching your investment dwindle.
So, what exactly is volume in the context of trading? Simply put, volume refers to the number of units traded within a specific timeframe. It provides insights into how much interest there is in a particular cryptocurrency. For instance, if Bitcoin's trading volume surges while its price is climbing, it indicates that many traders are buying in, which likely supports the upward price movement. Conversely, if the price is rising but the volume is low, it could signal a lack of conviction in that price increase, suggesting it might not last.
To effectively analyze volume, traders often look for certain patterns and relationships between price and volume. Here are a few key points to keep in mind:
- Volume Spikes: A sudden increase in volume can indicate a significant event or news affecting the cryptocurrency, leading to rapid price movements.
- Volume Divergence: When price makes a new high or low but volume does not confirm that movement, it can signal a potential reversal. For example, if Bitcoin reaches a new peak but volume decreases, it might suggest that the rally is losing steam.
- Volume and Breakouts: During a breakout, an increase in volume is a positive sign, as it indicates strong interest in the new price level. Traders often look for volume to confirm breakouts from key support or resistance levels.
Moreover, combining volume analysis with other technical indicators can provide even more powerful insights. For instance, the Relative Strength Index (RSI) can help traders determine if a cryptocurrency is overbought or oversold, while volume can confirm the strength of that signal. If the RSI shows that a crypto is overbought, but volume is also increasing, it might suggest that traders are still willing to buy at those elevated prices, potentially leading to further gains.
In essence, volume analysis is not just about looking at numbers; it's about understanding the story those numbers tell. It’s like reading between the lines of a novel—sometimes, the real plot twist lies in the subtle cues, and in trading, those cues can lead to significant financial outcomes. By incorporating volume analysis into your trading strategy, you can make more informed decisions, better manage your risks, and ultimately enhance your chances of success in the unpredictable world of cryptocurrency.
Support and Resistance Levels
Understanding is like having a secret map in the unpredictable world of cryptocurrency trading. These levels act as psychological barriers where prices tend to stall or reverse, and recognizing them can significantly enhance your trading strategy. Support levels are the price points at which buying interest is strong enough to overcome selling pressure. Conversely, resistance levels are where selling interest is robust enough to halt upward price movement. By pinpointing these levels, traders can make more informed decisions about when to enter or exit trades, ultimately maximizing profits.
To identify support and resistance levels, traders often look at historical price data and chart patterns. The more times a price has bounced off a particular level, the stronger that support or resistance is deemed to be. For instance, if Bitcoin has hit $40,000 multiple times and rebounded, that level may be considered a strong support level. On the flip side, if it has struggled to break above $45,000, that could be seen as a significant resistance level.
Here's a quick breakdown of how to identify these levels:
- Historical Prices: Review past price movements to find levels where the price has repeatedly reversed.
- Volume Analysis: High trading volume at certain price points can indicate strong support or resistance.
- Moving Averages: These can also act as dynamic support and resistance levels, particularly the 50-day and 200-day moving averages.
Support and resistance levels are not just static points; they can evolve over time with market conditions. For example, when a resistance level is breached, it can turn into a support level, and vice versa. This phenomenon is crucial for traders to understand, as it can provide new opportunities for entering the market.
Incorporating support and resistance levels into your trading strategy can help you manage risk more effectively. By setting your stop-loss orders just below a support level or just above a resistance level, you can protect your capital while allowing for potential price fluctuations. This strategic approach not only minimizes losses but also maximizes your chances of capitalizing on profitable trades.
To summarize, support and resistance levels are essential tools in a trader's arsenal. By understanding how to identify and interpret these levels, you can greatly enhance your trading decisions and increase your profitability in the volatile cryptocurrency market. As you practice and gain experience, these concepts will become second nature, allowing you to navigate the charts with confidence and precision.
What are support and resistance levels?
Support and resistance levels are price points where the market tends to reverse direction due to the balance of buying and selling pressure. Support is where prices tend to stop falling, while resistance is where prices tend to stop rising.
How do I identify support and resistance levels?
You can identify these levels by analyzing historical price charts, looking for points where the price has bounced off multiple times, and considering volume levels at those points.
Can support and resistance levels change?
Yes, when a resistance level is breached, it can become a support level, and vice versa. The dynamics of the market can shift these levels over time.
How can I use support and resistance in my trading strategy?
By setting stop-loss orders near these levels and planning your entries and exits accordingly, you can better manage your risk and improve your trading outcomes.

Identifying Support Levels
Identifying support levels is a fundamental skill every trader should master. These levels represent price points where buying interest is strong enough to overcome selling pressure, effectively preventing the price from falling further. Think of support levels as a safety net for prices; when they hit this net, buyers jump in, creating a bounce back up. But how can you spot these critical levels? It’s not as daunting as it seems!
One of the most effective ways to identify support levels is by analyzing historical price data. Traders often look for areas on the chart where the price has previously reversed direction. These points can be identified visually, but there are also some handy tools and techniques you can use:
- Historical Price Points: Check past price levels where the cryptocurrency has bounced back. These are often strong indicators of future support.
- Trend Lines: Drawing trend lines can help visualize support. A rising trend line, for example, can indicate an area of support as the price moves upward.
- Moving Averages: Using moving averages, like the Simple Moving Average (SMA), can provide dynamic support levels. Prices often bounce off these moving averages, creating a fluid support level that adapts to market changes.
Moreover, it’s essential to consider the volume of trades at these support levels. A high trading volume at a particular price point can strengthen the support level, indicating that many traders believe the price will not drop below this point. Conversely, if the price approaches a support level with low volume, it might suggest that the support is weak and could break.
Another critical aspect is the concept of psychological levels. Traders often place buy orders at round numbers, such as $10,000 or $15,000. These levels can act as support simply because many traders are watching them, leading to increased buying activity. So, keep an eye on these psychological barriers as they often serve as informal support levels.
In summary, identifying support levels involves a combination of historical analysis, technical tools, and an understanding of trader psychology. By honing this skill, you can make more informed trading decisions, manage your risks better, and ultimately enhance your profitability in the volatile world of cryptocurrency trading.
Q: How do I know if a support level is strong?
A strong support level is typically characterized by multiple price bounces off the same level, high trading volume, and a significant number of traders placing buy orders around that price point.
Q: Can support levels change over time?
Yes, support levels can change as market conditions evolve. New data, trends, and trader sentiment can all influence whether a support level remains valid.
Q: What should I do if the price breaks through a support level?
If the price breaks through a support level, it may indicate a shift in market sentiment. Traders often reassess their strategies and may consider setting new support levels or adjusting their stop-loss orders accordingly.

Identifying Resistance Levels
When it comes to trading cryptocurrencies, understanding resistance levels is crucial for making informed decisions. Resistance levels are price points where the selling pressure tends to increase, causing the price to struggle to move higher. Think of resistance as a ceiling that the price has a hard time breaking through. Just like a balloon that can only rise so high before it pops, prices can only soar until they hit a resistance level. Recognizing these levels can help traders make strategic decisions about when to enter or exit a trade.
To identify resistance levels, traders often look at historical price data. This can be done by analyzing charts and pinpointing previous highs where the price reversed direction. Here are some methods to help you identify resistance levels effectively:
- Previous Highs: Look for price peaks on the chart. If the price has struggled to exceed a certain level in the past, that level may serve as future resistance.
- Trend Lines: Drawing trend lines across the peaks can help visualize resistance levels. A downward trend line connecting multiple highs can indicate a strong resistance zone.
- Moving Averages: Sometimes, moving averages can also act as dynamic resistance levels. For instance, if the price approaches a moving average that has previously held as resistance, it may struggle to break through again.
It's important to note that resistance levels are not set in stone. Market conditions can change rapidly, and what was once a strong resistance level may become a support level if the price breaks through it. This phenomenon is often referred to as the support-resistance flip. For example, if the price breaks above a resistance level, that level may now act as a support level in the future. This dynamic nature of resistance levels emphasizes the need for continuous analysis and adjustment to your trading strategy.
Incorporating volume analysis can also enhance your ability to identify resistance levels. If a price approaches a resistance level with high trading volume, it suggests strong selling pressure, increasing the likelihood that the resistance will hold. Conversely, if the price approaches resistance on low volume, it may indicate a lack of conviction among sellers, potentially leading to a breakout. Understanding the relationship between price movements and volume is vital for traders aiming to make the most of resistance levels.
In summary, identifying resistance levels is a fundamental aspect of technical analysis in cryptocurrency trading. By recognizing where these levels exist and understanding their implications, traders can make more informed decisions, ultimately maximizing their profit potential. Remember, the key is to stay vigilant and adaptable, as the crypto market can be unpredictable and volatile.
Q: What happens if the price breaks through a resistance level?
A: If the price breaks above a resistance level, it could signal a strong bullish trend, and that level may become a new support level.
Q: How can I confirm that a resistance level is valid?
A: You can confirm a resistance level by observing multiple price touches at that level, along with increased volume during those touches.
Q: Are resistance levels the same for all cryptocurrencies?
A: Resistance levels can vary significantly between different cryptocurrencies due to their unique market dynamics and trading volumes.

Chart Patterns to Watch
When it comes to trading cryptocurrencies, understanding chart patterns can significantly enhance your ability to predict market movements. These patterns serve as visual cues that indicate potential price directions, helping traders make informed decisions. Think of chart patterns as the road signs of the trading world; they guide you on where to go and when to make your move. Among the myriad of patterns out there, a few stand out as particularly significant for traders looking to maximize their profits.
One of the most recognizable patterns is the head and shoulders. This pattern is often seen as a signal of a trend reversal, indicating that the market is likely to shift direction. It consists of three peaks: a higher peak (the head) between two lower peaks (the shoulders). When traders spot this formation, it’s akin to seeing a warning light on the dashboard of your car; it’s time to pay attention. The implication here is that after a bullish trend, the market may soon turn bearish, presenting a prime opportunity for traders to capitalize on the shift.
Another crucial pattern to watch is the triangle pattern. Triangles can form in three variations: ascending, descending, and symmetrical. Each of these formations indicates a period of consolidation where the price is tightening, leading to a breakout. Imagine a coiled spring; the tighter it gets, the more powerful the release will be. Traders keen on spotting these patterns can position themselves advantageously before the breakout occurs. Here’s a brief overview of the triangle types:
| Triangle Type | Description | Breakout Direction |
|---|---|---|
| Ascending Triangle | Flat top with rising bottoms, indicating buying pressure. | Typically bullish |
| Descending Triangle | Flat bottom with declining tops, indicating selling pressure. | Typically bearish |
| Symmetrical Triangle | Converging trend lines, indicating indecision in the market. | Can break either way |
Lastly, traders should also be aware of flags and pennants. These patterns typically occur after a strong price movement and represent a brief consolidation period before the trend continues. Flags appear as rectangular shapes that slope against the prevailing trend, while pennants are small symmetrical triangles that form after a sharp price movement. Recognizing these patterns can be like catching a glimpse of a shooting star—if you act quickly, you might just be able to ride the wave of momentum that follows.
In conclusion, chart patterns are invaluable tools in a trader’s arsenal. By learning to identify and interpret these patterns, you can gain insights into market sentiment and potential future movements. Remember, trading is not just about numbers; it's about understanding the story behind those numbers. So, keep your eyes peeled for these chart patterns, and you might just find yourself ahead of the game!
- What are chart patterns? Chart patterns are formations created by the price movements of an asset on a chart, indicating potential future movements.
- How can I identify a head and shoulders pattern? Look for three peaks: a higher peak in the middle (the head) and two lower peaks on either side (the shoulders).
- What is the significance of triangle patterns? Triangle patterns indicate periods of consolidation and can signal potential breakouts in either direction.
- Are flags and pennants reliable indicators? Yes, they often indicate a continuation of the previous trend after a brief consolidation phase.
Head and Shoulders
The head and shoulders pattern is one of the most recognized and reliable indicators of a trend reversal in the cryptocurrency market. It typically appears at the peak of an uptrend and signals that the price is likely to move downward. This pattern consists of three peaks: the first is a smaller peak (the left shoulder), followed by a higher peak (the head), and finally, a smaller peak that mirrors the first (the right shoulder). Understanding this formation can be a game-changer for traders, as it provides a clear visual cue for potential selling opportunities.
To identify a head and shoulders pattern, traders should look for the following characteristics:
- The left shoulder is formed when the price rises to a peak and then declines.
- The head is created when the price rises again, surpassing the height of the left shoulder, and then declines once more.
- The right shoulder forms when the price rises again but does not exceed the height of the head before declining.
Once this pattern is recognized, the neckline becomes crucial. The neckline is drawn by connecting the lowest points of the declines from the left shoulder and the head. A breakout below this neckline confirms the pattern and indicates a potential price drop. The distance from the head to the neckline can be used to estimate the potential decline in price, which is often referred to as the price target.
Here's a simple table to illustrate the components of the head and shoulders pattern:
| Component | Description |
|---|---|
| Left Shoulder | First peak before the head, followed by a decline. |
| Head | Highest peak in the pattern, followed by another decline. |
| Right Shoulder | Final peak that is lower than the head, followed by a decline. |
| Neckline | Line connecting the lows of the left shoulder and head. |
Traders can use the head and shoulders pattern in conjunction with other indicators, such as volume analysis. For instance, a significant increase in volume during the formation of the right shoulder can strengthen the validity of the pattern. Conversely, if the volume decreases, it may indicate a lack of conviction in the trend reversal.
In conclusion, mastering the head and shoulders pattern can greatly enhance a trader's ability to predict market movements and make informed decisions. Its reliability in signaling trend reversals makes it an essential tool in the arsenal of any cryptocurrency trader. So, next time you analyze a chart, keep an eye out for this powerful pattern—it could be the key to unlocking your next profitable trade!
- What does the head and shoulders pattern indicate? It indicates a potential reversal from an uptrend to a downtrend.
- How can I confirm a head and shoulders pattern? Look for a breakout below the neckline with increased volume.
- Can the head and shoulders pattern appear in downtrends? Yes, the inverse head and shoulders pattern signals a potential reversal from a downtrend to an uptrend.
- What is the significance of the neckline? The neckline is crucial for confirming the pattern; a breakout below it suggests a strong trend reversal.

Triangles
Triangle patterns are fascinating formations that indicate periods of consolidation in the market. They emerge when price movements start to narrow, creating a visual representation of indecision between buyers and sellers. Understanding these patterns can be a game-changer for traders looking to capitalize on potential breakout scenarios. There are three main types of triangle patterns: ascending triangles, descending triangles, and symmetrical triangles. Each of these patterns has its own unique characteristics and implications for future price movements.
Ascending triangles are typically bullish patterns that form when the price creates higher lows while facing a horizontal resistance level. This pattern suggests that buyers are gaining strength, and a breakout above the resistance line can signal a significant upward movement. Traders often look for a breakout confirmation, which usually occurs when the price closes above the resistance level on strong volume. This can provide a solid entry point for traders looking to ride the upward momentum.
On the other hand, descending triangles are generally considered bearish patterns. They form when the price creates lower highs while maintaining a horizontal support level. This pattern indicates that sellers are becoming increasingly aggressive, and a breakdown below the support line can signal a potential downward movement. Traders should be cautious and wait for confirmation through volume before entering a trade, as false breakouts can occur.
Lastly, we have symmetrical triangles, which can be either bullish or bearish depending on the direction of the breakout. These patterns form when the price creates both higher lows and lower highs, leading to a convergence of the trend lines. The key to trading symmetrical triangles is to watch for a strong breakout in either direction. Traders often use volume as a confirmation indicator, as a breakout accompanied by high volume is more likely to sustain momentum.
To summarize, triangle patterns are essential tools in a trader's arsenal. They not only provide visual cues for potential market movements but also help traders make informed decisions based on price action. Here's a quick overview of the three triangle types and their implications:
| Triangle Type | Market Sentiment | Breakout Direction |
|---|---|---|
| Ascending Triangle | Bullish | Upward |
| Descending Triangle | Bearish | Downward |
| Symmetrical Triangle | Neutral | Either Direction |
By recognizing these patterns and understanding their implications, traders can enhance their strategies and increase their chances of success in the ever-evolving cryptocurrency market. So, the next time you look at a chart, keep an eye out for these triangles—they might just lead you to your next profitable trade!
- What is the significance of triangle patterns in trading?
Triangle patterns help traders identify potential breakout points and market sentiment, allowing for more informed trading decisions.
- How can I confirm a breakout from a triangle pattern?
Confirmation typically comes from a strong price movement accompanied by high trading volume, indicating that the breakout is likely to sustain.
- Are triangle patterns reliable for predicting market movements?
While triangle patterns can provide valuable insights, they are not foolproof. It's essential to use them in conjunction with other technical indicators and market analysis.

Risk Management Strategies
When it comes to trading cryptocurrencies, one of the most crucial aspects that often gets overlooked is risk management. Without a solid plan in place, even the most seasoned traders can find themselves in precarious positions, especially in a market as volatile as crypto. Think of it like sailing a ship in turbulent waters; without a good anchor, you might drift off course or, worse, capsize. So, how do you ensure that your trading journey remains steady and profitable?
Firstly, it's essential to understand that effective risk management is not just about minimizing losses; it's about maximizing your potential for profit while safeguarding your capital. One fundamental strategy is to set stop-loss orders. These are predetermined price points where you will automatically sell your assets to prevent further losses. For instance, if you buy Bitcoin at $40,000, you might set a stop-loss order at $38,000. This means if the price drops to $38,000, your asset will be sold automatically, limiting your loss to $2,000. This strategy allows you to maintain control over your investments and avoid emotional decision-making in the heat of the moment.
Another critical component of risk management is position sizing. This refers to how much capital you allocate to a specific trade. A common rule of thumb is to risk only a small percentage of your total trading capital on a single trade—typically between 1% to 3%. This way, even if a few trades go against you, your overall portfolio remains intact. For example, if you have a trading capital of $10,000 and decide to risk 2% per trade, you would only risk $200. This approach not only protects your capital but also gives you the flexibility to stay in the game longer, allowing for recovery from losses.
To better illustrate these concepts, consider the following table that outlines a hypothetical trading scenario:
| Trade | Entry Price | Stop-Loss Price | Risk per Trade ($) | Position Size ($) |
|---|---|---|---|---|
| Trade 1 | $40,000 | $38,000 | $2,000 | $10,000 |
| Trade 2 | $45,000 | $43,500 | $1,500 | $7,500 |
| Trade 3 | $50,000 | $48,000 | $2,000 | $10,000 |
This table demonstrates how different trades can have varying entry and stop-loss prices while maintaining a consistent risk management strategy. By keeping your risk per trade within a manageable range, you can weather the inevitable storms of the market without sinking your entire portfolio.
Lastly, it's vital to continuously review and adjust your risk management strategies as market conditions change. The cryptocurrency landscape is dynamic, and what works today might not work tomorrow. Regularly assessing your performance and refining your approach can help you stay ahead of the curve and ensure that your trading remains profitable.
- What is the most important aspect of risk management? The most important aspect is understanding your risk tolerance and setting appropriate stop-loss orders to protect your capital.
- How can I calculate my position size? You can calculate your position size by determining the percentage of your total capital you are willing to risk on a trade and then applying that to your stop-loss distance.
- Should I always use stop-loss orders? While it's not mandatory, using stop-loss orders is highly recommended as they help automate your risk management and prevent emotional trading decisions.

Setting Stop-Loss Orders
When it comes to trading cryptocurrencies, one of the most important tools in your arsenal is the stop-loss order. This nifty feature acts like a safety net, protecting your investments from unexpected market downturns. Imagine you're on a roller coaster, and just as you're about to take that thrilling plunge, you have a safety harness that keeps you secure. That's precisely what a stop-loss order does for your trades—it helps you manage risk and maintain your sanity in a volatile market.
So, how do you set an effective stop-loss order? It all starts with understanding your own risk tolerance. Are you the type who can handle a 5% dip in your investment, or do you prefer to play it safe with a tighter margin? Knowing your comfort level is crucial because it will guide you in determining where to place your stop-loss. Typically, traders will set their stop-loss orders at a percentage below the entry price, which might range anywhere from 1% to 10% depending on the volatility of the asset.
Here’s a simple formula to help you decide on your stop-loss level:
- Identify your entry price.
- Determine your risk percentage.
- Calculate your stop-loss price by subtracting the risk percentage from your entry price.
Another crucial aspect of setting stop-loss orders is to consider the market conditions. The crypto market can be incredibly volatile, with prices swinging wildly in short periods. This unpredictability means that a stop-loss set too close to the current price might get triggered by normal market fluctuations, leading to unnecessary losses. Therefore, it’s essential to give your trades some breathing room while still being mindful of your risk tolerance.
Moreover, traders often use technical analysis to determine optimal stop-loss levels. For instance, placing a stop-loss just below a significant support level can be a wise strategy. If the price breaks through this level, it may indicate a further decline, and your stop-loss will help you exit before the situation worsens. Conversely, if you're looking to capitalize on positive momentum, setting a stop-loss just below a recent high can protect your profits while allowing for potential gains.
Lastly, it’s crucial to remember that stop-loss orders are not foolproof. In highly volatile markets, there can be instances of slippage, where your order may not execute at the exact price you set. This is particularly common during sudden price drops or spikes. Therefore, while stop-loss orders are an essential part of risk management, they should be used in conjunction with other strategies to ensure your trading approach is as robust as possible.
- What is a stop-loss order? A stop-loss order is an instruction to sell a cryptocurrency when it reaches a specific price, helping to limit potential losses.
- How do I determine my stop-loss level? Your stop-loss level should be based on your risk tolerance and market conditions, often set as a percentage below your entry price.
- Can stop-loss orders guarantee profit? No, while they can help minimize losses, they do not guarantee profits and can be affected by market volatility.
- What is slippage in trading? Slippage occurs when a stop-loss order is executed at a different price than expected, often due to rapid market movements.
Position Sizing
When diving into the world of cryptocurrency trading, one of the most crucial aspects to consider is . But what exactly does this mean? Simply put, position sizing refers to the amount of capital you decide to allocate to a specific trade. It’s like deciding how much of your pie you want to share with your friends at a party; you want to ensure that everyone gets a taste, but you also want to save enough for yourself!
Understanding position sizing is essential for managing your risk effectively. Imagine you have a trading account with $10,000, and you’re considering a trade that you believe has a high probability of success. Instead of throwing a large chunk of your capital into that trade, it’s wise to determine a percentage of your account that you’re willing to risk. A common rule of thumb is to risk no more than 1% to 2% of your trading capital on a single trade. This way, even if the trade doesn’t go as planned, you’re not putting your entire account at risk.
To illustrate this, let’s say you decide to risk 1% of your $10,000 account, which amounts to $100. If your analysis suggests that you should set a stop-loss order at a certain price level, you can calculate how many coins to buy based on your risk tolerance and the distance between your entry point and your stop-loss level. This brings us to the formula:
| Formula | Description |
|---|---|
| Position Size (Account Risk Amount) / (Entry Price - Stop-Loss Price) | This formula helps you determine how many units of the asset you should purchase. |
Using our earlier example, if you decide to enter a trade at $50 and set your stop-loss at $45, your potential loss per share is $5. Plugging this into the formula gives:
Position Size $100 / ($50 - $45) 20 shares
By calculating your position size in this manner, you ensure that you’re not risking more than you can afford to lose, which is a fundamental principle of successful trading. But remember, position sizing isn’t a one-size-fits-all approach. It should be tailored to your individual risk tolerance, trading strategy, and market conditions.
In addition to risk management, position sizing can also help you optimize your profits. If you find that a particular trading strategy is consistently yielding positive results, you might consider gradually increasing your position size. However, this should be done cautiously and in alignment with your overall risk management strategy. Think of it like watering a plant; too much water can drown it, but too little can stunt its growth. Finding that balance is key!
In summary, mastering position sizing is not just about protecting your capital; it’s a vital tool for enhancing your trading performance. Always remember to evaluate your risk tolerance, adjust your position sizes accordingly, and remain disciplined in your approach. After all, in the unpredictable world of cryptocurrencies, a well-thought-out position sizing strategy can be the difference between a thriving trading career and a costly misadventure.
- What is the best percentage to risk per trade? Most traders recommend risking between 1% to 2% of your total capital on a single trade.
- How do I determine my stop-loss level? Your stop-loss level should be based on technical analysis, volatility, and your risk tolerance.
- Can I adjust my position size based on market conditions? Absolutely! Adjusting your position size based on market volatility and your confidence in the trade is a smart approach.
- What happens if I exceed my risk tolerance? Exceeding your risk tolerance can lead to significant losses and emotional stress, which can negatively impact your trading decisions.
Frequently Asked Questions
- What are candlestick patterns and why are they important?
Candlestick patterns are visual representations of price movements over a specific time frame. They are important because they help traders interpret market sentiment, allowing them to identify potential entry and exit points. Recognizing these patterns can significantly enhance trading strategies.
- How do I use technical indicators in cryptocurrency trading?
Technical indicators, such as the Relative Strength Index (RSI) and Moving Average Convergence Divergence (MACD), provide insights into market trends. Traders use these indicators to gauge momentum, identify overbought or oversold conditions, and make informed decisions based on historical data.
- What is the difference between Simple Moving Average (SMA) and Exponential Moving Average (EMA)?
The Simple Moving Average (SMA) calculates the average price over a specified period, treating all prices equally. In contrast, the Exponential Moving Average (EMA) gives more weight to recent prices, making it more responsive to new information. Traders often prefer EMA for short-term trading due to its sensitivity to price changes.
- How can I identify support and resistance levels?
Support levels are identified by looking for price points where buying interest has historically increased, while resistance levels are where selling pressure has risen. Traders often use historical price data, trend lines, and technical indicators to determine these levels, which are crucial for setting entry and exit points.
- What are some common chart patterns to watch for?
Common chart patterns include head and shoulders, triangles, and flags. Each pattern has its own implications for market movements. For instance, a head and shoulders pattern typically signals a trend reversal, while triangle patterns indicate consolidation that may lead to a breakout.
- Why is risk management important in trading?
Risk management is vital because it helps protect your capital and ensures long-term success in trading. By implementing strategies like setting stop-loss orders and determining appropriate position sizes, traders can minimize potential losses and safeguard their profits.
- How do I set effective stop-loss orders?
To set effective stop-loss orders, consider market analysis and your personal risk tolerance. A good rule of thumb is to place your stop-loss a certain percentage away from your entry point, allowing for normal market fluctuations while limiting potential losses.
- What is position sizing and how does it affect my trading?
Position sizing determines how much capital you allocate to each trade based on your overall trading strategy and risk management plan. Proper position sizing helps maintain a balanced approach to risk, ensuring that no single trade can significantly impact your overall capital.