Understanding the Importance of Trading Volume in Analysis
Have you ever wondered why some stocks seem to move dramatically one day and barely budge the next? Well, the answer often lies in trading volume. This article delves into trading volume's significance in financial markets, exploring how it impacts price movements, market trends, and investor behavior, ultimately enhancing trading strategies for better decision-making.
Trading volume refers to the total number of shares or contracts traded for a specific security within a given timeframe. It's like the heartbeat of the market, providing vital signs that indicate how active a stock is. Understanding its definition is crucial for analyzing market activity and liquidity. When the trading volume is high, it often means that many investors are buying and selling, which can lead to more significant price changes. Conversely, low trading volume might suggest a lack of interest or uncertainty among investors.
Trading volume serves as a key indicator of market health, revealing investor interest and potential price movements. High volume often signals strong trends, while low volume may indicate indecision or lack of interest. Think of it this way: if a concert is packed, it’s likely a popular band playing, but if the venue is empty, you might wonder if the band is any good. Similarly, in trading, high volume can confirm that a price movement is backed by strong interest, while low volume might make you question the sustainability of that movement.
The relationship between volume and price is vital for traders. Analyzing volume alongside price movements can help identify trends, reversals, and potential breakouts. For example, if a stock's price rises significantly on high volume, it may indicate a strong bullish trend. On the other hand, if the price rises but the volume is low, it could be a sign of weakness. This interplay is essential for traders aiming to make informed decisions. The Volume-Price Trend is a concept that traders often use to gauge the strength of a trend based on both volume and price changes.
Volume spikes can indicate significant market events or shifts in sentiment. For instance, if a company announces a major partnership and trading volume spikes, it could suggest that investors are optimistic about the future. Understanding these spikes helps traders anticipate potential price movements and make informed trading decisions based on market dynamics. It's like seeing a sudden crowd gather at a street performer; it signals something interesting is happening that you might want to check out.
Various techniques exist for analyzing trading volume, including moving averages and volume oscillators. These methods provide insights into market strength and help traders refine their strategies for optimal results. For example, a Moving Average Volume can help smooth out volume fluctuations, making it easier to spot trends over time. Additionally, volume oscillators can indicate whether volume is increasing or decreasing, providing further context to price movements.
In technical analysis, volume plays a crucial role in confirming price trends and signals. Traders often use volume to validate chart patterns and indicators, enhancing their predictive accuracy. For instance, if a stock breaks above a resistance level with high volume, it’s often seen as a strong buy signal. Conversely, if a breakout occurs on low volume, it may be considered less reliable. This relationship between volume and technical indicators is essential for traders looking to optimize their strategies.
Several factors can influence trading volume, including market news, economic data releases, and geopolitical events. Understanding these influences helps traders anticipate volume changes and adjust their strategies accordingly. For example, a major economic report can lead to increased trading activity as investors react to the news. Similarly, geopolitical tensions might cause a spike in volume as traders seek to adjust their positions in response to uncertainty.
Market sentiment significantly impacts trading volume. Positive or negative news can lead to increased buying or selling activity, highlighting the importance of monitoring sentiment in volume analysis. If investors are feeling optimistic, you might see a surge in buying activity, which can drive prices up. Conversely, negative news can trigger panic selling, leading to increased volume as traders rush to exit their positions. Understanding this sentiment can be crucial for making timely trading decisions.
Volume directly affects market liquidity, determining how easily assets can be bought or sold without impacting prices. High volume typically indicates greater liquidity, benefiting traders seeking efficient execution. Imagine trying to sell a rare collectible; if there are only a few buyers, it might take a while to find someone willing to pay your price. However, if there’s a crowd of eager buyers, you can sell quickly and at a better price. The same principle applies to stocks and other assets in the financial markets.
- What does high trading volume indicate? High trading volume often indicates strong investor interest and can signal the strength of a price movement.
- How can I use volume in my trading strategy? Traders can use volume to confirm trends, identify potential reversals, and enhance the accuracy of technical analysis.
- What are volume spikes, and why are they important? Volume spikes can indicate significant market events or shifts in sentiment, serving as key indicators for traders.
- Does low trading volume mean a stock is a bad investment? Not necessarily; low volume can indicate a lack of interest but doesn't inherently mean the stock is a poor investment.

What is Trading Volume?
Trading volume is a term that refers to the total number of shares or contracts traded for a specific security within a given timeframe. It acts as a pulse for the market, giving traders and investors a clear indication of how actively a security is being bought and sold. Understanding trading volume is crucial because it provides insights into market activity and liquidity. Imagine trying to gauge the popularity of a concert; the number of tickets sold (or volume) would give you a clear picture of how many people are interested in attending. In the financial markets, trading volume serves a similar purpose.
Typically measured over a specific period, such as daily, weekly, or monthly, trading volume can fluctuate significantly based on various factors. For instance, during earnings season, you might notice spikes in trading volume as investors react to new information. Conversely, during periods of uncertainty or low news flow, volume may dwindle, indicating a lack of interest or indecision among investors. This is why keeping an eye on trading volume can be just as important as monitoring price movements.
To further illustrate the concept, consider the following table that outlines different trading volume scenarios:
| Scenario | Trading Volume | Market Implication |
|---|---|---|
| High Volume with Price Increase | Above Average | Strong bullish trend, indicating strong buyer interest. |
| High Volume with Price Decrease | Above Average | Strong bearish trend, signaling seller dominance. |
| Low Volume with Price Increase | Below Average | Potentially weak trend, may indicate lack of conviction. |
| Low Volume with Price Decrease | Below Average | Indecision in the market, could lead to reversal. |
In summary, trading volume is not just a number; it's a vital component of market analysis. By understanding what trading volume represents, investors can make more informed decisions, identify trends, and potentially capitalize on opportunities. So, the next time you glance at a stock chart, remember that trading volume is the unsung hero that can provide deeper insights into market dynamics.

Why Trading Volume Matters
When diving into the world of trading, one of the first concepts that should capture your attention is trading volume. But why does it matter so much? Well, think of trading volume as the heartbeat of the market. Just like a doctor checks your pulse to gauge your health, traders look at volume to assess the market's vitality. High trading volume often indicates strong interest and activity in a particular security, suggesting that something significant is happening. Conversely, low volume can be a warning sign, hinting at a lack of interest or uncertainty among investors.
To put it simply, volume is a key indicator of market sentiment. When traders see high volume, it often correlates with increasing prices, suggesting that buyers are stepping in and pushing prices higher. On the flip side, low volume might suggest that sellers are dominating, leading to price stagnation or declines. This relationship between volume and price is crucial for making informed trading decisions.
Moreover, understanding trading volume can help you identify potential market trends and reversals. For instance, when a stock is experiencing a price increase accompanied by high volume, it can be a strong signal that the trend is likely to continue. On the other hand, if a price rise occurs with low volume, it might indicate that the move lacks strength and could be short-lived. This is where the concept of volume confirmation comes into play, providing traders with the confidence to enter or exit positions based on the strength of the price movement.
Another critical aspect to consider is how trading volume can influence your trading strategies. By incorporating volume analysis into your trading plan, you can enhance your decision-making process. For example, when you notice a volume spike, it might indicate that a significant event is unfolding in the market, prompting you to analyze further before making a move. This could be anything from earnings reports to geopolitical news that affects investor sentiment.
In addition to identifying trends, trading volume can also help you gauge the overall market health. For instance, during periods of economic uncertainty, volume can serve as a barometer for investor confidence. A sudden increase in volume during such times may indicate that traders are either panicking or seizing opportunities, providing valuable insights into market psychology.
Finally, it's essential to remember that trading volume is not just a standalone metric. It works best when combined with other indicators and analysis techniques. For instance, using volume in conjunction with price charts can help you spot breakouts or reversals more effectively. By integrating volume into your analysis toolkit, you can develop a more comprehensive understanding of market dynamics.
In summary, trading volume is a vital component of market analysis. It helps traders assess market health, confirm price movements, and refine their strategies. By paying attention to volume, you can make more informed decisions, ultimately enhancing your trading success.
- What is trading volume? Trading volume refers to the total number of shares or contracts traded for a specific security within a given timeframe.
- Why is trading volume important? It serves as a key indicator of market health, revealing investor interest and potential price movements.
- How does volume relate to price movements? Analyzing volume alongside price movements can help identify trends, reversals, and potential breakouts.
- What are volume spikes? Volume spikes can indicate significant market events or shifts in sentiment that may affect price movements.
- How can I analyze trading volume? Various techniques exist, including moving averages and volume oscillators, to provide insights into market strength.

Volume and Price Relationship
Understanding the intricate relationship between trading volume and price movements is essential for any trader looking to enhance their market strategies. Think of volume as the heartbeat of the market; it tells you how alive and active the trading environment is. When you see a surge in volume, it often indicates that something significant is happening. This could be a strong trend forming or perhaps a reversal in the market. But why is this connection so vital?
When analyzing price movements, it’s crucial to consider volume because it adds context to the price action. For instance, if a stock's price increases significantly but the trading volume is low, it might be a sign of a weak trend. Traders often refer to this as a “false breakout”. Conversely, when a price increase is accompanied by high volume, it suggests that many investors are buying into the asset, signaling a strong trend that is likely to continue.
To illustrate this relationship, let’s break it down into a few key points:
- High Volume and Price Increase: When both price and volume rise together, it typically indicates a strong bullish trend. Traders can feel more confident in their positions when they see this alignment.
- High Volume and Price Decrease: If a stock's price is falling but volume is high, it may indicate panic selling, where investors are rushing to exit their positions.
- Low Volume and Price Increase: A price rise on low volume can be misleading. It may suggest that the increase is not supported by genuine investor interest, making it less sustainable.
- Low Volume and Price Decrease: A price drop on low volume might indicate a lack of selling pressure, suggesting that a reversal could be imminent.
Moreover, traders often use various technical indicators that incorporate volume to make more informed decisions. For example, the On-Balance Volume (OBV) indicator combines price and volume to show how much volume is flowing into or out of a security. This can help traders gauge the strength of a price trend.
In summary, the relationship between volume and price is not just a statistic; it’s a powerful tool that can guide traders in their decision-making processes. By analyzing volume in conjunction with price movements, traders can better anticipate market behavior and make more informed decisions, enhancing their overall trading strategies.

Volume Spikes and Their Implications
When we talk about volume spikes, we're diving into one of the most critical indicators of market activity. A volume spike occurs when the trading volume of a security suddenly increases significantly over a short period. This phenomenon can be a real game-changer for traders, as it often signals a shift in market sentiment or the onset of a new trend. Imagine standing in a crowded room where the chatter suddenly elevates; that’s what a volume spike feels like in the trading world—something important is happening, and everyone is taking notice.
Understanding the implications of these spikes is essential for any trader looking to enhance their strategy. For instance, a sharp increase in volume might indicate that a major news event has occurred, prompting traders to react quickly. This can lead to rapid price movements, either upwards or downwards, depending on the nature of the news. A classic example is earnings reports; when a company announces its quarterly results, the trading volume can surge as investors rush to buy or sell based on the news.
Moreover, volume spikes can serve as confirmation for price movements. For example, if the price of a stock is rising and you notice a corresponding spike in volume, it’s often a sign that the trend is strong and likely to continue. Conversely, if a price increase is accompanied by low volume, it may indicate a lack of conviction among traders, suggesting that the upward movement could be short-lived. Here’s a quick breakdown of how to interpret volume spikes:
| Volume Spike Scenario | Implication |
|---|---|
| Price increase + High volume | Strong bullish trend |
| Price decrease + High volume | Strong bearish trend |
| Price increase + Low volume | Possible false breakout |
| Price decrease + Low volume | Indecision among traders |
In addition to confirming trends, volume spikes can also indicate potential reversals. If a stock has been on a downward trajectory and suddenly experiences a volume spike with a price increase, it could be a sign that buyers are stepping in, potentially reversing the trend. This is why savvy traders keep a close eye on volume spikes—they can provide early warnings of significant market shifts.
However, it’s crucial to remember that volume spikes should not be analyzed in isolation. They are most effective when combined with other indicators and market analysis techniques. For instance, traders often use moving averages or relative strength indicators (RSI) alongside volume analysis to get a more comprehensive view of market dynamics. By doing so, they can make more informed decisions and fine-tune their strategies accordingly.
In conclusion, volume spikes are like the flashing lights on a busy highway—signaling that something important is happening. Whether it’s a reaction to news, a confirmation of a trend, or a potential reversal, understanding these spikes can significantly enhance a trader's ability to navigate the markets effectively.
- What causes volume spikes?
Volume spikes can be triggered by various factors, including earnings reports, significant news announcements, or changes in market sentiment. Essentially, any event that causes traders to react can lead to a spike in volume.
- How can I identify a volume spike?
A volume spike is typically identified when the trading volume exceeds the average volume over a certain period, often measured against a moving average to determine its significance.
- Are volume spikes always a good sign?
Not necessarily. While high volume can indicate strong interest, it can also lead to volatility. It’s essential to analyze the context of the spike and consider other indicators for a complete picture.

Volume Analysis Techniques
When it comes to trading, understanding volume is like having a secret weapon in your arsenal. Volume analysis techniques are essential tools that traders use to gauge market strength and make informed decisions. One of the most common methods is the **moving average of volume**, which smooths out fluctuations and helps traders identify trends over a specific period. By comparing current volume to the moving average, traders can spot anomalies that may indicate a potential breakout or reversal.
Another widely used technique is the **Volume Oscillator**, which measures the difference between two volume moving averages. This tool not only helps in identifying bullish or bearish trends but also signals when the momentum is building up or dissipating. For example, if the short-term volume average crosses above the long-term average, it could be a sign that buying interest is increasing, potentially leading to a price surge.
In addition to these, traders often employ **On-Balance Volume (OBV)**, which combines price and volume to provide a clearer picture of market sentiment. The idea is simple: if a security closes higher on higher volume, the OBV increases, suggesting that buyers are in control. Conversely, if it closes lower on high volume, the OBV decreases, indicating selling pressure. This technique can be particularly effective in confirming price movements and trends.
Moreover, volume can be analyzed in conjunction with **chart patterns**. For instance, during a breakout from a resistance level, a significant increase in volume can validate the move, suggesting that it’s likely to continue. On the other hand, if a breakout occurs on low volume, it may be a false signal, leading traders to exercise caution. Understanding these nuances can dramatically impact trading strategies and outcomes.
To summarize, here are some key volume analysis techniques:
- Moving Averages of Volume: Helps identify trends and anomalies.
- Volume Oscillator: Indicates momentum shifts.
- On-Balance Volume (OBV): Combines price and volume for sentiment analysis.
- Volume and Chart Patterns: Confirms breakouts or reversals.
By mastering these techniques, traders can enhance their ability to read the market, making them more adept at spotting opportunities and avoiding pitfalls. Remember, the more you understand volume and its implications, the better equipped you'll be to navigate the ever-changing landscape of financial markets.
1. What is the significance of trading volume in the market?
Trading volume is crucial as it reflects the level of activity and liquidity in the market. High volume often indicates strong trends, while low volume may signify indecision.
2. How can I incorporate volume analysis into my trading strategy?
You can incorporate volume analysis by using techniques like moving averages, volume oscillators, and OBV to confirm price movements and identify potential entry and exit points.
3. What does it mean if there's a spike in trading volume?
A spike in trading volume usually indicates significant market events or shifts in sentiment, which can lead to price movements. It's essential to analyze the context of the spike.
4. Can volume analysis predict market trends?
While volume analysis can provide insights into market strength and potential price movements, it should be used in conjunction with other indicators for more accurate predictions.
Volume in Technical Analysis
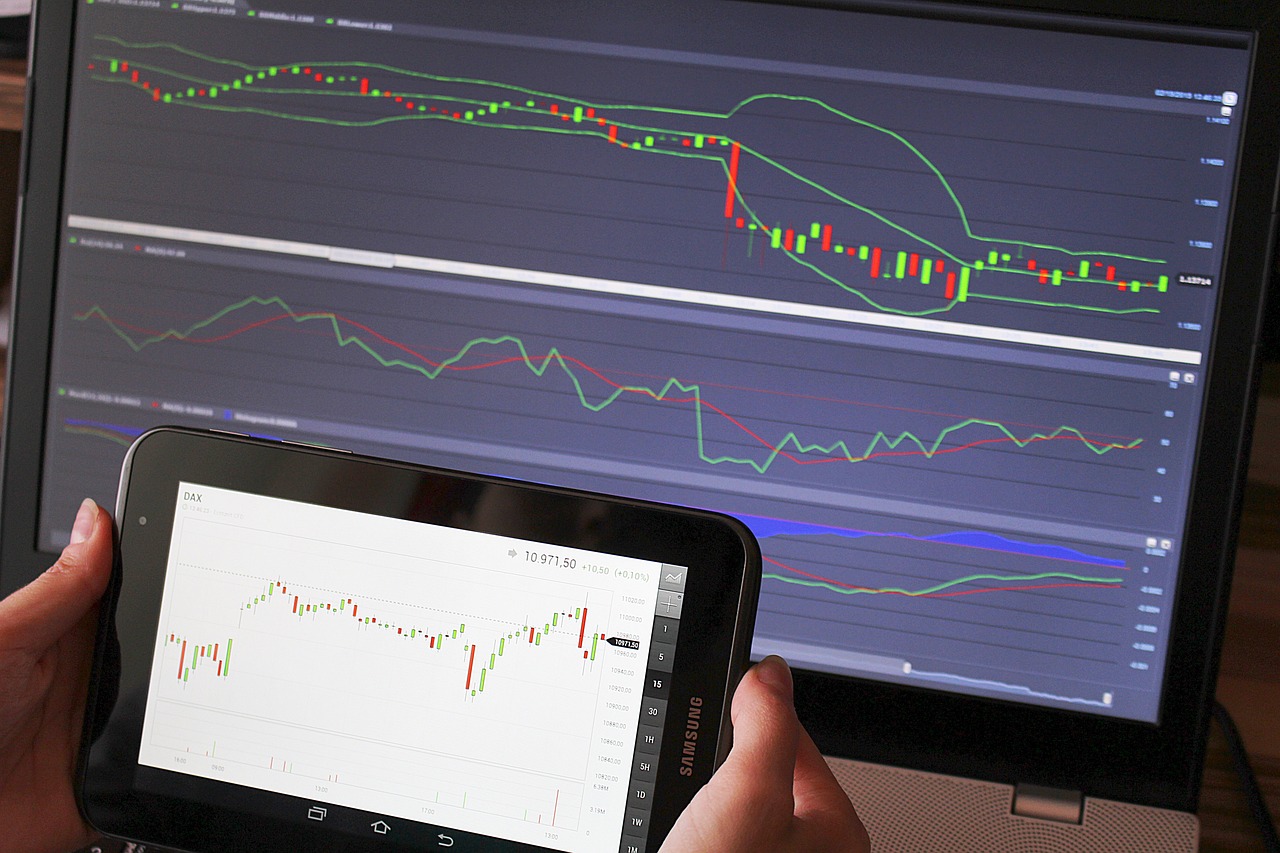
When it comes to technical analysis, trading volume is more than just a number—it's a crucial piece of the puzzle that can make or break a trader's strategy. Think of volume as the heartbeat of the market; it tells you how alive and active the trading environment is. Without it, price movements can feel like a whisper in a crowded room—hard to notice and even harder to trust.
Traders often look to volume to confirm price trends and signals. For example, if a stock is trending upwards but the volume is low, it raises a red flag. Why? Because low volume can indicate a lack of conviction among traders, suggesting that the upward trend might not be sustainable. On the flip side, if the price is climbing and volume is increasing, it’s like a green light for traders, signaling that there’s strong interest in that asset.
Here are some key ways volume plays a role in technical analysis:
- Confirmation of Trends: A rising price accompanied by increasing volume confirms the strength of the trend. Conversely, a price drop with high volume can indicate a strong bearish sentiment.
- Breakouts: When a stock breaks through a resistance level with high volume, it often signifies a strong move, suggesting that the price will continue in that direction.
- Volume Indicators: Traders use various indicators like the On-Balance Volume (OBV) and Accumulation/Distribution Line to assess the relationship between price and volume. These tools help traders gauge market momentum and potential reversals.
Moreover, volume analysis can also aid in identifying potential reversal points. If a stock has been on a downward trend but suddenly sees a spike in volume, it could indicate that buyers are stepping in, potentially signaling a reversal. This is particularly useful when combined with other technical indicators, such as moving averages or RSI (Relative Strength Index).
In summary, understanding volume in technical analysis is like having a secret weapon in your trading arsenal. It not only enhances your ability to confirm price movements but also empowers you to make more informed decisions. So, the next time you analyze a chart, don’t just focus on the price; pay attention to the volume as well. It could be the key to unlocking profitable trading opportunities!
Q: How can I use volume to improve my trading strategy?
A: By analyzing volume alongside price movements, you can confirm trends, identify potential breakouts, and spot reversals, leading to more informed decisions.
Q: What does high volume indicate?
A: High volume typically indicates strong interest in a security, suggesting that price movements are more reliable and less likely to be influenced by a few trades.
Q: Can low volume be a good sign?
A: Low volume can indicate indecision or lack of interest, which may not be ideal for trading. However, it can also signify a period of consolidation before a significant price movement.
Q: Are there specific volume indicators I should know about?
A: Yes, some popular volume indicators include On-Balance Volume (OBV), Volume Oscillator, and Accumulation/Distribution Line. These can help you analyze market strength and momentum.

Factors Influencing Trading Volume
Trading volume is not just a number; it's a reflection of the market's pulse. Several factors can influence this crucial metric, ultimately impacting your trading strategies. Understanding these factors can give you a significant edge in the financial markets. So, what exactly drives trading volume? Let's dive into some of the key influences.
First and foremost, market news plays a vital role. When significant news breaks—be it about a company's earnings, a new product launch, or even broader economic indicators—traders flock to the markets. This influx of activity can dramatically increase trading volume. For instance, if a tech giant announces a groundbreaking innovation, you can expect a surge in trading as investors react to the news. Conversely, negative news can lead to panic selling, which also spikes volume.
Another critical factor is economic data releases. Reports such as employment figures, inflation rates, and GDP growth can sway investor sentiment significantly. Traders often position themselves ahead of these announcements, anticipating how the market will react. As a result, trading volume can swell as investors look to capitalize on potential price movements. For example, during the release of unemployment data, you might see a sharp increase in volume as traders adjust their positions based on the outcome.
Moreover, geopolitical events cannot be overlooked. Political instability, elections, or international conflicts can create uncertainty, leading to increased trading volume as investors react to the changing landscape. For instance, during an election cycle, you might notice heightened activity in sectors heavily influenced by policy changes, such as healthcare or energy. This surge in volume often reflects traders' attempts to navigate the volatility that accompanies such events.
Understanding market sentiment is equally important. The emotional state of investors—whether they are optimistic or pessimistic—can lead to significant fluctuations in trading volume. When sentiment is positive, traders are more likely to buy, resulting in higher volume. On the other hand, if sentiment turns sour, selling may dominate, again increasing volume. Monitoring sentiment through social media, news outlets, and market commentary can provide valuable insights into potential volume changes.
Lastly, the time of day can also influence trading volume. Markets tend to be more active during specific hours, such as the opening and closing sessions. This is when traders are most likely to execute orders, leading to spikes in volume. For instance, the first hour after the market opens often sees the highest trading volume as investors react to overnight news and position themselves for the day.
In summary, various factors influence trading volume, from market news and economic data to geopolitical events and market sentiment. By keeping an eye on these elements, you can better anticipate volume changes and adjust your trading strategies accordingly. Remember, understanding the 'why' behind trading volume can help you make more informed decisions in the fast-paced world of trading.
- What is trading volume? Trading volume refers to the total number of shares or contracts traded for a specific security within a given timeframe.
- Why is trading volume important? Trading volume is a key indicator of market health, revealing investor interest and potential price movements.
- How can I analyze trading volume? You can use various techniques, including moving averages and volume oscillators, to gain insights into market strength.

Market Sentiment and Volume
Market sentiment is like the heartbeat of the financial markets, and it plays a pivotal role in influencing trading volume. When traders and investors feel optimistic about a particular asset, the volume tends to surge as more participants jump in to buy. Conversely, when the mood is gloomy, selling activity can spike, leading to a significant increase in volume as investors rush to exit their positions. This dynamic relationship between sentiment and volume is crucial for anyone looking to navigate the complexities of trading effectively.
To illustrate this relationship, consider the following scenarios:
- Positive Market News: When a company announces better-than-expected earnings, the sentiment shifts to positive. This can trigger a wave of buying, causing the trading volume to rise sharply as more investors want to capitalize on the good news.
- Negative Economic Indicators: If economic data reveals a downturn, market sentiment can quickly turn sour. Traders may panic and begin selling off their assets, leading to increased volume as they attempt to limit their losses.
Understanding how sentiment influences volume can provide traders with valuable insights. For instance, a sudden increase in volume accompanied by positive news could indicate a strong bullish trend. On the other hand, a spike in volume during a market downturn might signal panic selling, which could lead to further declines in price. This is why monitoring sentiment is essential; it helps traders anticipate potential changes in volume and adjust their strategies accordingly.
Moreover, sentiment can be measured through various indicators, such as the Fear and Greed Index or social media sentiment analysis. These tools can help traders gauge the prevailing mood in the market, providing a clearer picture of how sentiment might affect trading volume. By combining these insights with volume analysis, traders can develop a more robust trading strategy that accounts for both quantitative and qualitative factors.
In summary, the interplay between market sentiment and trading volume is a critical aspect of financial analysis. By paying attention to how sentiment shifts, traders can better understand market dynamics and make more informed decisions. After all, in the world of trading, knowledge is power, and understanding sentiment can be the key to unlocking profitable opportunities.
Q: How does market sentiment affect trading volume?
A: Market sentiment influences trading volume by driving the buying or selling behavior of investors. Positive sentiment typically leads to increased buying volume, while negative sentiment can result in higher selling volume.
Q: What tools can I use to gauge market sentiment?
A: You can use various tools such as the Fear and Greed Index, social media sentiment analysis, and economic news reports to gauge market sentiment effectively.
Q: Why is it important to analyze trading volume?
A: Analyzing trading volume helps traders identify trends, reversals, and potential market shifts, allowing for more informed trading decisions.
Q: Can volume analysis predict price movements?
A: Yes, volume analysis can provide insights into potential price movements. A significant increase in volume often precedes price changes, signaling potential breakouts or reversals.
Volume and Market Liquidity
When we talk about market liquidity, we're referring to how easily an asset can be bought or sold in the market without causing a significant change in its price. This is where trading volume comes into play. Think of trading volume as the lifeblood of the market; without it, assets would just sit there, stagnant and unmovable. High trading volume generally indicates a liquid market, where buyers and sellers can transact with ease. Conversely, low trading volume can lead to a lack of liquidity, making it challenging to execute trades without impacting the price.
Imagine trying to sell a rare collectible. If there are only a few interested buyers, you might have to lower your price significantly to make a sale. This scenario mirrors what happens in financial markets with low trading volume; the fewer the participants, the harder it becomes to execute trades without moving the market. On the other hand, when trading volume is robust, it's like having a bustling marketplace filled with eager buyers and sellers, creating an environment where transactions can happen smoothly and swiftly.
To put it simply, high trading volume enhances market liquidity, which is beneficial for traders. It allows for quicker entry and exit from positions, reduces the risk of slippage, and provides a clearer picture of market sentiment. Traders often look for signs of liquidity through volume metrics, as they can gauge whether the market is conducive for their trading strategies. For instance, during earnings announcements or major news releases, trading volume tends to spike, reflecting heightened interest and activity. This surge in volume often leads to greater liquidity, making it an opportune time for traders to capitalize on potential price movements.
Furthermore, understanding the relationship between volume and liquidity can help traders make informed decisions. For example, if a trader notices that a stock has low trading volume but is experiencing significant price changes, they might think twice before entering a position. The lack of liquidity could mean that their trade could significantly impact the price, leading to unfavorable outcomes. On the contrary, when a stock is seeing high volume alongside price stability, it can indicate a solid market environment, encouraging traders to engage.
In summary, the interplay between trading volume and market liquidity is crucial for anyone looking to navigate the financial markets effectively. A keen awareness of this relationship can not only enhance trading strategies but also improve overall decision-making. So, the next time you're analyzing a stock, remember to keep an eye on its trading volume; it could very well be the key to unlocking the secrets of market liquidity.
- What is the best way to measure trading volume? Trading volume can be measured using various indicators, including the volume bars on a price chart and volume moving averages.
- How does low trading volume affect my trades? Low trading volume can lead to higher slippage and difficulty executing trades at your desired price.
- Can trading volume predict price movements? Yes, analyzing volume alongside price movements can help identify trends and potential reversals in the market.
- What events typically cause spikes in trading volume? Major news announcements, earnings reports, and geopolitical events often lead to significant increases in trading volume.
Frequently Asked Questions
- What is trading volume and why is it important?
Trading volume refers to the total number of shares or contracts traded for a specific security within a certain timeframe. It's important because it acts as a key indicator of market activity and liquidity. By understanding trading volume, traders can gauge investor interest and predict potential price movements.
- How does trading volume affect price movements?
The relationship between trading volume and price is crucial for traders. High trading volume often accompanies strong price trends, while low trading volume may indicate indecision or a lack of interest. By analyzing volume alongside price changes, traders can identify trends, reversals, and potential breakouts, ultimately enhancing their trading strategies.
- What are volume spikes and what do they signify?
Volume spikes are sudden increases in trading volume that can indicate significant market events or shifts in sentiment. These spikes can serve as warning signals for traders, suggesting potential price movements and enabling them to make informed decisions based on current market dynamics.
- What techniques can be used for volume analysis?
There are several techniques for analyzing trading volume, including moving averages, volume oscillators, and accumulation/distribution indicators. These methods help traders assess market strength and refine their strategies for optimal trading results.
- How does market sentiment influence trading volume?
Market sentiment plays a significant role in trading volume. Positive news can lead to increased buying activity, while negative news might trigger selling. By monitoring market sentiment, traders can anticipate changes in volume and adjust their strategies accordingly.
- What is the connection between volume and market liquidity?
Volume directly impacts market liquidity, which refers to how easily assets can be bought or sold without affecting their prices. Generally, higher trading volume indicates greater liquidity, which benefits traders by allowing for more efficient execution of trades.


