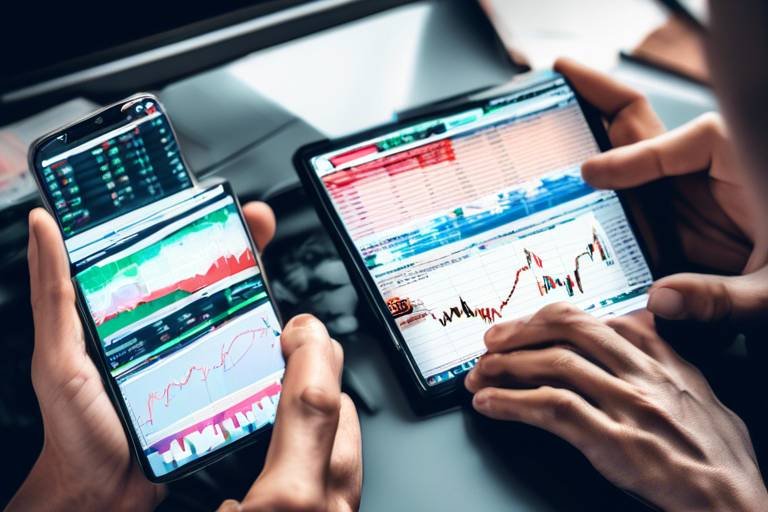
The Importance of Volume Analysis in Crypto Trading
In the fast-paced world of cryptocurrency trading, where every second counts and market dynamics can shift in the blink of an eye, understanding the nuances of volume analysis is crucial. Volume, in the context of trading, refers to the total number of units of a cryptocurrency that are traded during a specific time frame. This seemingly simple metric holds a wealth of information that can significantly influence trading decisions. By analyzing volume, traders can gain insights into market trends, gauge the strength of price movements, and even anticipate potential reversals.
Imagine you’re at a concert. If the crowd is roaring and everyone is on their feet, you know the band is putting on a great show. Similarly, in crypto trading, high trading volume can indicate strong interest and enthusiasm in a particular asset. Conversely, if the crowd is sparse and quiet, it might signal a lack of interest or uncertainty. This analogy highlights the importance of volume as a reflection of market sentiment. By paying close attention to volume, traders can make more informed decisions, avoid pitfalls, and enhance their overall trading strategies.
Moreover, volume analysis is not just about observing numbers; it's about understanding what those numbers signify. A price movement accompanied by high volume is often seen as a confirmation of that movement, suggesting that the trend is likely to continue. On the other hand, a price change occurring with low volume may raise red flags, indicating that the movement lacks conviction. This concept is vital for traders who are looking to enter or exit positions at the right time, as it provides a clearer picture of the market's direction.
Additionally, volume can play a pivotal role in identifying key market events, such as breakouts and reversals. When a cryptocurrency breaks through established support or resistance levels, volume analysis can help determine whether this breakout is genuine or merely a false signal. For instance, if a price surge is backed by substantial volume, it suggests that the breakout has strong momentum. Conversely, a breakout with low volume may indicate a lack of commitment from traders, signaling a potential reversal instead.
In summary, volume analysis is an indispensable tool for anyone serious about trading cryptocurrencies. By understanding and leveraging volume data, traders can enhance their decision-making processes, identify market trends, and ultimately improve their trading outcomes. As the crypto landscape continues to evolve, those who master the art of volume analysis will undoubtedly have a competitive edge.
- What is volume analysis in crypto trading?
Volume analysis involves examining the number of assets traded within a specific timeframe to gain insights into market trends and trader sentiment. - Why is volume important?
Volume is important because it helps confirm price movements and identify potential reversals, indicating the strength of market interest. - How can volume indicate breakouts?
A breakout accompanied by high volume suggests strong momentum, while low volume might indicate a false breakout. - Can volume analysis be combined with other indicators?
Yes, integrating volume analysis with other technical indicators can enhance trading strategies and improve decision-making.
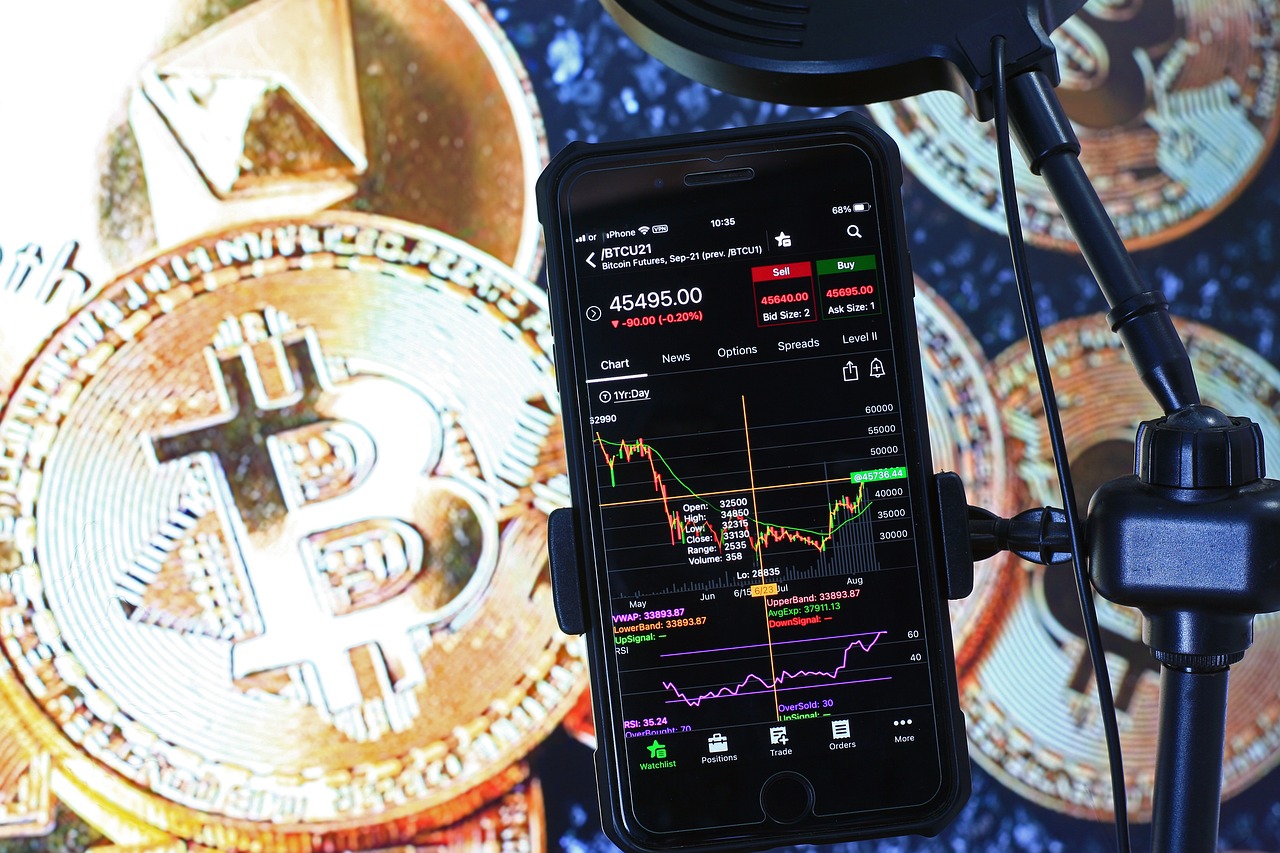
Understanding Volume in Crypto Trading
Volume is a crucial element in the world of cryptocurrency trading. It refers to the total number of assets that are traded over a specific time frame, and understanding it can be the key to unlocking market trends and trader sentiment. Think of volume as the heartbeat of the market; when it beats strongly, it indicates life and activity, while a weak heartbeat suggests stagnation or uncertainty. In simpler terms, if you're not paying attention to volume, you're missing out on a vital piece of the puzzle.
So, what exactly does volume tell us? When you're analyzing a cryptocurrency's price movements, volume acts as a confirmation tool. For instance, if the price of Bitcoin suddenly spikes, and the volume accompanying that spike is high, it suggests that there’s strong interest from traders, making the price movement more likely to be sustainable. On the flip side, if the price rises but the volume is low, it raises a red flag. It’s like a crowd cheering at a concert; the louder the cheers, the more you know the performance is captivating. Conversely, if only a few are clapping, it might be time to question the show.
To illustrate this further, consider the following table that highlights the relationship between price movements and volume:
| Price Movement | Volume Level | Market Sentiment |
|---|---|---|
| Price Increase | High | Strong Bullish Sentiment |
| Price Increase | Low | Weak Bullish Sentiment |
| Price Decrease | High | Strong Bearish Sentiment |
| Price Decrease | Low | Weak Bearish Sentiment |
As you can see, the combination of price movement and volume provides a clearer picture of market dynamics. High volume during a price increase is a strong indicator that traders are confident in the asset's upward trajectory. Conversely, a price decrease with high volume signals that sellers are actively offloading their assets, suggesting a bearish outlook.
Moreover, volume can also help in identifying potential breakouts and reversals. When the price of a cryptocurrency approaches established support or resistance levels, a surge in volume can confirm whether the price will break through these barriers or bounce back. Just like a runner preparing to sprint past the finish line, a sudden increase in volume can indicate that the market is ready to make a significant move.
In summary, understanding volume in crypto trading is not just about numbers; it’s about interpreting the story those numbers tell. By keeping an eye on volume, traders can gain insights into market trends, sentiment, and potential price movements, allowing them to make more informed decisions. So the next time you’re analyzing a cryptocurrency, remember to check its volume—it might just be the secret ingredient to your trading success.

Why Volume Matters
When diving into the world of crypto trading, one might wonder, "Why should I care about volume?" Well, let me tell you, volume is more than just a number; it’s the heartbeat of the market. It tells you how much of a particular asset is being traded over a specific timeframe, and this information can be a game changer for traders. Understanding volume is crucial for confirming price movements and gauging market sentiment. Imagine you're at a concert; if the crowd is roaring and singing along, you know the band is hitting all the right notes. Similarly, high trading volume indicates strong interest and confidence in a price movement, while low volume can leave you feeling like you're at a quiet coffee shop—something's just not right.
Volume serves as a confirmation tool in the trading arena. For instance, when you see a price increase accompanied by high volume, it’s like a green light flashing, signaling that the trend is likely to continue. On the flip side, a price rise on low volume can feel like a shaky foundation—there's a lack of conviction behind it, suggesting that the price movement might not hold. This is where volume becomes essential for traders looking to make informed decisions.
Moreover, volume analysis can help in identifying breakouts—those thrilling moments when the price moves beyond established support or resistance levels. Think of it as a race; if a runner suddenly speeds up and leaves the pack behind, you want to know if they have the stamina to keep going. High volume during a breakout indicates that the move is backed by strong interest, while low volume might suggest that the breakout could fizzle out quickly, leaving you with a false sense of hope. This insight is invaluable for managing risk and making strategic trades.
Another critical aspect of volume is its ability to spot potential reversals. Picture this: a stock’s price has been declining, and suddenly, there's a surge in volume. This spike can signal that buyers are stepping in, hinting at a possible trend change. It’s like watching a tide turn; the water may have been receding, but now it’s rushing back in, and you want to be ready to ride that wave.
To summarize, volume is not just a statistic; it’s an essential tool that informs traders about market dynamics. By understanding why volume matters, traders can better navigate the complexities of the crypto market. It’s about reading the signs and making educated decisions, ensuring that you’re not just following the crowd but leading the charge.

Volume as a Confirmation Tool
When it comes to crypto trading, volume is more than just a number; it's a powerful tool that can confirm the strength of price movements. Imagine you're at a concert, and the crowd's roar rises as the band plays its most popular song. That energy—how loud the audience is—reflects their enthusiasm and investment in the moment. Similarly, in trading, a price increase accompanied by high volume indicates strong interest from traders, suggesting that the trend is likely to continue. On the flip side, if the price is rising but the volume is low, it’s like a whisper in that concert; it may signal a lack of conviction among traders, meaning the price increase could be short-lived.
To put it simply, volume acts as a confirmation tool that helps traders validate their decisions. For instance, if you see Bitcoin surging to new heights, you might want to check the volume. If the volume is robust, that's a green light to consider this trend as legitimate. However, if the volume is tepid, it could be wise to hold off on making any big moves. This is because low volume during a price increase can suggest that the rally lacks the necessary support, making it more susceptible to a pullback.
Moreover, volume can also serve as a warning sign. If you notice a significant price drop accompanied by high volume, it's often a signal that many traders are exiting their positions, indicating fear or uncertainty in the market. This scenario can be likened to a stampede; when the crowd starts to run, it’s usually for a good reason. Understanding these dynamics can significantly enhance your trading strategy.
Here are a few key points to remember about using volume as a confirmation tool:
- High Volume with Price Increase: Indicates strong buying interest and confirms the upward trend.
- High Volume with Price Decrease: Suggests strong selling pressure, indicating a potential downtrend.
- Low Volume with Price Increase: Signals a lack of conviction, making the trend potentially weak.
- Low Volume with Price Decrease: May indicate a lack of selling pressure, suggesting the downtrend could be losing momentum.
In conclusion, volume is not just another metric to glance at; it's a vital component of a trader's toolkit. By paying attention to volume trends, traders can make more informed decisions, enhancing their chances of success in the volatile world of cryptocurrency. Just like a seasoned sailor reads the wind and waves, a savvy trader reads the volume to navigate the unpredictable seas of the market.
1. What is volume in crypto trading?
Volume refers to the total number of assets traded within a specific timeframe, indicating the level of activity and interest in that asset.
2. Why is volume important?
Volume is crucial as it helps confirm price movements. High volume often indicates strong trends, while low volume can signal uncertainty.
3. How can I use volume to make trading decisions?
Traders can use volume to validate price trends, identify breakouts, and spot potential reversals, thus making more informed trading choices.
4. What are some common volume indicators?
Common volume indicators include the Volume Weighted Average Price (VWAP) and On-Balance Volume (OBV), which help enhance trading strategies.

Identifying Breakouts
Identifying breakouts is a crucial skill for any trader looking to capitalize on significant price movements in the cryptocurrency market. A breakout occurs when the price of an asset moves beyond established support or resistance levels, often leading to substantial price changes. But how can you tell if a breakout is genuine or just a false alarm? This is where volume analysis comes into play. When a breakout is accompanied by high trading volume, it indicates that there is strong interest and conviction behind the price movement. In contrast, a breakout with low volume might suggest that the move lacks support, making it more likely to reverse.
To effectively identify breakouts, traders should follow these steps:
- Monitor Key Levels: Keep an eye on key support and resistance levels. These are the price points where the market has previously reversed its direction.
- Watch for Volume Spikes: A significant increase in volume during a breakout can signal that the move is backed by strong trader interest.
- Use Technical Indicators: Tools like the Volume Weighted Average Price (VWAP) can help confirm the strength of a breakout.
For example, imagine you're watching the price of Bitcoin, which has been trading sideways for a while. You notice that it's approaching a resistance level of $50,000. Suddenly, the price breaks through this level, and you see a surge in volume. This combination of price action and volume suggests that the breakout is likely to continue, making it an opportune moment for you to enter a trade.
On the flip side, if Bitcoin breaks through that same resistance level but the volume remains low, it could be a sign of a false breakout. In this case, you might want to wait and see if the price can hold above that level before committing your capital. This cautious approach can save you from potential losses and help you make more informed trading decisions.
In summary, identifying breakouts requires a keen understanding of volume dynamics. By combining volume analysis with price action, traders can enhance their ability to spot real opportunities in the market. Remember, in the world of crypto trading, not every price movement is created equal, and volume can be your best friend in distinguishing between a genuine breakout and a mere blip on the radar.
What is a breakout in cryptocurrency trading?
A breakout occurs when the price of a cryptocurrency moves beyond a defined support or resistance level, often indicating a potential for significant price movement.
How can volume help in identifying breakouts?
High volume during a breakout suggests strong trader interest and can confirm the likelihood of a sustained price movement, while low volume may indicate a lack of conviction.
What are some common indicators to use with volume analysis?
Common indicators include the Volume Weighted Average Price (VWAP), On-Balance Volume (OBV), and moving averages, which can provide additional context to price movements.
Can breakouts happen in both bull and bear markets?
Yes, breakouts can occur in both market conditions, but the context and implications may differ. In a bull market, breakouts often signal continuation, while in a bear market, they may indicate potential reversals.

Spotting Reversals
Spotting reversals in the cryptocurrency market can feel like hunting for treasure in a vast ocean. It requires skill, patience, and a keen eye for detail. Reversals are those moments when the market shifts direction, often catching traders off guard. Understanding how to identify these shifts is crucial for anyone looking to maximize their trading potential. One of the most telling signs of a possible reversal is a sudden spike in volume. When you see a significant increase in trading activity, it can indicate that buyers or sellers are stepping in, potentially changing the course of the market.
Imagine you’re watching a movie, and just when you think the hero is about to lose, they make a comeback. That’s how reversals work; they can surprise you! For instance, if a cryptocurrency has been on a downward trend and suddenly experiences a volume surge, it could signal that buyers are starting to take control. This might indicate that the price is about to bounce back, giving traders an opportunity to enter the market at a lower price point before it rises again.
To further understand how volume can signal reversals, let’s consider a few key points:
- Volume Spike During Decline: If you notice a sharp increase in volume while the price is falling, it might suggest that buyers are starting to accumulate the asset, which could lead to a reversal.
- Volume Decrease at Resistance Levels: When the price approaches a resistance level with declining volume, it may indicate that sellers are losing strength, hinting at a potential upward reversal.
- Volume Patterns: Look for consistent volume patterns over time. If a cryptocurrency has been trading with low volume and suddenly sees a significant increase, it can be a sign of a trend change.
Moreover, combining volume analysis with other indicators can enhance your ability to spot reversals. For example, if you see a bullish divergence in the Relative Strength Index (RSI) alongside a volume spike, it adds more weight to the argument that a reversal might be on the horizon. It’s like having multiple pieces of a puzzle; when they fit together, the picture becomes clearer.
In summary, spotting reversals is not just about watching the price; it’s about paying close attention to volume. By recognizing the signs and understanding market dynamics, traders can make more informed decisions, potentially capitalizing on market shifts before they happen. Remember, in the world of crypto trading, knowledge is power, and those who can read the signs have a better chance of navigating the turbulent waters of the market successfully.
Q1: How can I effectively use volume to identify reversals?
A1: Look for sudden spikes in volume during price declines or increases at resistance levels. Combining volume analysis with other indicators like RSI can also enhance your accuracy.
Q2: Is high volume always a good sign?
A2: Not necessarily. While high volume can indicate strong interest, it’s important to analyze the context. High volume during a price decline could signify panic selling, while high volume during a price increase may indicate strong buying pressure.
Q3: What tools can help with volume analysis?
A3: Tools like Volume Weighted Average Price (VWAP) and On-Balance Volume (OBV) can provide deeper insights into volume trends and help traders make informed decisions.
Q4: Can volume analysis be used in all markets?
A4: Yes, volume analysis is applicable across various markets, including stocks, forex, and commodities. However, the implications may vary depending on market conditions.

Volume Indicators and Tools
When it comes to navigating the tumultuous waters of cryptocurrency trading, understanding volume indicators and tools can be your lifebuoy. These indicators are not just fancy jargon; they are essential instruments that help traders make sense of the chaotic market movements. One of the most popular volume indicators is the Volume Weighted Average Price (VWAP), which provides an average price a cryptocurrency has traded at throughout the day, weighted by volume. This gives traders a clearer picture of the average price level that buyers and sellers have agreed upon, allowing them to make more informed decisions.
Another critical tool is the On-Balance Volume (OBV), which uses volume flow to predict changes in stock price. The idea behind OBV is simple yet powerful: if a security is seeing an increasing OBV, it suggests that volume is flowing into the asset, indicating bullish sentiment. Conversely, if the OBV is declining, it may signal that investors are selling off their holdings, hinting at bearish sentiment.
Additionally, traders often look at the Accumulation/Distribution Line, which combines price and volume to show how much of a cryptocurrency is being accumulated versus distributed. This tool helps identify whether a trend is strong or likely to reverse, based on the volume behind price movements. Understanding these indicators can be akin to having a compass in a dense fog; they guide you through uncertainty and help you make better trading decisions.
To illustrate the effectiveness of these tools, consider the following table that summarizes some key volume indicators:
| Indicator | Description | Use Case |
|---|---|---|
| Volume Weighted Average Price (VWAP) | Averages price based on volume, providing a benchmark. | Determining trade entry and exit points. |
| On-Balance Volume (OBV) | Uses volume flow to predict price movements. | Identifying bullish or bearish trends. |
| Accumulation/Distribution Line | Combines price and volume to gauge buying and selling pressure. | Assessing trend strength and potential reversals. |
By leveraging these volume indicators and tools, traders can enhance their strategies and gain a better understanding of market dynamics. It's essential to remember that while these indicators provide valuable insights, they should not be used in isolation. Instead, integrating them with other technical analysis tools can create a more robust trading strategy. The beauty of combining volume analysis with other indicators, such as moving averages or the Relative Strength Index (RSI), is that it allows for a comprehensive view of market conditions. Imagine trying to solve a puzzle; each indicator provides a piece that, when assembled together, reveals a clearer picture of market trends and potential trading opportunities.
- What is volume analysis in crypto trading? Volume analysis involves studying the number of assets traded over a specific period to gauge market sentiment and potential price movements.
- Why is volume important? Volume is crucial because it helps confirm price trends, identify breakouts, and spot reversals, providing traders with valuable insights.
- How do volume indicators enhance trading strategies? Volume indicators help traders validate price movements and assess the strength of trends, allowing for more informed decision-making.
- Can volume indicators be used in different market conditions? Yes, understanding how volume behaves in various market conditions can help traders adjust their strategies for better outcomes.
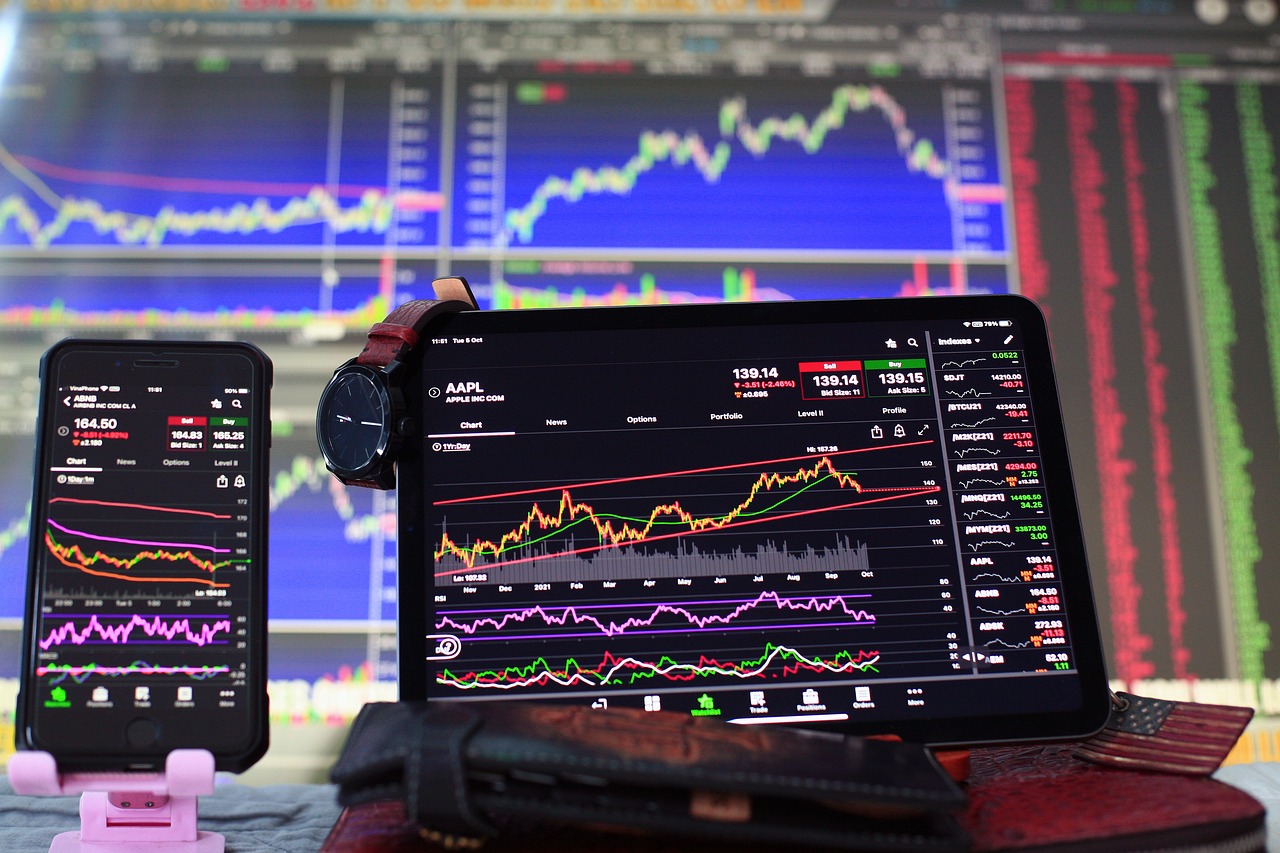
Combining Volume with Other Indicators
When it comes to crypto trading, relying solely on volume analysis can sometimes leave traders in the dark. To truly illuminate the path to better trading decisions, it's essential to combine volume analysis with other technical indicators. This integrated approach allows traders to gather a more comprehensive view of the market, enhancing their ability to make informed decisions. Imagine trying to navigate a ship through foggy waters; while volume is your compass, other indicators can serve as your map, helping you chart a course through uncertainty.
One of the most popular indicators to pair with volume is the Moving Average (MA). By smoothing out price data over a specific period, moving averages can help traders identify the overall trend direction. When a price crosses above a moving average on high volume, it may signal a strong bullish sentiment, while a drop below the moving average on high volume could indicate bearish pressure. This combination can provide traders with a clearer picture of market momentum.
Another valuable indicator to consider is the Relative Strength Index (RSI). The RSI measures the speed and change of price movements, helping traders identify overbought or oversold conditions. When the RSI indicates that a cryptocurrency is overbought, but volume is also increasing, it could suggest that the price is likely to continue rising, despite being overextended. Conversely, if the RSI shows oversold conditions while volume decreases, it may imply that the downward trend is losing steam, presenting a potential buying opportunity.
To illustrate how these combinations can enhance trading strategies, consider the following table:
| Indicator | Signal | Volume Implication |
|---|---|---|
| Moving Average | Price crosses above MA | High volume confirms bullish trend |
| RSI | Overbought condition | High volume suggests continuation of price rise |
| MACD (Moving Average Convergence Divergence) | MACD line crosses above signal line | High volume validates upward momentum |
Moreover, integrating volume with chart patterns can also yield fruitful results. For instance, if a trader identifies a head and shoulders pattern forming, observing the accompanying volume can provide critical insights. A breakout from this pattern on high volume is generally viewed as a strong signal, while a breakout on low volume might raise red flags, suggesting that the move could be a false alarm. Thus, volume acts as a crucial filter, helping traders sift through the noise and focus on legitimate price movements.
In summary, combining volume analysis with other indicators like moving averages, RSI, and chart patterns can significantly enhance a trader's ability to make informed decisions. This multifaceted approach not only provides a clearer understanding of market dynamics but also helps mitigate risks associated with trading. By leveraging these tools together, traders can navigate the often-turbulent waters of cryptocurrency trading with greater confidence and precision.
- What is volume analysis in crypto trading? Volume analysis refers to the study of the number of assets traded over a specific period, providing insights into market trends and trader sentiment.
- Why should I combine volume with other indicators? Combining volume with other indicators helps create a more comprehensive trading strategy, allowing for better decision-making and risk management.
- What are some common indicators to combine with volume? Common indicators include Moving Averages, Relative Strength Index (RSI), and MACD, among others.
- How can I identify breakouts using volume? A breakout accompanied by high volume typically indicates a strong move, whereas low volume may suggest a weak or false breakout.

Volume and Price Action
When it comes to trading cryptocurrencies, understanding volume in conjunction with price action is like having a secret decoder ring for the market. Imagine you're watching a movie; the plot thickens when the volume picks up, right? Similarly, in trading, a surge in volume can indicate pivotal moments in price movement. When you analyze price action alongside volume, you gain a clearer picture of market sentiment and potential future movements.
For instance, if the price of Bitcoin suddenly spikes, but the accompanying volume is low, it might raise a red flag. This scenario could suggest that the price increase lacks strong backing from traders, indicating a potential reversal or a false breakout. On the flip side, when you see a price increase coupled with high volume, it’s often a strong confirmation that the trend is robust and likely to continue. It’s essential to recognize these patterns to avoid being caught in a market trap.
To put it simply, volume acts as a confirmatory signal for price action. Here’s a quick breakdown of how you can interpret volume in relation to price movements:
- High Volume with Price Increase: This typically indicates strong buying interest and a solid upward trend.
- High Volume with Price Decrease: This suggests strong selling pressure, potentially signaling a downtrend.
- Low Volume with Price Increase: This can be a warning sign that the price movement may not be sustainable.
- Low Volume with Price Decrease: This might indicate a lack of selling interest, suggesting that the downtrend could reverse.
Moreover, the relationship between volume and price action can be particularly insightful during critical market events, such as news releases or regulatory announcements. Traders often prepare for these events by analyzing historical volume patterns to predict how the market might react. For example, if a significant announcement is expected, a trader might look for previous instances where volume spiked before or after similar news, using that data to inform their trading strategy.
In essence, volume and price action are interlinked in a dance that can reveal the underlying strength or weakness of a market trend. As traders, it’s crucial to keep an eye on how these two factors interact, as they can guide you toward making more informed decisions. Remember, trading is not just about numbers; it’s about understanding the story behind those numbers and using that insight to your advantage.
- What is volume in cryptocurrency trading? Volume refers to the total number of assets traded within a specific timeframe, indicating market activity and trader interest.
- Why should I consider volume when trading? Volume can confirm price movements, identify trends, and signal potential reversals, helping traders make more informed decisions.
- How can I analyze volume effectively? Use volume indicators such as the Volume Weighted Average Price (VWAP) and On-Balance Volume (OBV) alongside price action to gain deeper insights.
- Can volume analysis predict market trends? While not foolproof, analyzing volume can provide clues about market sentiment and potential price movements, aiding in trend prediction.
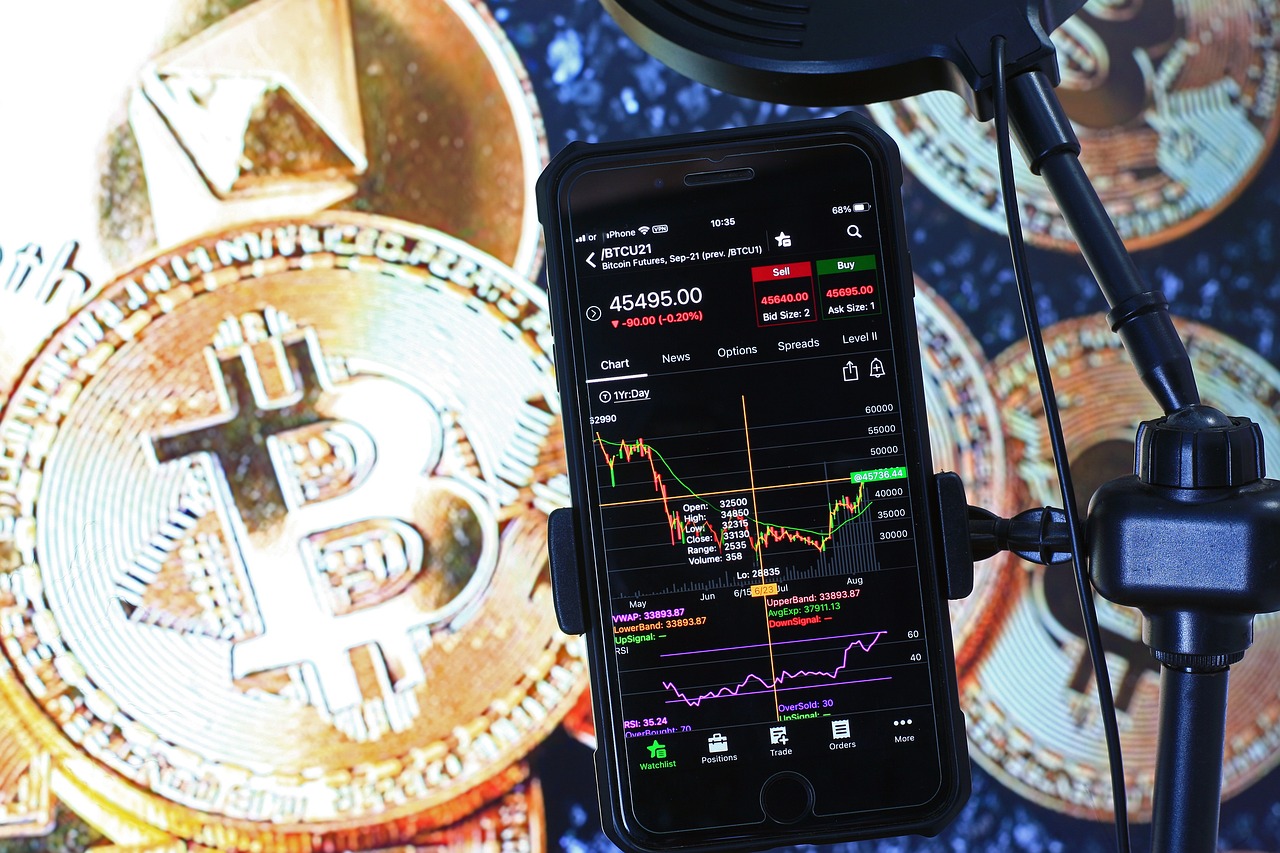
Volume in Different Market Conditions
Understanding how volume behaves in different market conditions is crucial for traders looking to optimize their strategies. In a bull market, where prices are generally rising, volume tends to increase alongside price movements. This surge in volume is often interpreted as a sign of strong investor confidence and buying interest. When traders observe a consistent rise in volume during upward price trends, it reinforces the notion that the bullish sentiment is likely to continue. However, traders must remain vigilant, as a sudden drop in volume during a price increase could signal a potential reversal or weakening trend.
Conversely, in a bear market, where prices are declining, volume can tell a different story. Typically, volume may spike as prices drop, indicating panic selling or a rush to liquidate assets. This high volume during a downturn can suggest that traders are eager to exit positions, often leading to further price declines. However, if a price drop occurs with low volume, it might indicate a lack of strong selling pressure, suggesting that the market could be nearing a bottom or potential reversal point.
To illustrate this concept, consider the following table that summarizes volume behavior in various market conditions:
| Market Condition | Volume Behavior | Implication for Traders |
|---|---|---|
| Bull Market | Increasing volume with rising prices | Strong buying interest; trend likely to continue |
| Bull Market with Low Volume | Price rises but volume decreases | Potential weakening trend; caution advised |
| Bear Market | High volume during price declines | Panic selling; further declines possible |
| Bear Market with Low Volume | Price drops with decreasing volume | Possible market bottom; reversal may occur |
Moreover, traders should also consider the impact of news events on volume. Major announcements, regulatory changes, or technological advancements can lead to significant volume spikes regardless of the overall market trend. For instance, if a cryptocurrency project announces a groundbreaking partnership, it could trigger a surge in buying activity, resulting in increased volume even in a bearish market. Therefore, keeping an eye on both market conditions and external news can provide a more comprehensive view of volume dynamics.
Ultimately, the key takeaway is that monitoring volume in relation to market conditions can empower traders to make more informed decisions. By analyzing volume patterns, traders can better gauge market sentiment and adjust their strategies accordingly, whether they are looking to capitalize on bullish trends or navigate through bearish waters.
Frequently Asked Questions
- What is volume analysis in crypto trading?
Volume analysis in crypto trading refers to the examination of the number of assets traded over a specific period. It helps traders understand market trends, gauge trader sentiment, and make informed decisions based on the activity level of buyers and sellers.
- Why is volume important in trading?
Volume is crucial because it confirms price movements. A price increase accompanied by high volume indicates strong interest and conviction, while a rise on low volume may suggest uncertainty. Essentially, it helps traders identify whether a trend is robust or likely to reverse.
- How can I use volume to identify breakouts?
To identify breakouts, look for significant price movements beyond established support or resistance levels that are accompanied by high trading volume. This combination suggests that the breakout is genuine and not just a temporary fluctuation, which is vital for effective risk management.
- Can volume indicate market reversals?
Absolutely! A sudden spike in volume during a price decline can signal that buyers are stepping in, potentially indicating a trend change. This insight allows traders to adjust their strategies and capitalize on new opportunities.
- What are some common volume indicators?
Common volume indicators include the Volume Weighted Average Price (VWAP) and On-Balance Volume (OBV). These tools enhance trading strategies by providing deeper insights into price action and confirming trends based on volume data.
- How should I combine volume with other indicators?
Integrate volume analysis with other technical indicators like moving averages or the Relative Strength Index (RSI) to enhance your trading strategies. This combination allows for a more comprehensive understanding of market conditions, leading to better decision-making.
- Does volume behave differently in bull and bear markets?
Yes, volume can behave differently in various market conditions. In bull markets, you may notice increasing volume as prices rise, reflecting strong buyer interest. Conversely, in bear markets, volume may decrease during price declines, indicating a lack of selling pressure. Understanding these patterns can help traders adjust their strategies accordingly.


