The Role of Chart Patterns in Identifying Entry and Exit Points
In the fast-paced world of trading, where every second counts and decisions can lead to significant gains or losses, having a reliable strategy is essential. One of the most powerful tools at a trader's disposal is the ability to recognize and interpret chart patterns. These visual formations, created by price movements on charts, serve as a roadmap, guiding traders toward optimal entry and exit points. Imagine navigating through a dense forest; chart patterns act like signposts, indicating the best paths to take and warning of potential pitfalls.
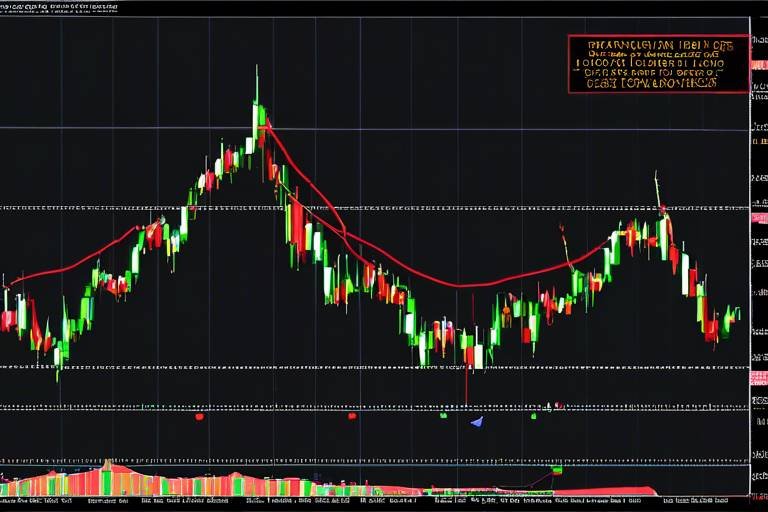
Chart patterns are not just random squiggles on a graph; they are the result of collective market psychology. When traders buy and sell, they create patterns that reflect their emotions, fears, and expectations. By understanding these patterns, traders can gain insights into market trends and potential reversals. For instance, a head and shoulders formation might suggest that the market is about to change direction, while a triangle pattern could indicate a period of consolidation before a breakout. Recognizing these signals can be the difference between a profitable trade and a missed opportunity.
Moreover, the significance of chart patterns extends beyond mere identification. They provide critical context for making informed trading decisions. For example, if a trader spots a bullish pattern like the inverse head and shoulders, it might be an opportune moment to enter a long position. Conversely, recognizing a bearish pattern can signal the need to exit a position or even short the market. This ability to read the market's "language" through chart patterns empowers traders, allowing them to act with confidence and precision.
In this article, we will delve deeper into the fascinating world of chart patterns. We will explore the most common formations, how to identify them, and the strategies that can be employed for making sound trading decisions. Whether you're a seasoned trader or just starting, understanding the role of chart patterns in identifying entry and exit points is crucial for navigating the complex financial landscape.
Chart patterns are formations created by the price movements of assets on a chart. These patterns emerge over time as traders react to market conditions, economic news, and other factors influencing supply and demand. Each pattern has its own characteristics and implications, making them essential for traders seeking to enhance their strategies. By learning to recognize these patterns, traders can better anticipate market movements and make more informed decisions.
There are several widely recognized chart patterns that traders often rely on. Some of the most prevalent include:
- Head and Shoulders: A reversal pattern indicating a potential change in trend direction.
- Triangles: Patterns that signify consolidation and potential breakout points.
- Flags: Short-term continuation patterns that suggest a brief pause before the previous trend resumes.
Understanding these patterns and their implications can significantly enhance a trader's ability to navigate the markets effectively.
Chart patterns provide critical insights into optimal entry points. By analyzing these formations, traders can identify when to enter a position with greater confidence. For instance, if a trader recognizes a bullish flag pattern, it might signal a good time to buy as the price is likely to continue rising after a brief consolidation. Conversely, a bearish head and shoulders pattern may indicate a forthcoming drop, prompting a trader to exit or short the market.
Confirmation signals, such as volume spikes or breakouts, can validate chart patterns. For example, a breakout from a triangle pattern accompanied by increased volume can signal a strong move in the direction of the breakout. Recognizing these signals is vital for better entry timing and reducing the risk of false signals.
Properly setting stop losses based on chart patterns can protect against significant losses. For instance, placing a stop loss just below the neckline of a head and shoulders pattern can help mitigate risk if the trade does not go as planned. Understanding where to place these stop losses is crucial for maintaining a healthy trading strategy.
- What are chart patterns? Chart patterns are formations created by price movements on a chart, indicating potential market trends and reversals.
- How can I identify chart patterns? By analyzing price movements and looking for specific formations like head and shoulders, triangles, or flags.
- Why are chart patterns important in trading? They provide visual cues for optimal entry and exit points, helping traders make informed decisions.

Understanding Chart Patterns
Chart patterns are more than just random squiggles on a price chart; they are visual representations of market psychology and trader behavior. When you look at a chart, you’re not just seeing numbers or lines; you’re witnessing the collective emotions and decisions of countless traders. These patterns emerge from the price movements of assets over time, forming shapes that can indicate potential future movements. Understanding these patterns is crucial for any trader aiming to enhance their strategies and make informed decisions.
At their core, chart patterns are formed by the interplay of supply and demand. When buyers outnumber sellers, prices tend to rise, creating upward trends. Conversely, when sellers dominate, prices fall, leading to downward trends. By analyzing these patterns, traders can gain insights into whether the market is likely to continue its current direction or reverse. This ability to predict price movements based on historical price action is what makes chart patterns a powerful tool in trading.
Moreover, chart patterns can be categorized into two main types: continuation patterns and reversal patterns. Continuation patterns suggest that the current trend will continue, while reversal patterns indicate a potential change in direction. Understanding the distinction between these two types is essential for traders looking to identify optimal entry and exit points.
For example, a flag pattern is a continuation pattern that typically forms after a strong price movement. It looks like a small rectangle or flag that slopes against the prevailing trend. On the other hand, a head and shoulders pattern is a reversal pattern that signals a shift from bullish to bearish sentiment. Recognizing these patterns can provide traders with valuable insights into potential market movements.
In addition to recognizing the patterns themselves, it’s essential to understand the context in which they appear. For instance, a triangle pattern forming during a strong uptrend might indicate a temporary consolidation before a breakout, while the same pattern in a downtrend could signal a continuation of bearish momentum. This context allows traders to make more informed decisions and increases the likelihood of successful trades.
To further enhance your understanding, let’s look at a simple table that summarizes the key characteristics of common chart patterns:
| Pattern | Type | Indicates |
|---|---|---|
| Head and Shoulders | Reversal | Bearish trend reversal |
| Inverse Head and Shoulders | Reversal | Bullish trend reversal |
| Flags | Continuation | Continuation of the current trend |
| Triangles | Continuation | Consolidation and potential breakout |
In conclusion, understanding chart patterns is a vital skill for traders. They not only provide insights into market sentiment but also equip traders with the tools necessary to make strategic decisions. By mastering these patterns, traders can improve their chances of identifying optimal entry and exit points, ultimately enhancing their trading success.

Common Chart Patterns
When it comes to trading, understanding chart patterns is like having a treasure map in a vast ocean of financial data. These patterns are visual representations of price movements and can provide traders with invaluable insights into potential market behavior. By recognizing these formations, traders can make more informed decisions about when to enter or exit a trade. Let's explore some of the most widely recognized chart patterns that can significantly influence trading strategies.
One of the most prominent patterns is the head and shoulders formation. This pattern is often seen as a reversal indicator, suggesting that a prevailing trend might be coming to an end. Picture this: the price rises to a peak (the head), followed by two smaller peaks (the shoulders). When this pattern forms, it signals that the market may be ready to shift direction. Understanding this pattern can be a game-changer for traders looking to capitalize on potential reversals.
On the flip side, we have the inverse head and shoulders pattern, which is essentially a bullish version of the traditional head and shoulders. Instead of peaks, this pattern features troughs, indicating a potential upward reversal. This can be a powerful signal for traders seeking entry points, especially after a downtrend. Recognizing this pattern can help traders position themselves effectively for potential gains.
Next, let's dive into triangle patterns, which come in three main varieties: ascending, descending, and symmetrical. These formations indicate periods of consolidation, where the price is essentially 'building up' before making a significant move. An ascending triangle is characterized by a flat upper trendline and a rising lower trendline, suggesting bullish sentiment. Conversely, a descending triangle has a flat lower trendline and a declining upper trendline, indicating bearish sentiment. Symmetrical triangles, on the other hand, can break in either direction and often require additional confirmation before trading.
| Chart Pattern | Description | Signal |
|---|---|---|
| Head and Shoulders | Reversal pattern indicating a potential trend change. | Bearish reversal |
| Inverse Head and Shoulders | Reversal pattern suggesting bullish potential. | Bullish reversal |
| Ascending Triangle | Consolidation pattern indicating potential upward breakout. | Bullish |
| Descending Triangle | Consolidation pattern indicating potential downward breakout. | Bearish |
| Symmetrical Triangle | Consolidation pattern that can break in either direction. | Neutral until breakout confirmation |
Understanding these common chart patterns is crucial for any trader looking to enhance their strategy. They serve as visual cues that can indicate market trends and potential reversals. By developing the ability to recognize these patterns, traders can improve their timing and increase their chances of making profitable trades. Remember, though, that while these patterns provide valuable insights, they should always be used in conjunction with other technical analysis tools for the best results.

Head and Shoulders
The head and shoulders pattern is one of the most recognized and reliable chart patterns in technical analysis. It serves as a powerful reversal indicator, signaling that a trend may be about to change direction. Imagine you're driving down a road, and suddenly you see a sign indicating a sharp turn ahead; that's what this pattern does for traders—it warns them of potential shifts in market momentum.
This pattern consists of three peaks: the left shoulder, the head, and the right shoulder. The left shoulder forms when the price rises to a peak and then declines. Next, the price rises again to form the head, which is the highest peak. Finally, the right shoulder forms when the price rises again but does not reach the height of the head before declining once more. The overall shape resembles a person’s head and shoulders, hence the name.
Understanding the implications of this pattern is crucial for traders. When the price breaks below the neckline—a line drawn across the lows of the two troughs between the shoulders—it confirms the pattern and indicates a potential downtrend. This is akin to a light switch turning off; once the price dips below that neckline, it’s a clear signal that the bullish trend is likely over, and a bearish phase may commence.
To better illustrate this, let's break down the components of the head and shoulders pattern:
| Component | Description |
|---|---|
| Left Shoulder | The first peak, followed by a decline, indicating initial bullish sentiment. |
| Head | The highest peak, representing the strongest bullish momentum before the market starts to reverse. |
| Right Shoulder | The final peak, which is lower than the head, indicating weakening bullish momentum. |
| Neckline | A line connecting the troughs of the left and right shoulders, a critical level for confirming the pattern. |
Traders often look for specific confirmation signals when identifying this pattern. Volume is a key factor; typically, volume should increase as the price rises to form the head, and then decrease as it forms the right shoulder. This decline in volume suggests that the buying pressure is weakening, which is a red flag for traders. If you see a significant spike in volume when the price breaks below the neckline, that's a strong confirmation that the downtrend is likely to follow.
In summary, the head and shoulders pattern is an essential tool for traders seeking to identify potential market reversals. By understanding its formation and implications, traders can make more informed decisions, positioning themselves for success in the ever-changing landscape of financial markets.
Inverse Head and Shoulders
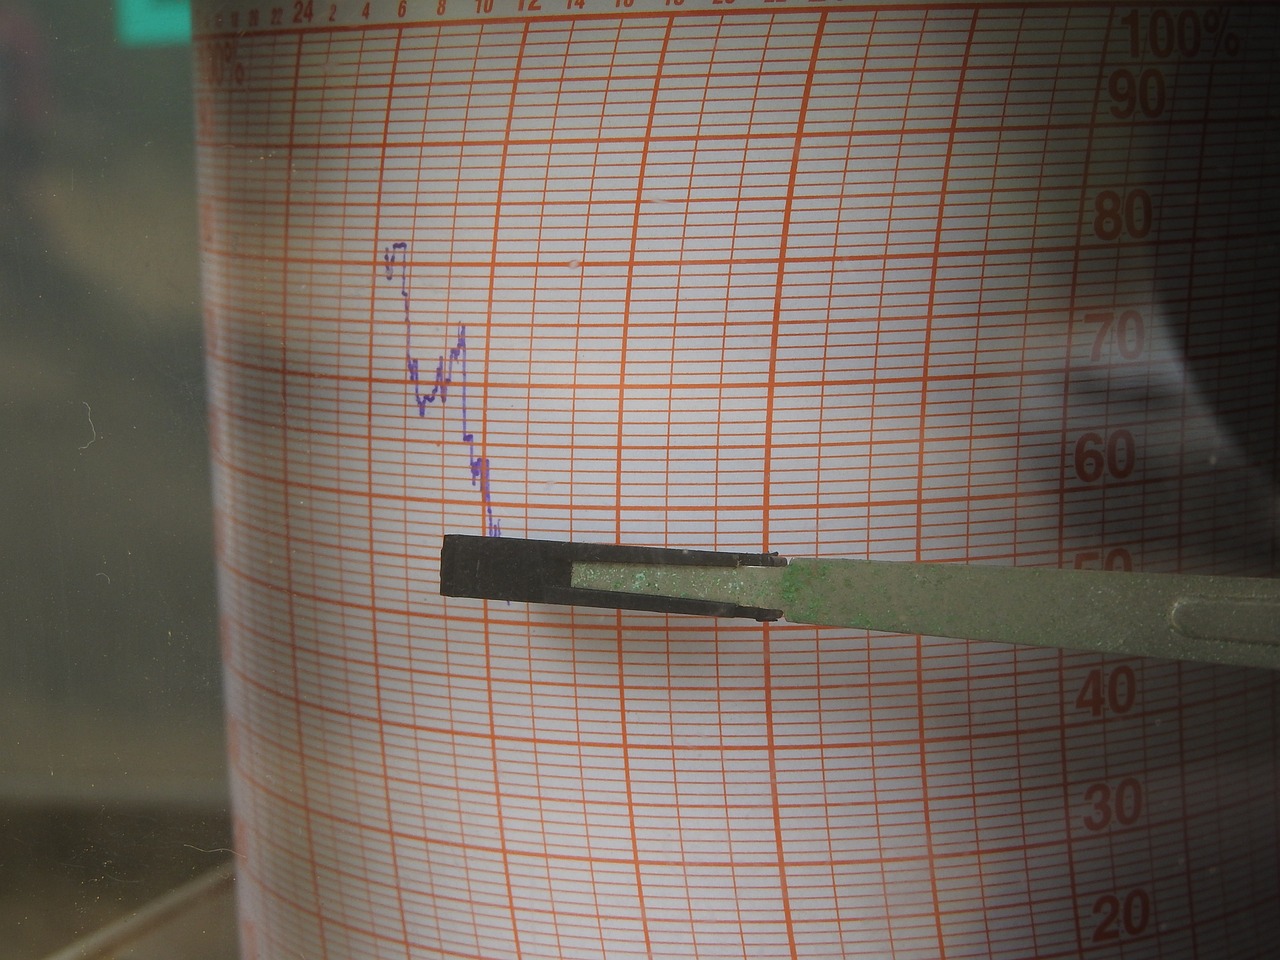
The pattern is a powerful indicator in the trading world, often signaling a bullish reversal in price trends. Imagine a mountain range where the left shoulder and right shoulder are the foothills, and the head is the towering peak in the middle. This pattern forms when the price of an asset experiences a decline, followed by a lower low (the head), and then rises again, creating two higher lows (the shoulders). It's like a phoenix rising from the ashes, suggesting that the market is gearing up for a significant upward movement.
Traders often look for this pattern as it provides a clear visual cue that a change in trend direction may be imminent. The formation typically occurs after a downtrend, indicating that the bears are losing control and the bulls are preparing to take over. To identify this pattern effectively, one must pay close attention to the volume associated with the price movements. A volume increase during the breakout phase can serve as a confirmation signal, reinforcing the validity of the pattern.
Once the inverse head and shoulders pattern is established, the next step is to determine the potential entry point. This is generally done at the breakout of the neckline, which is the horizontal line drawn across the peaks of the two shoulders. Traders often place their buy orders just above this neckline, anticipating that the price will continue to rise. However, it's crucial to set a stop loss just below the lowest point of the head to manage risk effectively. This strategy ensures that if the market moves against the trader's position, losses are minimized.
Additionally, understanding the target price after the breakout is essential for maximizing profits. A common method is to measure the distance from the head to the neckline and then project that distance upward from the breakout point. This gives traders a realistic target to aim for, allowing them to plan their exit strategies accordingly. The following table summarizes the key components of the inverse head and shoulders pattern:
| Component | Description |
|---|---|
| Left Shoulder | First upward movement followed by a decline. |
| Head | Lowest point followed by a rise, creating a peak. |
| Right Shoulder | Second upward movement, forming a peak lower than the head. |
| Neckline | Horizontal line connecting the tops of the shoulders. |
In conclusion, the inverse head and shoulders pattern is a vital tool in a trader's arsenal, providing essential insights into potential market reversals. By recognizing this formation and understanding its implications, traders can position themselves strategically to capitalize on upcoming price movements. Remember, as with any trading strategy, it’s important to combine chart patterns with other technical indicators and market analysis for a comprehensive approach.
Q: How reliable is the inverse head and shoulders pattern?
A: While no pattern is foolproof, the inverse head and shoulders is considered a strong bullish reversal signal, especially when confirmed by volume and other indicators.
Q: Can this pattern occur in any financial market?
A: Yes, the inverse head and shoulders pattern can be observed in various markets, including stocks, forex, and commodities.
Q: What should I do if the price doesn't break the neckline?
A: If the price fails to break the neckline, it may indicate a continuation of the downtrend. In this case, it's wise to reassess your position and consider exiting if you have entered a trade prematurely.

Identifying Key Levels
When it comes to trading, understanding key levels within the head and shoulders pattern can be a game changer. These levels, often referred to as support and resistance, act as psychological barriers in the market. Imagine a rubber band: when you stretch it too far, it snaps back. Similarly, prices tend to bounce off these levels, making them crucial for traders looking to optimize their entry and exit points.
To effectively identify these key levels, traders should focus on several core components of the head and shoulders pattern. The left shoulder, head, and right shoulder each create peaks and troughs that can be mapped out on a price chart. The peak of the head represents the highest price point, while the troughs between the shoulders indicate levels of support. By drawing horizontal lines across these points, traders can visualize where the market might react.
Moreover, the neckline is another pivotal aspect of this pattern. This line connects the lows of the two shoulders and serves as a significant level of support. Breaking below this neckline often signals a confirmed trend reversal, making it a critical point for traders to watch. A trader might set their stop loss just above the neckline to minimize potential losses if the market moves against them.
Additionally, it’s essential to consider the volume accompanying these movements. High trading volume during the formation of the head and shoulders pattern can indicate stronger conviction behind the price action. For instance, if the price approaches the neckline with increased volume, it could suggest a higher likelihood of a breakout. Therefore, combining volume analysis with the identification of key levels can significantly enhance a trader's decision-making process.
In summary, identifying key levels within the head and shoulders pattern is not just about drawing lines on a chart; it’s about understanding the market's psychology. Traders who can pinpoint these levels and interpret the accompanying volume trends are better equipped to make informed decisions. This analytical approach can lead to more successful trades and ultimately, a more profitable trading strategy.
- What is a head and shoulders pattern?
A head and shoulders pattern is a technical indicator that signals a reversal in trend direction, typically indicating a shift from bullish to bearish. - How do I identify the neckline?
The neckline is identified by connecting the lows of the two shoulders in the pattern. It acts as a support level and is crucial for confirming the pattern's validity. - Why is volume important in analyzing chart patterns?
Volume provides insight into the strength of a price movement. High volume during the formation of a pattern suggests strong conviction and increases the likelihood of a successful breakout. - Can I trade solely based on chart patterns?
While chart patterns are valuable tools, it's essential to combine them with other analysis methods, such as fundamental analysis and risk management strategies, for the best results.

Triangles
Triangles are fascinating chart patterns that traders often encounter in their analysis of financial markets. They represent periods of consolidation, where the price of an asset is squeezed between converging trendlines. This can create a sense of tension in the market, much like a coiled spring waiting to release energy. Understanding the different types of triangle patterns—ascending, descending, and symmetrical—can provide traders with valuable insights into potential breakout points.
Each type of triangle has its own unique characteristics and implications for trading strategies. For instance:
- Ascending Triangles: These patterns are formed when the price creates a series of higher lows while facing resistance at a horizontal level. This indicates that buyers are becoming increasingly aggressive, and a breakout above the resistance line can signal a strong bullish move.
- Descending Triangles: In contrast, descending triangles show a series of lower highs while the price finds support at a horizontal level. This pattern suggests that sellers are gaining control, and a breakdown below the support line can lead to significant bearish momentum.
- Symmetrical Triangles: These patterns feature converging trendlines that reflect a balance between buyers and sellers. The breakout direction can be either bullish or bearish, making this pattern a bit more unpredictable. Traders often wait for a breakout confirmation before making a move.
The beauty of triangle patterns lies in their ability to provide traders with clear entry and exit signals. When the price breaks out of the triangle, it often leads to a significant price movement. However, it’s essential to consider the volume of trades during the breakout. A breakout accompanied by a surge in volume is typically more reliable, indicating strong market participation and momentum.
To maximize the effectiveness of trading triangles, traders should also keep an eye on overall market conditions and relevant news that might influence price movements. For example, if a trader identifies a bullish ascending triangle but hears news of unfavorable economic data, they might reconsider their entry point. The interplay between chart patterns and external factors is crucial in making well-informed trading decisions.
Additionally, setting appropriate stop losses is vital when trading triangles. A common strategy is to place a stop loss just outside the triangle’s boundaries—either below the support line in a bullish breakout or above the resistance line in a bearish breakout. This approach helps protect against unexpected price reversals and minimizes potential losses.
In summary, triangles are powerful chart patterns that can signal upcoming price movements. By understanding their formation and characteristics, traders can enhance their strategies and improve their chances of success in the financial markets. Remember, patience and careful analysis are key when navigating these patterns, as the market often tests your resolve before making significant moves.

Using Chart Patterns for Entry Points
Chart patterns are not just pretty shapes on a screen; they are powerful tools that can significantly enhance your trading strategy. When it comes to identifying optimal entry points, these patterns act like a roadmap, guiding traders through the often chaotic landscape of financial markets. Imagine you're on a treasure hunt, and every chart pattern you identify is a clue leading you closer to the gold. But how do you leverage these clues effectively? Let’s dive into the strategies that can help you make informed decisions based on chart patterns.
First and foremost, understanding the context of a chart pattern is crucial. Each pattern tells a story about the market's behavior. For instance, when you spot a bullish flag, it often indicates a brief pause in an uptrend before the price continues to rise. Recognizing these patterns allows you to position yourself ahead of potential price movements. But spotting a pattern is just the beginning; the real magic happens when you combine it with other indicators.
One of the most effective strategies for using chart patterns to identify entry points is to look for confirmation signals. These signals can include volume spikes, breakouts, or even candlestick formations that validate the pattern you’ve identified. For example, if you see a head and shoulders pattern forming and then notice a significant increase in trading volume as the price breaks below the neckline, that’s your confirmation signal! It’s like getting a green light at an intersection; it tells you that it’s safe to proceed. Without such confirmation, entering a trade based solely on a pattern can be risky.
Furthermore, setting the right stop losses is essential to protect your capital. Think of stop losses as your safety net; they catch you if the market moves against your position. When trading based on chart patterns, consider placing your stop loss just beyond a key support or resistance level. For instance, if you’re trading a triangle pattern, you might set your stop loss just outside the triangle’s boundaries. This way, you give your trade some breathing room while still protecting yourself from significant losses.
Incorporating these strategies into your trading routine can transform the way you approach the markets. By using chart patterns to identify entry points, confirming those patterns with additional signals, and setting protective stop losses, you can enhance your trading effectiveness. However, always remember that trading involves risks, and it’s essential to remain disciplined and stick to your trading plan.
To summarize, using chart patterns for entry points involves:
- Identifying patterns and understanding their implications.
- Looking for confirmation signals to validate your observations.
- Setting stop losses strategically to minimize potential losses.
With practice and patience, you can become adept at reading these patterns and making them work for you. Like any skill, the more you practice, the better you’ll get. So, keep your eyes on the charts, stay curious, and let the patterns guide your trading journey!
Q: What are chart patterns?
A: Chart patterns are formations created by the price movements of assets on a chart. They help traders identify potential future price movements and trends.
Q: How can I confirm a chart pattern?
A: Confirmation can be achieved through volume spikes, breakouts, or specific candlestick formations that align with the pattern you’ve identified.
Q: What is a stop loss, and why is it important?
A: A stop loss is an order placed to sell a security when it reaches a certain price, designed to limit an investor's loss on a position. It's crucial for protecting your capital in volatile markets.
Q: Can I rely solely on chart patterns for trading decisions?
A: While chart patterns are valuable tools, it’s essential to combine them with other indicators and analysis techniques for a more comprehensive trading strategy.
Confirmation Signals
When trading, understanding is like having a reliable compass in a dense forest. These signals help traders navigate the often chaotic world of financial markets by validating the chart patterns they observe. Without these signals, traders may find themselves lost, making decisions based on incomplete information. So, what exactly are confirmation signals, and how can they enhance your trading strategy?
Confirmation signals typically manifest in various forms, such as volume spikes, breakouts, or even the behavior of related assets. For instance, a significant increase in trading volume during a breakout can indicate strong interest from investors, suggesting that the price movement is likely to continue in the predicted direction. Conversely, if a breakout occurs with low volume, it may signal a false breakout, leading to potential losses. This makes volume an essential factor to consider when validating chart patterns.
Another critical confirmation signal is the breakout itself. Picture this: you’ve identified a head and shoulders pattern, and the price is approaching the neckline. A breakout above this level, especially accompanied by increased volume, can serve as a strong confirmation that the anticipated trend reversal is indeed taking place. It’s like waiting for the green light at a traffic signal; once it turns green, you can confidently proceed. However, traders should always remain cautious and look for additional signals before fully committing to a trade.
In addition to volume and breakouts, traders often look at technical indicators such as the Relative Strength Index (RSI), Moving Averages, or MACD to confirm their chart patterns. These indicators can provide an extra layer of validation. For example, if a trader sees a bullish flag pattern and the RSI is rising, that’s a double confirmation of a potential upward move. It’s like having a second opinion from a trusted friend before making a big decision.
Moreover, it’s essential to remember that confirmation signals should not be used in isolation. They work best when combined with other analysis techniques. For instance, using candlestick patterns alongside chart patterns can offer deeper insights into market sentiment. A bullish engulfing candle appearing near the breakout point of a pattern can significantly enhance the trader’s confidence in the trade.
To summarize, confirmation signals are invaluable tools in a trader's arsenal. They not only help in making informed decisions but also minimize the risks associated with trading. By paying close attention to volume, breakouts, and other technical indicators, traders can better position themselves for success in the ever-evolving financial markets. Remember, in trading, as in life, it's all about making informed choices based on solid evidence.
- What are confirmation signals in trading?
Confirmation signals are indicators that validate chart patterns, helping traders make informed decisions about entering or exiting trades.
- How can I identify confirmation signals?
Look for volume spikes, breakouts, and favorable technical indicators that align with your chart patterns.
- Are confirmation signals foolproof?
No, while they enhance decision-making, no trading signal is 100% reliable. Always combine them with other analysis techniques.
- Can I trade without confirmation signals?
While it's possible, trading without confirmation signals increases the risk of false signals and potential losses.

Setting Stop Losses
When it comes to trading, one of the most crucial aspects of managing risk is knowing how to set your stop losses. Think of a stop loss as your safety net; it’s designed to protect your capital by automatically selling an asset when it reaches a certain price. This way, you can minimize losses on trades that don’t go as planned. But how do you determine the right level for your stop loss? Let’s dive into some strategies!
First off, it’s essential to consider the volatility of the asset you’re trading. For instance, if you’re dealing with a highly volatile stock, setting a stop loss too close to your entry point might trigger it prematurely. On the other hand, if you set it too far away, you risk losing a significant portion of your investment. A good rule of thumb is to place your stop loss below a recent support level for long positions or above a resistance level for short positions. This approach gives your trade some room to breathe while still providing a safety net.
Another effective method is to use a percentage of your trading capital. Many traders opt to risk only a small percentage—typically between 1% to 3%—of their total account balance on a single trade. For example, if you have a $10,000 trading account and decide to risk 2%, your stop loss should be set in such a way that if the trade goes against you, you won’t lose more than $200. This strategy not only protects your capital but also helps maintain a consistent approach to risk management.
It's also worth noting that technical indicators can assist in determining stop loss levels. Indicators like the Average True Range (ATR) can provide insights into how much an asset typically moves, allowing you to set a stop loss that considers normal price fluctuations. By analyzing the ATR, you can set your stop loss at a distance that reflects the asset's volatility, thus avoiding unnecessary stop-outs.
Finally, remember that setting a stop loss is not a one-size-fits-all approach. It’s crucial to periodically review and adjust your stop losses as market conditions change. For instance, if a stock is trending upward and consistently making new highs, you might want to move your stop loss up to lock in profits while still allowing for potential further gains. This practice, known as a trailing stop loss, can help you maximize your profits while keeping your risk in check.
In summary, setting effective stop losses is a balancing act between protecting your capital and allowing your trades the flexibility to succeed. By considering factors like volatility, capital risk, technical indicators, and market conditions, you can develop a robust strategy that enhances your trading performance.
- What is a stop loss? A stop loss is an order placed with a broker to sell a security when it reaches a certain price, designed to limit an investor's loss on a position.
- How do I determine where to set my stop loss? You can set your stop loss based on recent support and resistance levels, a percentage of your total capital, or using technical indicators like the ATR.
- Can I adjust my stop loss after placing it? Yes, you can and should adjust your stop loss based on market conditions and the performance of your trade.
Frequently Asked Questions
- What are chart patterns and why are they important in trading?
Chart patterns are formations created by the price movements of assets on a chart. They are crucial because they provide visual cues that help traders identify potential entry and exit points, allowing for more informed trading decisions. Understanding these patterns can significantly enhance your trading strategy and improve your chances of success in the financial markets.
- What are some common chart patterns I should know?
There are several widely recognized chart patterns that every trader should be aware of. Some of the most common include:
- Head and Shoulders: A reversal pattern indicating a potential change in trend direction.
- Triangles: These include ascending, descending, and symmetrical triangles, which suggest consolidation and possible breakout points.
- Flags: Short-term continuation patterns that indicate a brief pause in the prevailing trend before it resumes.
- How can I identify key levels in a head and shoulders pattern?
Identifying key support and resistance levels within a head and shoulders pattern is vital for making effective trading decisions. Look for the peaks and troughs that form the "head" and "shoulders," as these points often serve as critical levels where price action may reverse. Drawing horizontal lines at these levels can help you visualize potential entry and exit points more clearly.
- What are confirmation signals and how do they help in trading?
Confirmation signals, such as volume spikes or breakouts, validate chart patterns and provide additional confidence in your trading decisions. For instance, if a breakout occurs from a triangle pattern accompanied by high volume, it suggests strong market interest and increases the likelihood of a successful trade. Recognizing these signals is essential for better timing your entries.
- How should I set stop losses based on chart patterns?
Setting stop losses effectively is crucial for protecting your capital. When using chart patterns, place your stop loss just below a key support level (for long positions) or above a resistance level (for short positions). This way, if the market moves against you, your losses will be minimized while allowing for normal price fluctuations.

