How to Identify Breakout Patterns in Crypto Markets
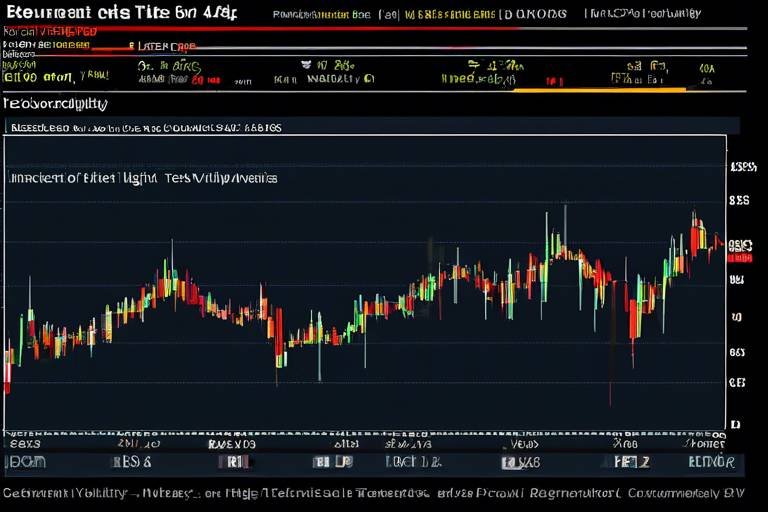
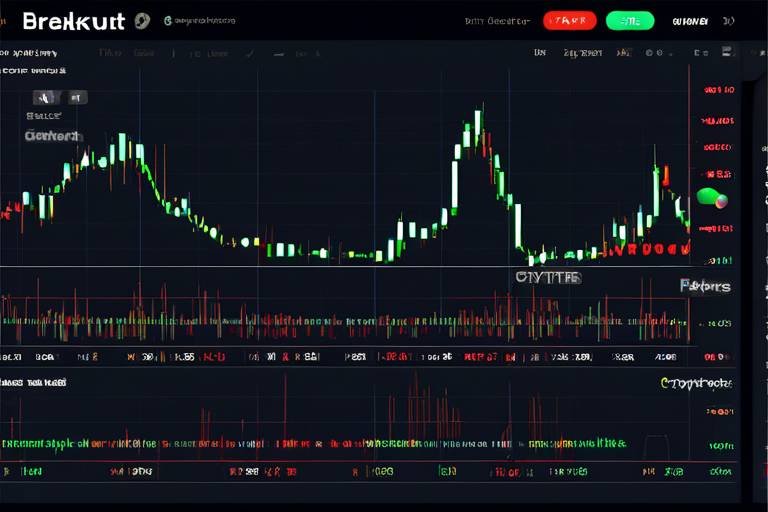
In the fast-paced world of cryptocurrency trading, identifying breakout patterns can be the key to unlocking significant profits. But what exactly are breakout patterns? Simply put, they are formations on a price chart that indicate a potential price movement. When traders spot these patterns, they can make informed decisions about when to enter or exit a position. Imagine you're a surfer waiting for the perfect wave; knowing how to read the ocean can mean the difference between catching a thrilling ride or wiping out. This article dives into the methods for spotting these patterns, emphasizing the importance of technical analysis and market psychology.
Breakout patterns are not just random occurrences; they signal potential shifts in market dynamics. When a cryptocurrency breaks through a resistance level, it often leads to a surge in buying interest, pushing prices higher. Conversely, a breakdown below a support level can trigger panic selling. Recognizing these patterns can give traders a competitive edge, enabling them to anticipate market trends and capitalize on price movements. Think of it as having a treasure map; the patterns guide you toward the hidden riches of the market.
There are several key breakout patterns that traders should familiarize themselves with. Each pattern tells a different story about market sentiment and potential future movements:
- Triangles: These patterns indicate periods of consolidation and can signal upcoming breakouts.
- Flags: Representing short-term price consolidation, flags often follow strong price movements.
- Head-and-Shoulders: A reversal pattern that can indicate a change in trend direction.
Understanding these patterns is crucial for any trader looking to navigate the choppy waters of the crypto markets effectively.
Triangle patterns come in three varieties: ascending, descending, and symmetrical. Each of these formations indicates a period of consolidation, where price movements are tightening, leading to a potential breakout. Recognizing these formations can help traders predict future price movements. Think of triangles like a coiled spring; the tighter they get, the more explosive the potential breakout can be.
Ascending triangles are particularly interesting as they suggest bullish momentum. This pattern is characterized by higher lows and a horizontal resistance level. When traders spot this formation, it often signals a potential upward breakout. It's like watching a pressure cooker build up steam; once the lid pops off, the price can surge dramatically.
On the flip side, descending triangles indicate bearish sentiment. This pattern features lower highs and a horizontal support level. Traders should keep a close eye on this formation, as a breakout below the support line can present lucrative selling opportunities. It's akin to watching a dam slowly crack; once it breaks, the floodgates open, and prices can plummet.
Flag patterns represent a brief consolidation period following a strong price movement. They typically appear as small rectangles that slope against the prevailing trend. Identifying flags can help traders anticipate continuation trends after breakouts. Imagine a flag waving in the wind; it often signals that the momentum is about to carry on, and smart traders can ride that wave for additional profits.
Understanding market psychology is just as important as technical analysis. Traders’ emotions and behaviors often drive price movements, making it essential to consider sentiment analysis alongside chart patterns. The psychology of the market can be a powerful force, often leading to rapid price fluctuations based on collective fear or greed.
One of the most significant psychological factors at play during breakouts is the fear of missing out (FOMO). When prices begin to rise rapidly, traders often rush in, fearing they might miss the chance to profit. Recognizing this psychological phenomenon can help traders time their entries and exits more effectively. It's like a stampede; when one person starts running, everyone else follows, often leading to chaotic price surges.
Analyzing market sentiment through various channels—such as social media, news articles, and trading volumes—can provide valuable insights into potential breakouts. This information can complement technical analysis, allowing traders to make more informed decisions. Think of it as tuning into the heartbeat of the market; understanding the collective mood can guide your trading strategy.
What are breakout patterns? Breakout patterns are formations on price charts that signal potential price movements, helping traders make informed decisions.
How can I identify breakout patterns? By studying chart formations such as triangles and flags, and combining this with market sentiment analysis.
Why is market psychology important in trading? Market psychology drives price movements, and understanding traders' emotions can enhance your trading strategy.

Understanding Breakout Patterns
Breakout patterns are essential signals in the world of cryptocurrency trading. They act like a lighthouse guiding traders through the foggy waters of market volatility. When you spot a breakout pattern, it’s like finding a hidden treasure map that can lead to significant price movements. These patterns indicate that the price of a cryptocurrency is poised to break through a predefined support or resistance level, which can lead to substantial trading opportunities. But what exactly do these patterns look like, and why are they so important?
To put it simply, a breakout occurs when the price moves beyond a specified range, often accompanied by increased trading volume. This surge in activity can indicate a change in market sentiment, which is crucial for traders to understand. By recognizing breakout patterns, you can position yourself advantageously, whether you’re looking to buy into a rising market or sell in a declining one.
One of the fascinating aspects of breakout patterns is their ability to reflect market psychology. When traders collectively act on specific signals, it creates a domino effect, pushing prices in a particular direction. This is where understanding the underlying psychology becomes crucial. For instance, if a significant number of traders start buying a cryptocurrency as it approaches a resistance level, the fear of missing out (FOMO) can kick in, causing even more buying activity and leading to a breakout.
There are several types of breakout patterns that traders often look for, including triangles, flags, and head-and-shoulders formations. Each of these patterns has its own unique characteristics and implications for future price movements. Here’s a brief overview of some key breakout patterns:
| Pattern Type | Description | Market Implication |
|---|---|---|
| Triangles | Consolidation patterns indicating potential breakout points. | Can signal either bullish or bearish trends depending on the formation. |
| Flags | Short-term consolidation following a strong price movement. | Often indicates continuation of the previous trend. |
| Head-and-Shoulders | A reversal pattern that can signal a trend change. | Indicates potential bearish reversal after an uptrend. |
By understanding these patterns, traders can better anticipate market movements and make informed decisions. However, it's important to remember that no pattern is foolproof. The crypto market is notorious for its unpredictability, and while breakout patterns can provide valuable insights, they should always be used in conjunction with other technical indicators and market analysis.
In conclusion, mastering the identification of breakout patterns can be a game-changer for your trading strategy. Think of it as learning to read the signs of the market—like a seasoned sailor reading the wind and waves. With practice and a keen eye, you can navigate the tumultuous waters of cryptocurrency trading and potentially reap the rewards that come with it.

Key Types of Breakout Patterns
When it comes to trading in the volatile world of cryptocurrencies, understanding the can be your golden ticket to making informed decisions. These patterns act as visual cues on price charts, helping traders to anticipate where the market might be headed. Each breakout pattern tells a different story about market sentiment and potential price movements, and recognizing them can significantly enhance your trading strategy.
Among the most prominent breakout patterns are triangles, flags, and head-and-shoulders. Each of these patterns has its own unique characteristics and implications for future price action. For instance, triangles can indicate periods of consolidation where traders are waiting for a decisive move in either direction. Flags, on the other hand, are often seen after a strong price movement and can signal a continuation of the trend. Understanding these nuances is crucial for traders who want to capitalize on breakout opportunities.
Moreover, when analyzing these patterns, it’s essential to consider the context in which they occur. A breakout pattern that forms in a bullish market may lead to different outcomes than one that forms in a bearish market. Therefore, it’s beneficial to combine pattern recognition with other technical indicators to enhance the probability of successful trades. For example, using volume analysis alongside breakout patterns can provide additional confirmation of a breakout's strength.
To summarize, here’s a brief look at the key types of breakout patterns:
| Pattern Type | Description | Implication |
|---|---|---|
| Triangles | Consolidation pattern with ascending, descending, or symmetrical shapes. | Potential breakout in either direction. |
| Flags | Short-term consolidation after a strong price movement. | Continuation of the prevailing trend. |
| Head-and-Shoulders | Reversal pattern indicating a change in trend direction. | Potential bearish reversal after an uptrend. |
By mastering these breakout patterns, you can better position yourself in the fast-paced crypto markets. Whether you're a seasoned trader or just starting out, recognizing these formations can provide you with a significant edge. So, keep your eyes peeled for these patterns, and remember that the market is always telling a story—you just need to know how to read it.

Triangle Patterns
Triangle patterns are fascinating formations that can significantly influence trading decisions in the cryptocurrency markets. These patterns emerge during periods of consolidation, where price movements become increasingly narrow, creating a visual representation of indecision among traders. When you spot a triangle pattern, it's like seeing a coiled spring ready to release its energy; the breakout that follows can lead to a substantial price movement. Understanding the different types of triangle patterns—ascending, descending, and symmetrical—can empower traders to make more informed decisions and capitalize on potential market shifts.
Let's delve into each type of triangle pattern to understand their unique characteristics and implications:
- Ascending Triangles: This pattern is characterized by higher lows and a horizontal resistance level. It typically indicates bullish momentum, suggesting that buyers are gaining strength. When the price breaks above the resistance level, it can trigger a surge in buying activity, leading to a potential upward breakout. Traders should look for confirmation through increased volume to validate the breakout.
- Descending Triangles: In contrast, descending triangles indicate bearish sentiment. This pattern features lower highs and a horizontal support level, signaling that sellers are starting to dominate the market. A breakout below the support level can lead to significant selling pressure, making it an opportune moment for traders to enter short positions.
- Symmetrical Triangles: These patterns are a bit more balanced, as they consist of converging trendlines where both buyers and sellers are vying for control. The price oscillates between the two trendlines until it eventually breaks out in either direction. The key here is to wait for a breakout confirmation, as the direction can be unpredictable.
Recognizing triangle patterns is not just about spotting shapes on a chart; it's about understanding the underlying market psychology. Traders often find themselves in a tug-of-war, and the outcome of this battle can lead to explosive price movements. By keeping an eye on volume during these patterns, traders can gauge the strength of the breakout. A breakout accompanied by high volume is generally more reliable than one with low volume, which might indicate a false breakout.
In summary, triangle patterns are essential tools in a trader's arsenal. They provide insight into market sentiment and potential price movements, allowing traders to position themselves strategically. Whether you're a novice or an experienced trader, mastering these patterns can enhance your trading strategy and improve your chances of success in the ever-volatile crypto markets.
- What is a breakout pattern? A breakout pattern signals a potential price movement when the price breaks above resistance or below support levels.
- How can I identify triangle patterns? Look for converging trendlines on a price chart, indicating consolidation before a potential breakout.
- Are triangle patterns reliable? While they can provide valuable insights, it's essential to confirm breakouts with volume and other technical indicators.

Ascending Triangles
Ascending triangles are a fascinating breakout pattern that traders often encounter in the crypto markets. These formations typically suggest a bullish trend, making them a beacon of hope for those looking to capitalize on upward price movements. So, what exactly defines an ascending triangle? At its core, this pattern consists of two key components: a series of higher lows and a horizontal resistance level. Imagine a mountain climber steadily ascending a slope, pushing against a ceiling of rock above them. The climber's determination to reach the peak mirrors the price action in an ascending triangle, where buyers are consistently willing to pay more, creating those higher lows.
As prices continue to rise and approach that horizontal resistance line, the tension builds—much like a tightly wound spring ready to release its energy. Traders often look for a breakout above this resistance line as a signal to enter the market. But how can one effectively identify this pattern? It’s essential to look for the following characteristics:
- Higher Lows: Each successive low should be higher than the previous one, indicating increasing buying pressure.
- Horizontal Resistance: The price consistently hits a specific level but fails to break through, creating a clear resistance line.
- Volume Increase: Ideally, the volume should increase as the price approaches the resistance line, confirming the strength of the breakout.
Once the price breaks above the resistance level, it often leads to a significant price surge, as many traders rush in to capitalize on the upward momentum. However, it’s crucial to manage risk effectively during these breakout scenarios. Setting stop-loss orders just below the last higher low can help protect against unexpected reversals. Additionally, considering the overall market context and other technical indicators can further enhance the likelihood of a successful trade.
In summary, ascending triangles are a powerful tool in a trader's arsenal, serving as a clear indicator of bullish sentiment. By recognizing these patterns and understanding their implications, traders can position themselves advantageously in the ever-volatile world of cryptocurrency. So, the next time you spot an ascending triangle on your charts, remember the climber's journey and prepare for the potential breakout!
- What is an ascending triangle? An ascending triangle is a bullish continuation pattern characterized by higher lows and a horizontal resistance level.
- How can I trade an ascending triangle? Traders typically look for a breakout above the resistance level to enter a long position, often using stop-loss orders below the last higher low for risk management.
- Are ascending triangles always reliable? While they can be a strong indicator of bullish sentiment, it's essential to consider other factors such as market conditions and volume to confirm the breakout.

Descending Triangles
Descending triangles are a fascinating and crucial pattern in the world of cryptocurrency trading. These formations often indicate a bearish sentiment in the market, which can be a goldmine for traders who know what to look for. The pattern is characterized by a series of lower highs and a horizontal support level, creating a triangle that slopes downwards. This setup suggests that sellers are gaining control, pushing prices down while buyers struggle to maintain support.
When you spot a descending triangle, it’s essential to pay attention to the support line—the horizontal line that connects the lows. If the price breaks below this support, it can signal a strong selling opportunity. However, it’s not just about the breakout; understanding the volume behind this movement can provide further confirmation. A breakout accompanied by high volume is typically more reliable than one with low volume.
Let’s visualize this with a simple table that outlines the key characteristics of descending triangles:
| Characteristic | Description |
|---|---|
| Lower Highs | Each successive peak is lower than the previous one, indicating selling pressure. |
| Horizontal Support | A consistent support level that traders watch closely for potential breakouts. |
| Breakout Point | When the price breaks below the support line, it often leads to increased selling. |
| Volume Confirmation | High trading volume during the breakout typically indicates a stronger move. |
As a trader, recognizing descending triangles can be your secret weapon. They often appear after a price rally, suggesting that the market is taking a breather before potentially heading lower. It’s like watching a balloon slowly deflate; the pressure is building until it can’t hold on anymore. But remember, not every descending triangle leads to a breakout. Sometimes, prices might bounce back and test the support again, creating opportunities for both buyers and sellers.
To navigate these waters, consider combining your analysis of descending triangles with other indicators. For instance, using moving averages or RSI (Relative Strength Index) can help confirm the trend. Always remember that trading is as much about psychology as it is about patterns. The fear and uncertainty in the market can amplify the effects of a descending triangle, making it crucial to stay alert and flexible in your strategy.
In conclusion, mastering the identification of descending triangles can significantly enhance your trading strategy. They serve as a clear signal of potential downward movements, and if you play your cards right, you could capitalize on these patterns to make informed trading decisions. Keep your eyes peeled for these formations, and don’t forget to manage your risk wisely!
- What is a descending triangle? A descending triangle is a bearish chart pattern characterized by lower highs and a horizontal support line.
- How do I trade a descending triangle? Traders typically look for a breakout below the support line, often confirmed by increased trading volume.
- Are descending triangles always bearish? While they often indicate bearish sentiment, not every descending triangle leads to a downward breakout; price action should be monitored closely.
- What indicators should I use with descending triangles? Consider using moving averages, RSI, or volume analysis to confirm potential breakouts.

Flag Patterns
Flag patterns are fascinating formations that emerge in the world of cryptocurrency trading, often seen as a sign of strong momentum. They typically develop after a significant price movement, whether that’s a sharp rise or a steep decline. Imagine a flag waving in the wind; it stands out boldly against the backdrop of the sky, just as these patterns stand out against the price charts. The key to understanding flag patterns lies in recognizing their structure and the psychology behind them.
Essentially, a flag pattern consists of two main components: the flagpole and the flag itself. The flagpole represents the initial price movement, while the flag is the consolidation phase that follows. This consolidation usually occurs in a parallel channel, which can either be upward or downward sloping. Traders often look for these patterns because they can signal a continuation of the preceding trend. For instance, after a strong bullish movement, a bullish flag pattern may appear, suggesting that the price is likely to break out to the upside once the consolidation phase is complete.
To give you a clearer picture, let’s break down the characteristics of flag patterns:
- Formation: Flags are typically rectangular and can be either upward or downward sloping.
- Duration: These patterns usually form over a short period, often lasting from a few days to a couple of weeks.
- Volume: A decrease in trading volume during the flag formation is common, followed by an increase in volume at the breakout.
Now, why should traders pay attention to flag patterns? Well, they offer an excellent opportunity to enter the market with a favorable risk-to-reward ratio. When a breakout occurs, it often leads to a significant price movement, allowing traders to capitalize on the momentum. However, it’s crucial to wait for confirmation before jumping in. This means waiting for the price to break above the upper trendline of the flag with increased volume, which can serve as a strong signal that the previous trend is likely to continue.
In summary, flag patterns are not just simple shapes on a chart; they are powerful indicators of potential price movements. By understanding how to identify and interpret these patterns, traders can enhance their strategies and improve their chances of success in the volatile crypto markets. Keep in mind that while flag patterns can be reliable, they should always be used in conjunction with other technical indicators and market analysis for the best results.
What is a flag pattern in trading?
A flag pattern is a technical analysis formation that indicates a brief consolidation period following a strong price movement, suggesting that the previous trend is likely to continue.
How can I identify a flag pattern?
Look for a sharp price movement followed by a rectangular consolidation phase that forms a flag. The flag should slope against the prevailing trend, and a breakout above or below the flag can signal the continuation of the trend.
Are flag patterns reliable indicators?
While flag patterns can be reliable, they should not be used in isolation. It's best to combine them with other technical indicators and market analysis to increase the likelihood of successful trades.

Market Psychology Behind Breakouts
Understanding market psychology is crucial for identifying breakout patterns in the cryptocurrency markets. Why? Because the market is not just a collection of numbers and charts; it’s driven by the emotions and behaviors of traders. When you grasp how psychology influences price movements, you can make more informed trading decisions.
One of the most significant psychological factors at play is the Fear of Missing Out (FOMO). This intense feeling can drive traders to act impulsively, often leading to rapid price increases during breakout scenarios. Imagine standing in line for a concert ticket, and as you get closer, you hear the crowd getting louder. The excitement builds, and you rush to buy your ticket, fearing it might sell out. This is similar to how FOMO works in trading; as prices start to rise, more and more traders jump in, creating a snowball effect. Recognizing FOMO can help you time your entries and exits effectively, allowing you to capitalize on these emotional surges.
Another vital aspect is market sentiment analysis. This involves gauging the overall mood of the market by examining various indicators such as social media chatter, news headlines, and trading volume. For instance, if a new cryptocurrency is trending on social media, it might indicate a potential breakout. By analyzing sentiment, you can complement your technical analysis to make more informed decisions. Here’s a quick breakdown:
| Indicator | What to Look For |
|---|---|
| Social Media | Increased mentions or positive sentiment |
| News | Positive developments or partnerships |
| Trading Volume | Significant spikes in volume during price movements |
Additionally, it’s essential to recognize that traders often react to the same information differently. For example, while one trader might see a breakout as an opportunity to buy, another might fear a reversal and choose to sell. This divergence in reactions can create volatility, leading to unpredictable price movements. Therefore, understanding not just your own psychology but that of the market as a whole can be a game-changer.
In summary, the psychology behind breakouts is a complex interplay of emotions, sentiment, and behavior. By staying aware of factors like FOMO and regularly analyzing market sentiment, you can enhance your trading strategies and increase your chances of success in the dynamic world of cryptocurrency.
- What is a breakout pattern?
A breakout pattern signals a potential price movement when the price breaks through a defined support or resistance level. - How can I identify FOMO in the market?
Look for rapid price increases accompanied by high trading volume and increased social media chatter. - Why is market sentiment analysis important?
Market sentiment analysis helps traders understand the emotions driving the market, allowing for better decision-making.

FOMO and Breakouts
Fear of missing out, commonly known as FOMO, is a powerful psychological driver in the cryptocurrency markets. It often manifests when traders witness rapid price increases and feel the urge to jump in before it's too late. Imagine watching a rocket launch; the excitement builds, and you can’t help but want to be part of that exhilarating journey. In the crypto world, this sensation can lead to frantic buying as traders rush to capitalize on what they perceive as a fleeting opportunity.
During breakout scenarios, FOMO can create a perfect storm of buying pressure. As the price breaches a significant resistance level, the excitement escalates, attracting more traders who fear being left behind. This can result in a vicious cycle where the price continues to rise simply because more and more people are buying in. However, it’s crucial to remember that while FOMO can lead to substantial gains, it can also result in devastating losses if the breakout turns out to be a false signal.
To effectively navigate the waters of FOMO, traders should consider a few essential strategies:
- Set Clear Entry and Exit Points: Before entering a trade, establish your target price and stop-loss levels. This way, you can make decisions based on your strategy rather than emotions.
- Use Technical Indicators: Rely on technical analysis to confirm breakout signals. Indicators like the Relative Strength Index (RSI) and Moving Averages can help you gauge whether a breakout is genuine or just a temporary spike.
- Stay Informed: Keep an eye on the news and market sentiment. Understanding what’s driving the price movements can help you make more informed decisions rather than acting on impulse.
In conclusion, while FOMO can propel prices during breakout situations, it’s vital to approach it with caution. By combining emotional awareness with solid trading strategies, you can harness the power of FOMO without falling victim to its pitfalls. Remember, the key is to stay calm and collected, even when the market feels like a rollercoaster ride.
Q: What is FOMO in the context of cryptocurrency trading?
A: FOMO, or Fear of Missing Out, refers to the anxiety traders feel when they see prices rising and worry they might miss potential profits. This can lead to impulsive buying decisions.
Q: How can I avoid making poor trading decisions due to FOMO?
A: To avoid FOMO, set clear trading goals, use technical analysis, and stay informed about market conditions. Establishing a trading plan can help you stick to your strategy rather than acting on emotion.
Q: Are breakout patterns always reliable indicators?
A: While breakout patterns can signal potential price movements, they are not foolproof. It's essential to use them in conjunction with other technical indicators and market analysis to make informed trading decisions.

Market Sentiment Analysis
Market sentiment analysis is like tuning into the heartbeat of the cryptocurrency world. It involves gauging the overall attitude of investors and traders towards a particular cryptocurrency or the market as a whole. This analysis can be pivotal, especially when combined with technical indicators, as it helps traders anticipate potential breakout patterns. Understanding the mood of the market can often provide clues that charts alone may not reveal. For instance, when the sentiment is overwhelmingly positive, it might indicate that a breakout is on the horizon, while negative sentiment could suggest the opposite.
One effective way to gauge market sentiment is through social media platforms. Twitter, Reddit, and various trading forums can provide real-time insights into what traders are thinking and feeling. When you see a surge in discussions about a specific cryptocurrency, it could signal an impending breakout. For example, if a particular coin is trending on Twitter, it might be worth investigating further. But remember, not all hype is justified; it's essential to filter out noise from genuine sentiment.
Another key aspect of market sentiment analysis is monitoring news events. Major announcements, regulatory changes, or technological advancements can significantly impact market sentiment. When good news breaks, it can lead to a surge in buying activity, while bad news can trigger panic selling. Traders should keep an eye on the news cycle and be ready to act when significant events occur. Here’s a simple table summarizing how different types of news can affect sentiment:
| Type of News | Impact on Sentiment |
|---|---|
| Positive Announcements (e.g., partnerships, upgrades) | Increased buying interest, potential breakout |
| Negative News (e.g., hacks, regulatory actions) | Panic selling, potential breakdown |
| Market Trends (e.g., bull or bear markets) | General sentiment shift, influencing breakout potential |
Moreover, trading volume is another critical indicator of market sentiment. High trading volume during a price increase can signify strong bullish sentiment, often leading to a breakout. Conversely, if prices rise but volume is low, it might indicate a lack of conviction, suggesting that the breakout could fizzle out. Therefore, keeping an eye on volume trends is essential for any trader looking to capitalize on potential breakouts.
In conclusion, market sentiment analysis is a powerful tool in a trader's arsenal. By understanding the emotional landscape of the market, traders can make more informed decisions and better anticipate breakout patterns. Always remember to combine sentiment analysis with technical indicators for a more holistic trading strategy. After all, trading is not just about numbers; it's also about understanding the people behind those numbers.
- What is market sentiment analysis?
Market sentiment analysis involves evaluating the overall attitude of traders and investors towards a cryptocurrency or the market, often using social media, news, and trading volume as indicators. - Why is market sentiment important for trading?
Understanding market sentiment helps traders anticipate potential breakout patterns and make informed decisions, enhancing their chances of successful trades. - How can I measure market sentiment?
Market sentiment can be measured through social media trends, news events, and trading volume analysis, providing insight into the mood of the market.
Frequently Asked Questions
- What are breakout patterns in cryptocurrency trading?
Breakout patterns are formations that indicate potential price movements in the cryptocurrency markets. They signal when the price is likely to move significantly beyond a certain level, allowing traders to make informed decisions based on these patterns.
- How can I identify a triangle breakout pattern?
To identify a triangle breakout pattern, look for converging trend lines that create a triangle shape on the price chart. There are three main types: ascending triangles (bullish), descending triangles (bearish), and symmetrical triangles (neutral). Recognizing these formations can help predict future price movements.
- What does an ascending triangle indicate?
An ascending triangle suggests bullish momentum. It is characterized by higher lows and a horizontal resistance level. When the price breaks above the resistance, it often signals a potential upward breakout, making it an exciting opportunity for traders.
- What is the significance of flag patterns?
Flag patterns represent a brief consolidation period following a strong price movement, typically indicating a continuation of the existing trend. Identifying these flags can help traders anticipate potential breakouts and capitalize on ongoing trends.
- How does market psychology affect breakout patterns?
Market psychology plays a crucial role in breakout patterns. Traders' emotions, such as fear of missing out (FOMO), can drive rapid price increases during breakouts. Understanding these psychological factors can help traders time their entries and exits more effectively.
- What tools can I use for market sentiment analysis?
To analyze market sentiment, traders often use social media platforms, news articles, and trading volume data. These tools provide insights into the general mood of the market, which can complement technical analysis for more informed trading decisions.
- Is it possible to predict breakouts accurately?
While it's challenging to predict breakouts with absolute certainty, understanding breakout patterns, market psychology, and sentiment analysis can significantly improve your chances. Combining these factors creates a more comprehensive trading strategy.
- What should I do if I see a breakout pattern forming?
If you spot a breakout pattern, consider your trading strategy carefully. Look for confirmation signals, such as increased trading volume or price movement beyond key support or resistance levels. This can help you decide whether to enter or exit a trade.