How to Analyze Market Cycles for Crypto Trading
In the ever-evolving world of cryptocurrency trading, understanding market cycles is not just a luxury; it's a necessity. These cycles, which are essentially the ebb and flow of market prices, can significantly influence your trading strategies and outcomes. By mastering the techniques and indicators associated with market cycles, you can elevate your trading game and make more informed decisions. Imagine being able to predict the next wave of price movements, like a surfer catching the perfect wave—it's all about timing and understanding the rhythm of the market.
Market cycles in crypto trading refer to the recurring patterns of price movements, encompassing periods of growth and decline. Recognizing these cycles allows traders to anticipate market behavior and adjust their strategies accordingly. Just like the changing seasons, market cycles have distinct phases: expansion, peak, contraction, and trough. By learning to identify these phases, you can position yourself to capitalize on both bullish and bearish trends.
At the heart of market cycles are the concepts of bull and bear markets, which represent opposite ends of the trading spectrum. A bull market is characterized by rising prices and investor optimism, while a bear market signifies declining prices and widespread pessimism. Understanding the characteristics of these markets is crucial for any trader. Think of it like navigating a stormy sea; knowing whether the winds are in your favor or against you can make all the difference in your journey.
Bull markets are defined by several key characteristics: increasing prices, heightened investor confidence, and a surge in buying activity. During these periods, traders often experience a sense of euphoria, leading to more aggressive buying. Recognizing these indicators can help you capitalize on upward trends. For instance, if you notice a consistent rise in price along with increased trading volume, it may signal that the bull market is gaining momentum.
One of the most effective ways to gauge the strength of a bull market is through momentum indicators like the Relative Strength Index (RSI). The RSI measures the speed and change of price movements, providing insights into whether a market is overbought or oversold. An RSI above 70 typically indicates an overbought condition, while an RSI below 30 suggests oversold. By analyzing these indicators, traders can identify optimal entry points and maximize their profits.
Investor psychology plays a pivotal role in sustaining bull markets. Emotions such as greed and fear can significantly influence market behavior. When prices are rising, fear of missing out (FOMO) can drive more investors to buy, further pushing prices up. Understanding these psychological triggers can enhance your trading strategies and risk management. It’s essential to remain grounded and avoid making impulsive decisions based on emotions.
On the flip side, bear markets are characterized by declining prices, reduced investor confidence, and increased selling pressure. These markets can be daunting, but recognizing the signs allows traders to protect their investments. For instance, if you observe a consistent drop in price accompanied by high trading volume, it may indicate that a bear market is in play. In such cases, it’s wise to consider strategies that minimize losses, such as setting stop-loss orders.
To effectively analyze market cycles, traders often rely on technical analysis tools. These include moving averages and Fibonacci retracement levels, which provide valuable insights into potential price movements and support levels. By mastering these tools, you can enhance your ability to predict future price actions and make more informed trading decisions.
Moving averages are one of the simplest yet most powerful tools for identifying trends over specific time frames. By smoothing out price data, they help traders visualize the overall direction of the market. For example, the 50-day moving average can serve as a critical support level during a bull market. When the price stays above this moving average, it indicates a strong bullish trend, while a price drop below it could signal a reversal.
Fibonacci retracement levels are another essential tool for traders looking to identify potential reversal points during market cycles. By applying Fibonacci ratios to price movements, traders can pinpoint areas where the price may retrace before continuing its trend. Understanding how to apply these levels can significantly improve your trading accuracy and risk management.
- What are market cycles in cryptocurrency trading? Market cycles refer to the recurring patterns of price movements, including periods of growth (bull markets) and decline (bear markets).
- How can I identify bull and bear markets? Look for key indicators such as price trends, trading volume, and investor sentiment to determine whether the market is bullish or bearish.
- What tools can help analyze market cycles? Technical analysis tools like moving averages and Fibonacci retracement levels are essential for analyzing market cycles and predicting price movements.

Understanding Market Cycles
Market cycles in crypto trading are like the tides of the ocean—sometimes they rise, and sometimes they fall, but they always come back around. Understanding these cycles is crucial for traders who want to navigate the turbulent waters of cryptocurrency effectively. At its core, a market cycle represents the recurring patterns of price movements that occur over time. By recognizing these patterns, traders can anticipate market behavior and make informed decisions that could lead to increased profitability.
So, what exactly are these cycles? They typically consist of four main phases: accumulation, uptrend, distribution, and downtrend. Each phase has its own characteristics and signals that can help traders understand what is happening in the market. For instance, during the accumulation phase, savvy investors begin to buy in while prices are low, setting the stage for a potential price surge. In contrast, the distribution phase is when those same investors start to sell off their holdings to take profits, often leading to a downward trend.
Understanding these phases is not just about recognizing patterns; it’s about leveraging them to your advantage. Imagine being able to predict when the market is about to shift from a downtrend to an uptrend. This knowledge can be a game-changer for your trading strategy. It’s like having a secret map that guides you through the unpredictable landscape of crypto trading.
Another important aspect of market cycles is the psychological factor. Traders’ emotions often drive market movements, making it essential to understand the psychology behind these cycles. For instance, during a bull market, optimism reigns, and FOMO (fear of missing out) can lead to irrational buying. Conversely, during a bear market, fear and uncertainty can cause panic selling. Recognizing these emotional triggers can help traders maintain composure and make rational decisions, even when the market is volatile.
To sum it up, understanding market cycles is a vital skill for any crypto trader. By familiarizing yourself with the phases of these cycles and the psychological factors at play, you can better anticipate market movements and adjust your strategies accordingly. This knowledge not only enhances your trading decisions but also empowers you to navigate the ever-changing crypto landscape with confidence.

Identifying Bull and Bear Markets
When it comes to cryptocurrency trading, being able to identify bull and bear markets is crucial for any trader looking to maximize their profits and minimize their losses. But what exactly do these terms mean? In a nutshell, a bull market refers to a period where prices are rising or are expected to rise, while a bear market is characterized by declining prices. Understanding these market conditions is like having a compass in the unpredictable world of crypto. It helps you navigate through the storms and find the best opportunities.
So, how can you recognize these market cycles? One of the first things to look for is the overall trend in price movements. A bull market typically shows consistent upward momentum, with prices making higher highs and higher lows. Conversely, in a bear market, prices tend to make lower highs and lower lows, indicating a downward trend. But it's not just about looking at price charts; there are other indicators that can help you determine the market condition.
For instance, trading volume is a key factor. In a bull market, you’ll often see an increase in trading volume as more investors jump in, driven by optimism and a belief that prices will continue to rise. On the flip side, bear markets usually see declining volumes, as traders become hesitant to buy and start to sell off their assets. This lack of interest can further drive down prices, creating a vicious cycle.
Another important aspect to consider is market sentiment. This can often be gauged through social media trends, news articles, and even community discussions on platforms like Reddit or Twitter. During a bull market, the sentiment is generally positive, with traders feeling confident and eager to invest. In contrast, during a bear market, the mood shifts to pessimism, with many investors fearing further losses. Keeping an ear to the ground on market sentiment can provide invaluable insights into the prevailing market conditions.
To make it easier to understand, here’s a quick comparison of the two market types:
| Feature | Bull Market | Bear Market |
|---|---|---|
| Price Trend | Rising | Declining |
| Investor Sentiment | Positive | Negative |
| Trading Volume | Increasing | Decreasing |
| Market Activity | High | Low |
Recognizing these patterns can significantly enhance your trading strategy. It’s not just about making trades; it’s about making informed decisions based on the current market cycle. By being aware of whether you're in a bull or bear market, you can adjust your trading tactics accordingly—whether that means holding onto your assets during a bull run or cutting losses in a bear market.
In conclusion, identifying bull and bear markets is not just a skill; it's an art form that combines technical analysis, market sentiment, and trading volume. By honing this skill, you can position yourself to make smarter trades and navigate the often turbulent waters of cryptocurrency trading.

Characteristics of Bull Markets
Bull markets are like a thrilling roller coaster ride, where the excitement builds as prices soar to new heights. During these periods, we witness a remarkable surge in asset values, driven by a wave of investor optimism and confidence. But what exactly characterizes a bull market? Well, it’s not just about rising prices; it encompasses a variety of factors that create a robust trading environment. One of the primary indicators is the consistent upward trend in prices, often accompanied by increased volume in trading activity. This means more people are buying in, which further fuels the price increases.
Another key characteristic is the strong buying sentiment among investors. When confidence is high, individuals are more likely to invest, believing that the market will continue to rise. This positive feedback loop can create a self-fulfilling prophecy, where rising prices lead to more buying, which in turn drives prices even higher. Furthermore, during a bull market, you might notice a shift in media coverage as well. News outlets often highlight success stories and positive forecasts, which can attract even more investors into the market.
In addition to these factors, the psychology of investors plays a crucial role. As prices ascend, fear of missing out (FOMO) can set in, pushing more people to jump on the bandwagon. This emotional aspect can be likened to a crowd at a concert, where the energy builds as more people join in, creating an electric atmosphere. As a trader, recognizing these psychological triggers can be incredibly valuable.
Here’s a quick summary of the characteristics of bull markets:
- Rising Prices: Consistent upward movement in asset values.
- Increased Investor Confidence: A strong belief in continued growth.
- High Trading Volume: More transactions indicate heightened interest.
- Positive Media Coverage: A focus on success stories and optimistic forecasts.
- FOMO Among Investors: Emotional buying driven by fear of missing out.
Understanding these characteristics is essential for traders looking to capitalize on the opportunities presented during bull markets. By keeping an eye on these indicators, you can make informed decisions about when to enter or exit trades, ultimately enhancing your trading strategy and potential profitability.
Momentum Indicators in Bull Markets
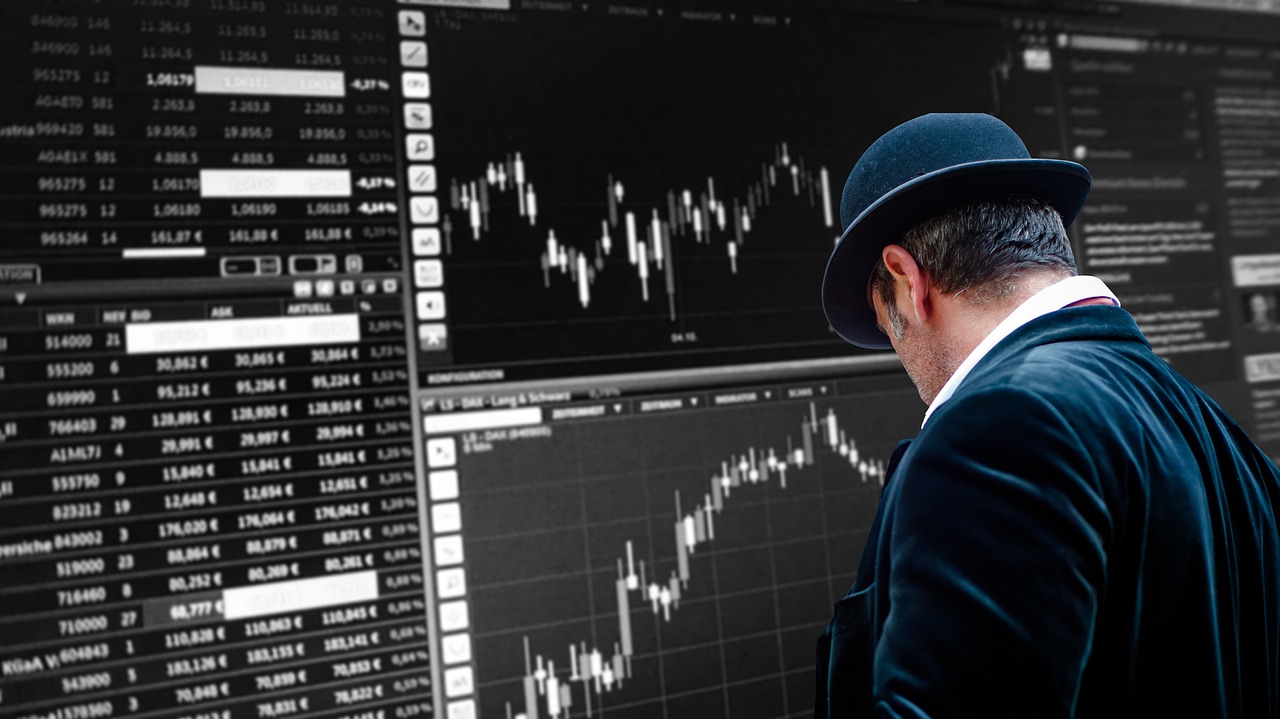
When diving into the world of bull markets, one cannot overlook the significance of momentum indicators. These tools serve as vital signposts, guiding traders through the often turbulent waters of price fluctuations. But what exactly are momentum indicators? In simple terms, they measure the speed and strength of price movements, helping traders assess whether a trend is likely to continue or reverse. In a bull market, where prices are on the rise, these indicators become even more crucial.
One of the most popular momentum indicators is the Relative Strength Index (RSI). The RSI operates on a scale of 0 to 100, providing insights into whether an asset is overbought or oversold. A reading above 70 typically indicates that the market may be overbought, suggesting a potential price correction. Conversely, a reading below 30 signals that the market may be oversold, presenting a buying opportunity. By keeping an eye on the RSI, traders can make more informed decisions about when to enter or exit a position.
Another essential tool is the Moving Average Convergence Divergence (MACD). This indicator not only shows the relationship between two moving averages of an asset's price but also reveals momentum trends. When the MACD line crosses above the signal line, it can indicate a bullish momentum, while a cross below may suggest bearish conditions. In a bull market, traders often look for these bullish crossovers as a cue to enter the market.
Moreover, traders should also consider the Average Directional Index (ADX). The ADX helps determine the strength of a trend, regardless of its direction. A rising ADX above 20 typically indicates a strong trend, which can be particularly useful in bull markets. By combining the ADX with other momentum indicators, traders can enhance their ability to identify strong bullish trends and avoid potential pitfalls.
In summary, momentum indicators are indispensable tools for traders operating in bull markets. By analyzing the RSI, MACD, and ADX, traders can gain valuable insights into market strength and potential reversals. Understanding these indicators not only helps in making informed trading decisions but also enhances overall risk management strategies. So, the next time you find yourself in a bull market, remember to keep these momentum indicators close at hand—they might just be the key to unlocking your trading potential!
- What are momentum indicators?
Momentum indicators are tools used in technical analysis to measure the speed and strength of price movements in a market.
- Why are momentum indicators important in a bull market?
They help traders identify potential entry and exit points, assess market strength, and make informed decisions based on price trends.
- How does the RSI work?
The Relative Strength Index (RSI) measures the speed of price movements on a scale from 0 to 100, indicating whether an asset is overbought or oversold.
- What does a rising ADX indicate?
A rising Average Directional Index (ADX) above 20 suggests a strong trend, which is particularly useful in identifying bullish trends in a bull market.

Psychology of Investors in Bull Markets
When we step into a bull market, the atmosphere is often electric. Investors are filled with a sense of optimism, believing that prices will continue to rise indefinitely. This enthusiasm can lead to a herd mentality, where individuals follow the crowd, often ignoring fundamental analysis. But why does this happen? Well, it’s all about psychology. In a bull market, the prevailing sentiment is that of excitement and confidence, which can sometimes cloud judgment.
As prices soar, many investors experience a rush of euphoria. They feel invincible, thinking that every investment they make will yield profits. This emotional state can lead to risky behaviors, such as investing larger sums than they can afford to lose or holding onto assets for too long, hoping for even greater gains. It’s akin to riding a roller coaster; the thrill can be exhilarating, but it’s crucial to remember that what goes up can also come down.
Moreover, the psychology of investors during these times can be influenced by various factors, including media hype and social proof. When news outlets and social media platforms buzz with stories of individuals striking it rich, it creates a FOMO (fear of missing out) effect. Investors rush in, often disregarding their own research or risk tolerance. This behavior can inflate prices even further, creating a bubble that, when it bursts, leads to significant losses for those who entered the market late.
To navigate these psychological traps, traders must cultivate a disciplined mindset. Here are some strategies to consider:
- Set Clear Goals: Define what you want to achieve with your investments. This clarity will help you make rational decisions rather than emotional ones.
- Stick to a Plan: Develop a trading plan that includes entry and exit strategies. Adhering to this plan can help mitigate impulsive decisions.
- Stay Informed: Continuously educate yourself about market trends and underlying assets. Knowledge can counteract emotional decision-making.
In conclusion, understanding the psychology of investors in bull markets is crucial for anyone looking to succeed in cryptocurrency trading. By recognizing the emotional highs and lows, traders can better prepare themselves to make informed decisions. Remember, while the thrill of a bull market can be intoxicating, maintaining a level head can be the key to long-term success.
Q: What is a bull market?
A bull market refers to a financial market in which prices are rising or are expected to rise. It often reflects investor confidence and optimism.
Q: How can I identify a bull market?
Indicators of a bull market include rising prices, increased trading volume, and positive market sentiment. Technical analysis tools can also help confirm these trends.
Q: What should I do during a bull market?
Consider investing strategically, but remain cautious. Set clear goals, stick to your trading plan, and avoid making impulsive decisions based on emotions.
Characteristics of Bear Markets
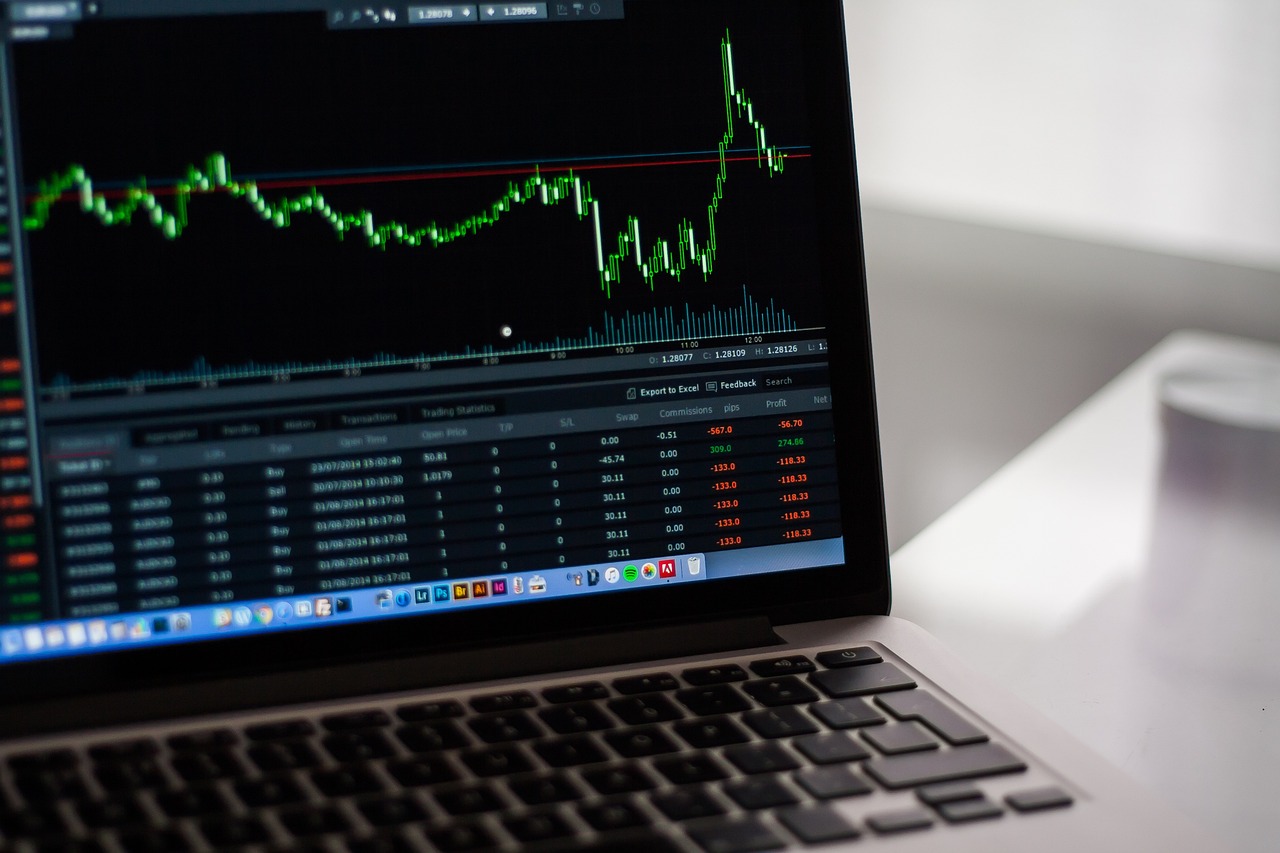
Bear markets, often seen as the dark clouds of the investing world, are characterized by a significant decline in asset prices, typically defined as a drop of 20% or more from recent highs. During these turbulent times, investor sentiment tends to plummet, leading to a pervasive sense of pessimism and fear among market participants. This emotional climate can create a self-fulfilling prophecy, where the negative outlook drives further selling, causing prices to spiral downwards.
One of the key indicators of a bear market is the increased selling pressure. As prices begin to fall, many investors rush to cut their losses, exacerbating the downward trend. This behavior is often fueled by a lack of confidence in the market's recovery, prompting even those who are typically long-term investors to rethink their positions. In essence, a bear market can feel like a game of musical chairs, where the music stops, and everyone scrambles to get out before it's too late.
Another characteristic of bear markets is the decline in trading volume. As fear takes hold, many traders choose to sit on the sidelines rather than engage in buying or selling. This reduced activity can lead to increased volatility, making it challenging to predict price movements. When fewer participants are willing to enter the market, it creates a situation where even small trades can have a significant impact on prices, much like a pebble tossed into a still pond creates ripples that expand outward.
Additionally, bear markets often see a shift in the types of assets that attract investor interest. During these downturns, many traders flock to safer havens, such as stablecoins or fiat currencies, as they seek to preserve their capital. This flight to safety can create a stark contrast in the market, where previously popular cryptocurrencies may experience sharp declines while more stable assets hold their ground.
To help visualize the characteristics of bear markets, consider the following table that highlights key indicators:
| Characteristic | Description |
|---|---|
| Price Decline | Drop of 20% or more from recent highs |
| Investor Sentiment | Pessimism and fear dominate market psychology |
| Selling Pressure | Increased selling activity as investors cut losses |
| Trading Volume | Decline in trading activity, leading to increased volatility |
| Asset Preference | Shift towards safer assets, such as stablecoins |
Recognizing these characteristics is crucial for traders looking to navigate the choppy waters of a bear market. By understanding the emotional and market dynamics at play, you can develop strategies that not only protect your investments but also position you to capitalize on opportunities when the market eventually turns around. After all, just as the sun eventually breaks through the clouds after a storm, the crypto market too has its cycles of recovery.
- What defines a bear market in cryptocurrency? A bear market is typically defined as a decline of 20% or more in the price of a cryptocurrency from its recent peak.
- How long do bear markets last? The duration of bear markets can vary significantly, lasting from a few months to several years, depending on market conditions and external factors.
- Can you profit in a bear market? Yes, traders can profit in bear markets by short selling or investing in safer assets to preserve capital.
- What are some strategies for trading in a bear market? Strategies may include setting stop-loss orders, diversifying investments, and focusing on fundamental analysis to identify undervalued assets.

Technical Analysis Tools
When it comes to navigating the often turbulent waters of cryptocurrency trading, having the right tools at your disposal can make all the difference. are essential for traders who want to make informed decisions based on market data rather than gut feelings. These tools help you analyze price movements, identify trends, and predict future price actions, which is crucial for maximizing profits and minimizing losses.
Among the most popular technical analysis tools are moving averages and Fibonacci retracement levels. Each of these tools serves a unique purpose and can provide valuable insights into market cycles. By understanding how to effectively use these tools, you can enhance your trading strategy and increase your chances of success.
Moving averages are one of the simplest yet most effective technical analysis tools available. They help smooth out price data by creating a constantly updated average price. This smoothing effect allows traders to identify the direction of the trend more easily. For example, a 50-day moving average can help you see whether prices are trending upward or downward over a medium-term period. When the price crosses above the moving average, it can signal a potential buying opportunity, while a cross below might indicate a sell signal.
There are different types of moving averages, including the Simple Moving Average (SMA) and the Exponential Moving Average (EMA). The SMA gives equal weight to all price points in the period, while the EMA gives more weight to recent prices, making it more responsive to new information. Traders often use a combination of both to confirm trends and generate trade signals.
Another powerful tool in a trader's arsenal is the Fibonacci retracement levels. This tool is based on the Fibonacci sequence, a mathematical pattern that appears in various aspects of nature and finance. In trading, Fibonacci levels can help identify potential reversal points in the market. After a significant price movement, whether up or down, traders can use Fibonacci retracement levels to forecast where the price might pull back before continuing in the original direction.
To apply Fibonacci retracement, traders typically draw lines between a high and a low point on a price chart. The key levels—23.6%, 38.2%, 50%, 61.8%, and 100%—act as potential support and resistance zones. Understanding these levels can significantly improve your trading accuracy and risk management, allowing you to make more calculated decisions.
| Tool | Description | Usage |
|---|---|---|
| Moving Averages | Smoothens price data to identify trends | Determine entry and exit points |
| Fibonacci Retracement | Identifies potential reversal points | Improve trading accuracy and risk management |
In conclusion, leveraging technical analysis tools like moving averages and Fibonacci retracement levels can significantly enhance your trading strategy. They provide clarity in the often chaotic crypto market, allowing you to make more informed decisions. Remember, though, that no tool is foolproof; always combine these techniques with sound risk management practices.
- What are market cycles in cryptocurrency? Market cycles refer to the recurring patterns of price movements in the crypto market, including phases of growth and decline.
- How can I identify a bull market? A bull market is characterized by rising prices, increased investor confidence, and strong buying activity.
- What is the importance of using technical analysis? Technical analysis helps traders make informed decisions based on market data, trends, and potential price movements.
- Can I rely solely on technical analysis for trading? While technical analysis is a valuable tool, it’s essential to combine it with fundamental analysis and risk management strategies for the best results.

Using Moving Averages
When it comes to navigating the turbulent waters of crypto trading, moving averages are like your trusty compass. They help traders smooth out the noise of price fluctuations and identify the underlying trend. But what exactly are moving averages, and how can they boost your trading strategy?
At its core, a moving average is a statistical calculation that takes a set of data points and averages them over a specified period. This can be particularly useful in the world of cryptocurrency, where prices can swing wildly in a matter of hours. By using moving averages, traders can filter out the short-term volatility and focus on the overall trend.
There are two main types of moving averages that traders often rely on: the Simple Moving Average (SMA) and the Exponential Moving Average (EMA). The SMA gives equal weight to all price points in the period, making it straightforward but sometimes slow to react to sudden price changes. On the other hand, the EMA gives more weight to recent prices, making it more responsive to new information. Here’s a quick comparison:
| Type of Moving Average | Characteristics | Best Use Case |
|---|---|---|
| Simple Moving Average (SMA) | Equal weight to all data points | Long-term trend identification |
| Exponential Moving Average (EMA) | More weight on recent prices | Short-term trading signals |
So, how do you use these moving averages in your trading strategy? A common approach is to look for crossovers. For example, when a short-term EMA crosses above a long-term SMA, it can signal a potential buying opportunity, indicating that a bullish trend may be starting. Conversely, if the short-term EMA crosses below the long-term SMA, it could signal a bearish trend, suggesting it might be time to sell. This is often referred to as the Golden Cross and Death Cross, respectively.
Additionally, traders often use moving averages to set support and resistance levels. When the price approaches a moving average, it can act as a barrier. If the price bounces off the moving average, it may indicate a continuation of the trend. However, if it breaks through, that could signal a reversal. This dynamic creates a powerful tool for traders looking to refine their entry and exit points.
In conclusion, integrating moving averages into your trading strategy can significantly enhance your ability to analyze market cycles. They provide clarity in the chaos of crypto price movements and can help you make more informed decisions. Just remember, while moving averages are a great tool, they should be used in conjunction with other indicators and analysis methods for the best results.
- What is the best period for moving averages? The best period can vary depending on your trading style. Shorter periods (like 10 or 20 days) are generally used for day trading, while longer periods (like 50 or 200 days) are better for long-term investors.
- Can moving averages predict future prices? While moving averages can help identify trends, they are not foolproof and should be used alongside other analysis tools to make informed trading decisions.
- How often should I check moving averages? This depends on your trading strategy. Day traders might check them multiple times a day, while long-term investors may only review them weekly or monthly.

Fibonacci Retracement Levels
The are a popular tool among traders for identifying potential support and resistance levels in the market. Based on the famous Fibonacci sequence, these levels are derived from the mathematical ratios that occur naturally in various aspects of life, from nature to architecture. In the world of crypto trading, understanding and applying these levels can significantly enhance your trading strategy.
When a cryptocurrency experiences a significant price movement, traders often look for retracement levels to predict where the price might reverse or consolidate. The key Fibonacci levels to watch are 23.6%, 38.2%, 50%, 61.8%, and 100%. Each of these percentages represents a potential reversal point, allowing traders to make informed decisions about when to enter or exit trades.
To illustrate how these levels work, let's consider a hypothetical scenario where Bitcoin rises from $10,000 to $15,000. To find the Fibonacci retracement levels, you would take the difference between these two prices ($5,000) and apply the Fibonacci ratios:
| Fibonacci Level | Price Level |
|---|---|
| 0% | $15,000 |
| 23.6% | $14,180 |
| 38.2% | $13,910 |
| 50% | $12,500 |
| 61.8% | $11,090 |
| 100% | $10,000 |
In this example, if Bitcoin were to retrace to the 61.8% level at $11,090, traders might see this as a buying opportunity, anticipating a potential bounce back up. Conversely, if the price breaks below this level, it could signal further declines, prompting traders to reassess their positions.
Moreover, it's essential to combine Fibonacci retracement levels with other technical analysis tools, such as moving averages or momentum indicators, to create a robust trading strategy. For instance, if a Fibonacci level coincides with a moving average, this confluence can strengthen the case for a potential reversal, providing traders with higher confidence in their decisions.
In summary, Fibonacci retracement levels are not just random numbers; they are powerful tools that can help traders navigate the volatile waters of cryptocurrency trading. By understanding how to apply these levels effectively, traders can improve their accuracy in predicting market movements and enhance their overall trading performance.
- What are Fibonacci retracement levels?
Fibonacci retracement levels are horizontal lines that indicate potential support or resistance levels based on the Fibonacci sequence. They help traders predict where the price might reverse or consolidate.
- How do I calculate Fibonacci retracement levels?
To calculate Fibonacci retracement levels, identify the high and low points of a price movement, then apply the Fibonacci ratios (23.6%, 38.2%, 50%, 61.8%, and 100%) to the price difference.
- Can Fibonacci retracement levels be used in any market?
Yes, Fibonacci retracement levels can be applied in various financial markets, including stocks, forex, and cryptocurrencies, making them a versatile tool for traders.
Frequently Asked Questions
- What are market cycles in crypto trading?
Market cycles refer to the recurring patterns of price movements in cryptocurrency trading. By understanding these cycles, traders can anticipate market behavior and make more informed decisions about when to buy or sell.
- How can I identify bull and bear markets?
Bull markets are characterized by rising prices and increased investor confidence, while bear markets feature declining prices and reduced confidence. Recognizing these signs can help you adapt your trading strategies to the current market conditions.
- What indicators are useful in a bull market?
Momentum indicators like the Relative Strength Index (RSI) are valuable in bull markets. They help you gauge the strength of the market and identify optimal entry points for your trades.
- How does investor psychology affect market cycles?
Investor psychology plays a crucial role in sustaining market cycles. Emotions such as fear and greed can drive market behavior, and understanding these emotions can enhance your trading strategies and risk management.
- What technical analysis tools should I use?
Tools like moving averages and Fibonacci retracement levels are essential for analyzing market cycles. They provide insights into potential price movements and help identify support and resistance levels.
- How do moving averages help in trading?
Moving averages smooth out price data over specific time frames, making it easier to identify trends. They are particularly useful for determining when to enter or exit trades during market cycles.
- What are Fibonacci retracement levels?
Fibonacci retracement levels are horizontal lines that indicate potential reversal points in the market. Understanding how to apply these levels can significantly improve your trading accuracy and risk management.


