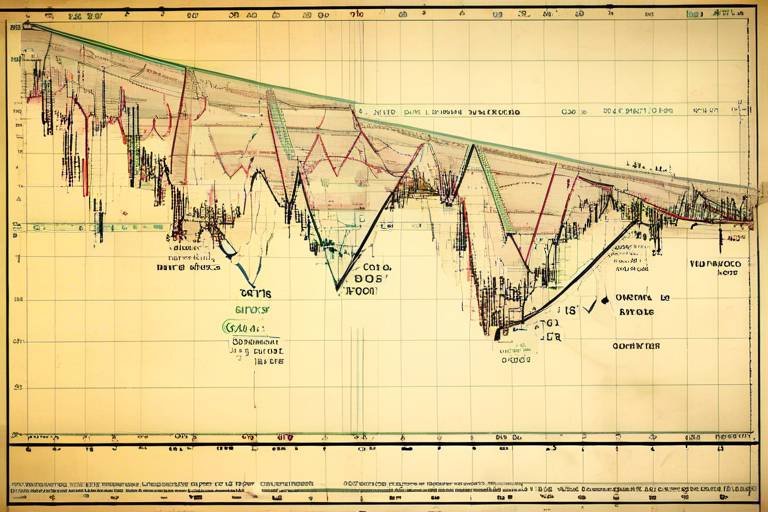
Using the Fibonacci Sequence for Price Predictions
The financial markets can often feel like a chaotic whirlwind, with prices fluctuating in ways that can leave even seasoned traders scratching their heads. But what if there was a way to bring some order to this chaos? Enter the Fibonacci sequence, a mathematical marvel that has found its way into the world of trading, providing insights that can help traders make informed decisions. In this article, we will explore how the Fibonacci sequence can be a game-changer for price predictions, shedding light on its significance and practical applications in the financial markets.
At its core, the Fibonacci sequence is a series of numbers where each number is the sum of the two preceding ones, starting from 0 and 1. This simple yet powerful pattern appears not only in mathematics but also in nature, art, and now, in trading. The beauty of the Fibonacci sequence lies in its ability to reveal potential price levels where market reversals may occur. By understanding and applying these Fibonacci levels, traders can enhance their decision-making process, potentially leading to better trading outcomes.
Imagine standing at the edge of a vast ocean, watching the waves crash against the shore. Each wave represents a price movement, unpredictable and tumultuous. However, just as the tide follows a rhythm, the Fibonacci sequence offers a structured approach to understanding price movements. By identifying key Fibonacci retracement levels, traders can pinpoint areas where prices are likely to reverse or stall, allowing them to navigate the market with greater confidence.
In the following sections, we will delve deeper into the intricacies of the Fibonacci sequence, uncovering its origins, exploring how to identify Fibonacci retracement levels, and discussing its limitations. Whether you're a novice trader or a seasoned pro, understanding the Fibonacci sequence can provide you with a valuable tool for enhancing your trading strategies and improving your overall market analysis.
The Fibonacci sequence, named after the Italian mathematician Leonardo of Pisa, who was known as Fibonacci, has its roots in ancient mathematics. The sequence begins with 0 and 1, and each subsequent number is generated by adding the two previous numbers together. This results in a sequence that looks like this: 0, 1, 1, 2, 3, 5, 8, 13, 21, 34, .... The fascinating aspect of this sequence is its appearance in various aspects of life, from the arrangement of leaves on a stem to the spirals of shells.
In trading, the Fibonacci sequence is particularly useful because it can help traders identify potential levels of support and resistance. These levels are derived from the ratios that are created from the sequence, such as 61.8%, 38.2%, and 23.6%. These ratios are not just arbitrary numbers; they are deeply connected to the natural world and human behavior, which is why they resonate so well in market analysis.
Fibonacci retracement levels are essential tools for traders looking to identify potential reversal points in price movements. By drawing horizontal lines at the Fibonacci levels on a price chart, traders can visualize where the price may retrace before continuing in the original trend. The most commonly used Fibonacci retracement levels are:
- 23.6%
- 38.2%
- 50%
- 61.8%
- 100%
These levels act as psychological barriers for traders, often causing the price to stall or reverse. Understanding how to identify and utilize these levels can significantly enhance a trader's ability to predict price movements effectively.
To effectively use Fibonacci retracement levels, traders should start by identifying a significant price movement, either upward or downward. Once this movement is established, they can draw the Fibonacci retracement levels from the high to the low (or vice versa) of that movement. This process allows traders to pinpoint key levels where price reversals are likely to occur.
Each Fibonacci ratio serves a unique purpose in market analysis:
| Fibonacci Ratio | Significance |
|---|---|
| 23.6% | Minor retracement level, often used for short-term trades. |
| 38.2% | Common level for potential reversals, often seen as a strong support/resistance. |
| 50% | Not a Fibonacci ratio but widely used, indicating a significant retracement. |
| 61.8% | Golden ratio, considered one of the most important levels for traders. |
| 100% | Indicates a complete retracement to the original price level. |
In real trading scenarios, Fibonacci retracement levels can be used in various ways. For instance, a trader may use these levels to set entry points for buying or selling, determine stop-loss levels, or identify potential profit-taking areas. By combining Fibonacci analysis with other technical indicators, traders can create a robust trading strategy that enhances their chances of success.
To elevate the effectiveness of Fibonacci retracement levels, traders often combine them with other technical indicators, such as moving averages, MACD, or RSI. This synergy can provide a more comprehensive view of market conditions, allowing traders to make more informed decisions. For example, if a Fibonacci level aligns with a moving average, it may strengthen the case for a potential reversal at that level.
While the Fibonacci sequence is a powerful tool, it is essential to acknowledge its limitations. Market conditions can change rapidly, and relying solely on Fibonacci levels without considering other factors may lead to misguided decisions. Traders should always remain vigilant and adaptable to the ever-changing landscape of the financial markets.
Market psychology plays a crucial role in trading. The behavior of traders—fear, greed, and sentiment—can significantly influence price movements, often leading to unpredictable outcomes. Therefore, while Fibonacci levels can provide guidance, understanding the psychological factors at play is equally important for successful trading.
Implementing proper risk management strategies is vital when trading with Fibonacci levels. Traders should consider setting stop-loss orders at strategic points, diversifying their portfolios, and only risking a small percentage of their capital on each trade. This approach helps to minimize potential losses while allowing traders to capitalize on the opportunities that Fibonacci analysis presents.
1. What is the Fibonacci sequence?
The Fibonacci sequence is a series of numbers where each number is the sum of the two preceding ones, often used in trading to identify potential reversal levels.
2. How do I use Fibonacci retracement levels?
To use Fibonacci retracement levels, identify a significant price movement and draw horizontal lines at key Fibonacci ratios on the price chart to find potential support and resistance levels.
3. Can Fibonacci levels guarantee price movements?
No, Fibonacci levels are not guarantees; they are tools that can help traders identify potential reversal points, but market conditions and psychology also play significant roles.
4. Should I combine Fibonacci with other indicators?
Yes, combining Fibonacci levels with other technical indicators can enhance your trading strategy and improve the accuracy of your predictions.
5. What are the risks of using Fibonacci analysis?
The main risks include relying solely on Fibonacci levels without considering market conditions and psychology, which can lead to misguided trading decisions.

Understanding the Fibonacci Sequence
The Fibonacci sequence is a fascinating mathematical concept that has captivated both mathematicians and traders alike. It begins with the numbers 0 and 1, and each subsequent number is the sum of the two preceding ones. So, the sequence unfolds like this: 0, 1, 1, 2, 3, 5, 8, 13, 21, and so on. This simple yet profound pattern can be found in various aspects of nature, art, and even financial markets. But what makes it so significant in trading? Let's dig a little deeper.
The origins of the Fibonacci sequence date back to the 13th century, introduced by the Italian mathematician Leonardo of Pisa, who is famously known as Fibonacci. He presented this sequence in his book, Liber Abaci, where he used it to solve problems related to rabbit breeding. The beauty of the Fibonacci sequence lies in its inherent properties, particularly the ratio that emerges as the sequence progresses. For example, as you move further along in the sequence, the ratio of one number to the next approaches the famous Golden Ratio (approximately 1.618). This ratio is not just a mathematical curiosity; it has profound implications in various fields, including finance.
In the world of trading, the Fibonacci sequence is used primarily to identify potential reversal points in price movements. Traders believe that prices often retrace a predictable portion of a move before continuing in the original direction. This is where the Fibonacci retracement levels come into play. By applying the Fibonacci ratios (like 23.6%, 38.2%, 50%, 61.8%, and 100%) to price charts, traders can pinpoint areas where a price might reverse or consolidate. It's like having a roadmap that guides you through the often unpredictable landscape of financial markets.
Moreover, the Fibonacci sequence is not just a standalone tool; it can be combined with other technical analysis methods to enhance its predictive power. For instance, when Fibonacci levels align with other indicators such as moving averages or trend lines, it increases the likelihood of a successful trade. This synergy between different analytical tools creates a robust framework for making informed trading decisions.
In summary, the Fibonacci sequence is much more than a mathematical curiosity; it serves as a vital tool for traders looking to navigate the complexities of financial markets. Its ability to predict potential price movements based on historical data makes it an indispensable part of any trader's toolkit. Understanding the Fibonacci sequence is the first step toward leveraging its power in your trading strategy.

Fibonacci Retracement Levels
The concept of is a cornerstone in the toolkit of many traders. These levels are derived from the Fibonacci sequence and are used to identify potential reversal points in the financial markets. When a price moves significantly in one direction, traders often anticipate a correction or pullback, and Fibonacci retracement levels help pinpoint where this might occur. By understanding these levels, you can make more informed decisions about when to enter or exit trades.
To apply Fibonacci retracement, traders first identify a significant price movement, either a strong upward or downward trend. From there, they use the Fibonacci ratios to calculate potential support and resistance levels. The most common ratios are 23.6%, 38.2%, 50%, 61.8%, and 100%. These percentages are not just arbitrary numbers; they are derived from the Fibonacci sequence, where each number is the sum of the two preceding numbers. This mathematical relationship often reflects human behavior in trading, making these levels particularly significant.
When you plot these levels on a chart, they create horizontal lines that represent potential support and resistance. For instance, if a stock has risen from $100 to $150, the Fibonacci retracement levels would be calculated as follows:
| Retracement Level | Price Level |
|---|---|
| 23.6% | $138.20 |
| 38.2% | $130.90 |
| 50% | $125.00 |
| 61.8% | $119.10 |
| 100% | $100.00 |
As you can see, these levels can provide a framework for predicting where the price might retrace before continuing its original trend. For example, if the price starts to pull back and reaches the 38.2% level, traders might look for signs of a reversal to enter a long position, anticipating that the price will bounce back up. However, it’s crucial to remember that these levels are not foolproof; they should be used in conjunction with other technical analysis tools to confirm signals.
Furthermore, the effectiveness of Fibonacci retracement levels can vary depending on market conditions. In trending markets, these levels tend to hold more significance, while in choppy or sideways markets, they may be less reliable. Traders often combine Fibonacci retracement with other indicators, such as moving averages or momentum indicators, to enhance their trading strategies. This combination can provide a more comprehensive view of market dynamics and improve the accuracy of predictions.
In conclusion, Fibonacci retracement levels are not just numbers on a chart; they are a reflection of market psychology and behavior. By understanding how to identify and utilize these levels, traders can improve their decision-making process and potentially increase their profitability. Remember, practice makes perfect, so take the time to experiment with these levels in a demo account before applying them in the live market.
- What is the Fibonacci sequence? The Fibonacci sequence is a series of numbers where each number is the sum of the two preceding ones, often found in nature and used in various fields, including finance.
- How do I calculate Fibonacci retracement levels? To calculate Fibonacci retracement levels, identify the high and low points of a price movement and apply the Fibonacci ratios to find potential support and resistance levels.
- Are Fibonacci retracement levels always accurate? While Fibonacci levels can provide valuable insights, they are not guaranteed to predict price movements accurately. It's essential to use them alongside other analysis tools.
- Can I use Fibonacci retracement in any market? Yes, Fibonacci retracement can be applied to various markets, including stocks, forex, and cryptocurrencies, but its effectiveness may vary based on market conditions.

Identifying Key Levels
When it comes to trading, identifying key levels on price charts is akin to finding hidden treasure on a treasure map. The Fibonacci sequence provides traders with a unique set of tools to pinpoint these levels, which can significantly enhance decision-making. To effectively utilize Fibonacci in your trading strategy, you need to understand how to apply specific Fibonacci ratios to your charts. These ratios act as a compass, guiding you to potential reversal points where prices may change direction.
First, let’s dive into how you can identify these key levels. The most commonly used Fibonacci ratios include 23.6%, 38.2%, 50%, 61.8%, and 100%. Each of these ratios represents a potential area of support or resistance. For instance, if a stock is retracing after a significant upward movement, you might find that it stalls at one of these Fibonacci levels. This is where the magic happens: traders can use these levels to make educated guesses about future price movements.
To put this into perspective, imagine you’re standing on a beach, watching the waves come in and out. Each wave represents a price movement, and the Fibonacci levels are like the sandbars beneath the water, guiding where the waves will break. If you can accurately identify these levels, you can better predict where the price might bounce back or break through. But how do you actually draw these levels on your charts?
Here’s a simple guide to help you get started:
- Identify the most recent significant price movement—this could be a peak or a trough.
- Measure the distance between this high and low point.
- Apply the Fibonacci retracement tool, which will automatically calculate the key levels based on the ratios mentioned earlier.
Once you have these levels marked on your chart, it’s essential to watch how the price interacts with them. Does it bounce off a level, indicating support? Or does it break through, suggesting a potential trend reversal? Monitoring these interactions can provide invaluable insights into market behavior.
In addition to simply identifying these levels, it's crucial to combine them with other indicators for even more robust analysis. For instance, if a price approaches a Fibonacci level and you also see a moving average converging at that point, it could reinforce the idea that this level will hold as support or resistance. The synergy between Fibonacci levels and other technical indicators can create a more comprehensive trading strategy.
Ultimately, identifying key levels using Fibonacci retracement is not just about drawing lines on a chart; it's about understanding the market's psychology and using that knowledge to your advantage. Just like a skilled detective piecing together clues, you can uncover patterns that lead to better trading decisions.

Common Ratios Explained
The Fibonacci sequence is not just a mathematical curiosity; it is a powerful tool in the world of trading, particularly when it comes to identifying potential reversal points in price movements. The most commonly used Fibonacci ratios are 23.6%, 38.2%, 50%, 61.8%, and 100%. Each of these ratios has its own significance, and understanding them can greatly enhance a trader's decision-making process.
The 23.6% level is often considered the first point of interest for traders. It represents a shallow retracement, indicating that the price may not be ready to reverse significantly. Instead, it suggests a minor pullback, which can be an excellent opportunity for traders looking to enter a position before the price resumes its trend.
Next, we have the 38.2% level. This ratio is more significant than the 23.6% level and often serves as a stronger support or resistance point. When prices reach this level, traders start to pay closer attention, as it can indicate a potential reversal. If the price bounces back from this level, it may validate the existing trend, while a break below could signal a deeper correction.
The 50% retracement level, although not derived from the Fibonacci sequence itself, is widely accepted among traders as a psychological level. It represents a halfway point in a price movement, and traders often look at it as a potential pivot point. If the price holds at this level, it can suggest that the market is still bullish or bearish, depending on the direction of the trend prior to the retracement.
Moving on, we reach the 61.8% level, often referred to as the "golden ratio." This is one of the most crucial levels in Fibonacci analysis. Historically, it has demonstrated a high level of reliability in predicting reversals. When the price approaches this level, it is often met with significant buying or selling pressure, making it a critical point for traders to watch.
Finally, the 100% level indicates a complete retracement of the prior price movement. While it does not typically serve as a reversal point, it is important for traders to recognize that a price reaching this level means the previous trend has been completely negated. Understanding these levels allows traders to make informed decisions about entering or exiting trades.
In summary, the Fibonacci ratios provide a framework for traders to analyze price movements and identify potential reversal points. By integrating these ratios into their trading strategies, traders can make more informed decisions and increase their chances of success in the market.
- What is the Fibonacci sequence?
The Fibonacci sequence is a series of numbers where each number is the sum of the two preceding ones, often found in nature and used in financial markets for analysis. - How do I use Fibonacci retracement levels?
To use Fibonacci retracement levels, identify a significant price movement, then apply the Fibonacci tool to find the key levels where price may reverse. - Are Fibonacci levels always accurate?
While Fibonacci levels can provide valuable insights, they are not foolproof and should be used in conjunction with other analysis techniques. - Can I combine Fibonacci with other indicators?
Absolutely! Many traders find success by combining Fibonacci levels with other technical indicators to enhance their trading strategies.
Practical Applications
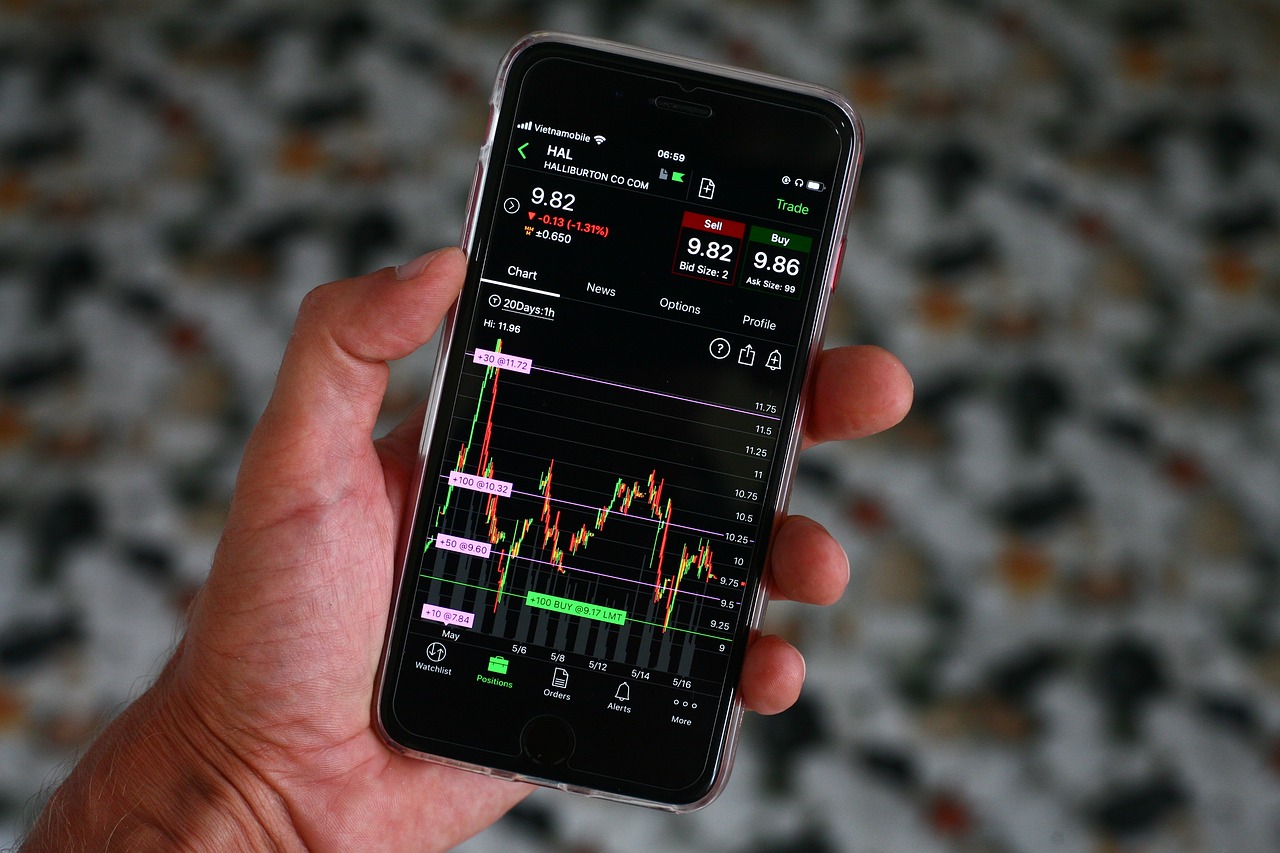
When it comes to the practical applications of the Fibonacci sequence in trading, the possibilities are as vast as the ocean. Traders often find themselves navigating through the tumultuous waters of financial markets, and Fibonacci retracement levels serve as a reliable compass. By identifying these levels, traders can pinpoint potential reversal points, enabling them to make informed decisions and optimize their entry and exit strategies.
One of the most effective ways to use Fibonacci retracement levels is during a trending market. For instance, if a stock has been on a bullish run, a trader may choose to pull back and wait for a retracement to one of the Fibonacci levels—like 38.2% or 61.8%—before re-entering the market. This approach can help traders avoid buying at the peak and instead capitalize on a more favorable price point. Imagine trying to catch a wave while surfing; you wouldn't want to dive in at the crest, but rather at the sweet spot where you can ride it back up.
Additionally, the Fibonacci levels can be used in conjunction with other technical indicators to bolster trading strategies. For example, a trader might combine Fibonacci retracement levels with moving averages or momentum indicators. When these tools align at a Fibonacci level, it creates a confluence zone, increasing the probability of a successful trade. Picture it like a perfect storm; when different elements come together harmoniously, the result can be a powerful trading opportunity.
Moreover, Fibonacci levels can also play a crucial role in setting stop-loss orders. By placing stops just below a significant Fibonacci level, traders can minimize their risk while allowing enough room for the price to fluctuate. This strategy not only protects investments but also instills a sense of discipline—an essential trait for any trader. It's like having a safety net; you know you're covered if things don't go as planned.
In real-world trading scenarios, Fibonacci retracement levels have proven their worth time and again. For instance, during the 2020 stock market crash, savvy traders who utilized Fibonacci levels were able to identify key support and resistance points, allowing them to make strategic buys during the lows and sell during the recoveries. This ability to read the market's pulse can be the difference between a successful trading day and a regrettable one.
In summary, the practical applications of Fibonacci retracement levels are not just theoretical; they are grounded in real-world trading practices. By understanding how to effectively apply these levels, traders can enhance their decision-making processes, mitigate risks, and ultimately improve their overall trading performance.
- What is the Fibonacci sequence? The Fibonacci sequence is a series of numbers where each number is the sum of the two preceding ones, often used in various fields, including finance.
- How do I identify Fibonacci retracement levels? You can identify Fibonacci retracement levels by selecting a significant price movement on a chart and applying the Fibonacci tool, which will automatically generate the key levels.
- Can Fibonacci levels guarantee successful trades? No, while Fibonacci levels can provide valuable insights, they do not guarantee success. They should be used in conjunction with other analysis tools and risk management strategies.
- What are the most common Fibonacci ratios? The most commonly used Fibonacci ratios include 23.6%, 38.2%, 50%, 61.8%, and 100%.
- How can I combine Fibonacci with other indicators? You can combine Fibonacci levels with other indicators like moving averages, RSI, or MACD to create a more robust trading strategy.
Combining Fibonacci with Other Indicators
When it comes to trading, relying solely on one tool can sometimes feel like trying to navigate a ship through a storm without a compass. That's where the magic of combining Fibonacci with other technical indicators comes into play. By integrating Fibonacci retracement levels with various indicators, traders can significantly enhance their decision-making process and improve the accuracy of their predictions.
To start, let’s consider how Fibonacci levels can work in harmony with moving averages. For instance, when a price retraces to a Fibonacci level and simultaneously crosses a moving average, this could signal a strong reversal point. Imagine you’re standing at a crossroads: the Fibonacci level acts as a signpost, while the moving average provides the traffic light. When both signals align, it’s time to make a move!
Another powerful combination involves the use of Relative Strength Index (RSI). The RSI helps traders identify overbought or oversold conditions in the market. When the RSI indicates that an asset is oversold at a Fibonacci retracement level, it could be a strong indication to enter a buy position. Conversely, if the RSI shows an overbought condition at a Fibonacci level, it might be wise to consider selling. This synergy creates a multifaceted approach, allowing traders to make more informed decisions.
Additionally, candlestick patterns can provide valuable insights when used alongside Fibonacci levels. For example, if a bullish engulfing pattern appears at a key Fibonacci retracement level, it could reinforce the idea of a potential upward movement. The combination of these two elements can serve as a robust confirmation signal, enhancing the trader's confidence in their strategy.
Moreover, integrating Fibonacci with volume indicators can also yield impressive results. High trading volume at a Fibonacci level can indicate strong interest from other traders, suggesting that the price may indeed reverse at that point. It’s like having a crowd cheering you on as you make your trades—when the volume is high, the likelihood of a significant price movement increases.
In summary, combining Fibonacci retracement levels with other technical indicators not only enriches your trading strategy but also provides a clearer picture of market dynamics. It’s essential to remember that no single indicator is foolproof, but by layering these tools, you create a more comprehensive trading strategy that can adapt to various market conditions.
- What is the Fibonacci sequence? The Fibonacci sequence is a series of numbers where each number is the sum of the two preceding ones, often found in nature and used in financial markets for price predictions.
- How do Fibonacci retracement levels work? Fibonacci retracement levels are horizontal lines that indicate potential support or resistance levels based on the Fibonacci sequence, helping traders identify possible reversal points in price movements.
- Can Fibonacci be used in all markets? Yes, Fibonacci retracement levels can be applied across various financial markets, including stocks, forex, and cryptocurrencies.
- What are the most common Fibonacci ratios? The most commonly used Fibonacci ratios are 23.6%, 38.2%, 50%, 61.8%, and 100%.
- How can I improve my trading strategy using Fibonacci? Combine Fibonacci levels with other technical indicators like moving averages, RSI, candlestick patterns, and volume indicators to enhance your trading decisions.

Limitations of Fibonacci Predictions
While the Fibonacci sequence is celebrated for its intriguing mathematical properties and its applications in price predictions, it is essential to recognize that it is not a crystal ball for forecasting market movements. Just like a compass that points north but doesn’t guarantee a straight path, Fibonacci levels can guide traders, but they don’t always lead to profitable outcomes. One of the primary limitations is that the market is influenced by numerous unpredictable factors that can overshadow Fibonacci signals.
For instance, economic news releases, geopolitical events, and sudden market sentiment shifts can dramatically alter price trajectories, rendering Fibonacci predictions less reliable. It's crucial to remember that Fibonacci levels are based on historical price movements, and past performance is not always indicative of future results. Thus, traders should not rely solely on Fibonacci retracement levels as their only decision-making tool.
Moreover, the interpretation of Fibonacci levels can be somewhat subjective. Different traders might draw Fibonacci retracement lines in varying ways, leading to different conclusions about potential support and resistance levels. This subjectivity can create confusion, especially in highly volatile markets where price action can deviate sharply from expected patterns.
Another significant limitation is the psychological aspect of trading. Market psychology plays a pivotal role in price movements, and traders’ emotions can lead to irrational decisions that defy Fibonacci predictions. For example, if a trader is overly optimistic or pessimistic, they might ignore Fibonacci signals altogether or misinterpret them, leading to losses. Understanding market psychology is crucial, as it can heavily influence price movements and the effectiveness of Fibonacci analysis.
Additionally, Fibonacci levels are often used in conjunction with other technical indicators. While this can enhance the reliability of predictions, it can also complicate analysis. Traders may find themselves overwhelmed by conflicting signals from different indicators, making it difficult to make informed decisions. Therefore, combining Fibonacci with other indicators requires careful consideration and a clear understanding of how these tools interact.
Lastly, risk management is an essential aspect of trading that cannot be overlooked. Without proper risk management strategies, traders may expose themselves to significant losses, regardless of how accurate their Fibonacci predictions may seem. Implementing stop-loss orders and position sizing is crucial to safeguard investments and manage risks effectively. As such, traders should view Fibonacci analysis as one component of a broader trading strategy, rather than a standalone solution.
In summary, while Fibonacci predictions can provide valuable insights, they are not foolproof. Traders must be aware of the limitations and incorporate a holistic approach to their trading strategies. By understanding the potential pitfalls and combining Fibonacci analysis with sound risk management and market psychology awareness, traders can enhance their decision-making process and navigate the complexities of the financial markets more effectively.
- What is the Fibonacci sequence? The Fibonacci sequence is a series of numbers where each number is the sum of the two preceding ones, often found in nature and used in various fields, including finance.
- How do Fibonacci retracement levels work? Fibonacci retracement levels are horizontal lines that indicate potential support and resistance levels based on the Fibonacci sequence, helping traders identify possible reversal points in price movements.
- Are Fibonacci levels reliable for trading? While Fibonacci levels can provide insights into potential price movements, they should not be solely relied upon. Traders should consider other factors and use them in conjunction with additional technical indicators.
- What are common Fibonacci ratios? The most commonly used Fibonacci ratios include 23.6%, 38.2%, 50%, 61.8%, and 100%, which are derived from the Fibonacci sequence and are used to identify potential reversal levels.
- How can I improve my trading strategy with Fibonacci? To improve your trading strategy with Fibonacci, combine it with other technical indicators, understand market psychology, and implement effective risk management techniques.
Market Psychology Factors
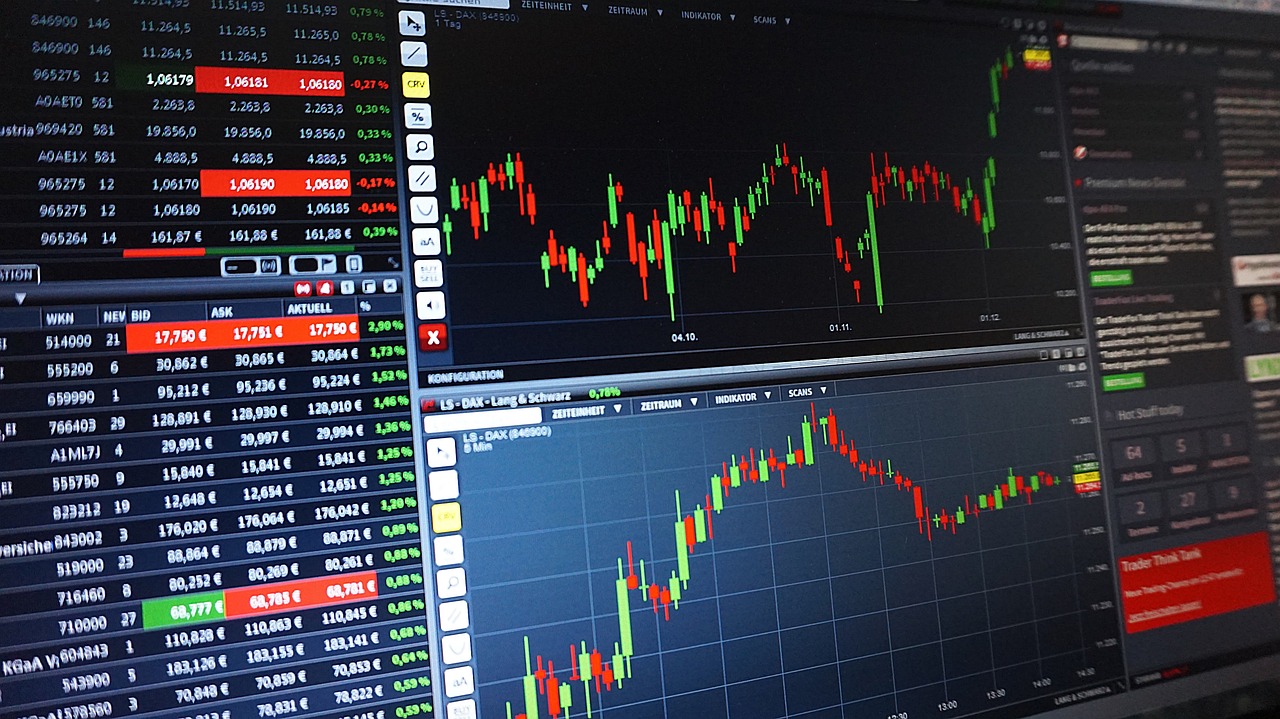
The world of trading is not just about numbers and charts; it's also about the human element. Market psychology plays a pivotal role in how prices move and how traders react to those movements. Understanding this psychological aspect can significantly enhance your trading strategy. Think of it this way: trading is like a game of chess, where every move is influenced not only by the rules of the game but also by the mindset of the players involved.
One of the key psychological factors is fear and greed. These emotions often drive market trends, leading to irrational behavior. For instance, during a bull market, traders might become overly optimistic, pushing prices to unsustainable levels, while in a bear market, fear can cause panic selling. This emotional rollercoaster can create opportunities for savvy traders who can remain calm and make decisions based on analysis rather than emotion.
Another important concept is the bandwagon effect, where traders tend to follow the crowd. When a stock begins to rise, many traders jump on board, thinking, "If everyone else is buying, it must be a good idea." This can lead to price bubbles, where the price is driven up far beyond its intrinsic value. Conversely, during downturns, the same effect can lead to a mass exodus, further driving prices down. Recognizing this pattern can help traders anticipate potential reversals.
Additionally, the concept of confirmation bias can significantly affect trading decisions. Traders often seek out information that confirms their existing beliefs while ignoring data that contradicts them. This bias can lead to poor decision-making and missed opportunities. To combat this, it's essential to remain open-minded and consider all available information, even if it challenges your current viewpoint.
Moreover, the fear of missing out (FOMO) can push traders into making hasty decisions. When they see others profiting from a particular stock or trend, they might jump in without proper analysis, only to face losses later. It’s crucial to develop a disciplined approach to trading, where decisions are based on solid strategies rather than emotional impulses.
To help illustrate these psychological factors, consider the following table that summarizes key aspects:
| Psychological Factor | Description | Impact on Trading |
|---|---|---|
| Fear and Greed | Emotions driving irrational behavior | Can lead to price bubbles or crashes |
| Bandwagon Effect | Following the crowd in trading decisions | Can create market trends and reversals |
| Confirmation Bias | Seeking information that confirms beliefs | Can lead to poor decision-making |
| Fear of Missing Out (FOMO) | Rushing into trades to avoid missing profits | Can result in hasty decisions and losses |
In conclusion, understanding market psychology is essential for traders looking to navigate the complexities of the financial markets. By recognizing the emotional drivers behind price movements, traders can make more informed decisions and potentially improve their trading outcomes. Just like a skilled chess player anticipates the opponent's moves, a successful trader anticipates market psychology and adjusts their strategy accordingly.
- What is market psychology in trading? Market psychology refers to the emotions and mental state of traders that influence their trading decisions and market movements.
- How can I manage my emotions while trading? Developing a disciplined trading plan, setting clear goals, and practicing mindfulness can help manage emotions effectively.
- Why is understanding psychological factors important in trading? Recognizing psychological factors can help traders make better decisions, avoid common pitfalls, and enhance their overall trading strategy.

Risk Management Strategies
When it comes to trading with Fibonacci levels, having a solid risk management strategy is not just important; it's absolutely essential. Think of it like wearing a seatbelt in a car – you might feel safe driving, but you never know when you might hit a bump in the road. In the world of trading, those bumps can come in the form of unexpected market movements or sudden price reversals. So, how can traders effectively manage their risks while utilizing Fibonacci analysis?
First and foremost, one of the most effective risk management strategies is to set stop-loss orders. These are predetermined price levels where a trader will exit a position to prevent further losses. By placing a stop-loss order just below a significant Fibonacci retracement level, traders can protect themselves from unexpected downturns. For instance, if a trader identifies a 61.8% retracement level as a support zone, they might set their stop-loss just below this level. This way, if the price breaks through that support, they minimize their losses.
Another crucial aspect is position sizing. This involves determining how much capital to risk on a single trade. A common rule of thumb is to risk only a small percentage of your trading capital on any given trade, typically around 1-2%. This means that if a trade goes against you, the loss won't significantly impact your overall portfolio. By using Fibonacci levels to determine entry points and potential exit points, traders can calculate their position size accordingly, ensuring they stay within their risk tolerance.
Furthermore, it’s important to consider the reward-to-risk ratio. This ratio helps traders evaluate whether a potential trade is worth the risk. Ideally, traders should aim for a reward-to-risk ratio of at least 2:1. This means that for every dollar risked, there should be a potential reward of two dollars. By analyzing Fibonacci levels, traders can identify potential price targets that align with this ratio, enhancing their decision-making process.
Lastly, maintaining a trading journal can be a game-changer. Documenting each trade, including the rationale behind entering and exiting positions based on Fibonacci levels, helps traders reflect on their strategies. Over time, this practice can reveal patterns and insights that improve future trading decisions. It’s like keeping a diary of your trading journey, allowing you to learn from both successes and mistakes.
In summary, implementing effective risk management strategies while trading with Fibonacci levels can dramatically enhance a trader's success. By using stop-loss orders, practicing disciplined position sizing, evaluating the reward-to-risk ratio, and maintaining a trading journal, traders can navigate the financial markets with greater confidence and resilience.
- What is the Fibonacci sequence?
The Fibonacci sequence is a series of numbers where each number is the sum of the two preceding ones, often found in nature and used in various fields, including finance. - How do I use Fibonacci retracement levels?
Fibonacci retracement levels can be used to identify potential reversal points in price movements by plotting key ratios on a price chart. - What are the common Fibonacci ratios?
The most commonly used Fibonacci ratios include 23.6%, 38.2%, 50%, 61.8%, and 100%. - Can Fibonacci levels guarantee success in trading?
While Fibonacci levels can provide valuable insights, they do not guarantee success. Traders should combine them with other analysis methods and proper risk management strategies.
Frequently Asked Questions
- What is the Fibonacci sequence and why is it important in trading?
The Fibonacci sequence is a series of numbers where each number is the sum of the two preceding ones. In trading, this sequence is significant because it helps traders identify potential reversal points in price movements, allowing for better decision-making.
- How do I identify Fibonacci retracement levels?
To identify Fibonacci retracement levels, you first need to determine the high and low points of a price movement. From there, you can apply the key Fibonacci ratios (like 23.6%, 38.2%, 50%, 61.8%, and 100%) to find potential support and resistance levels on the price chart.
- Can Fibonacci levels be combined with other indicators?
Absolutely! Combining Fibonacci levels with other technical indicators, such as moving averages or RSI, can enhance your trading strategies. This synergy can improve the accuracy of your predictions and help you make more informed decisions.
- What are the common misconceptions about using Fibonacci in trading?
One common misconception is that Fibonacci levels will always predict market movements accurately. While they are powerful tools, they should be used in conjunction with other analysis methods and not relied upon solely for trading decisions.
- How can market psychology affect Fibonacci predictions?
Market psychology plays a crucial role in trading. Traders' emotions and behaviors can lead to price movements that may not align with Fibonacci predictions. Understanding these psychological factors is essential for interpreting market trends effectively.
- What risk management strategies should I consider when using Fibonacci?
Implementing proper risk management strategies is key when trading with Fibonacci levels. This includes setting stop-loss orders, diversifying your portfolio, and only risking a small percentage of your capital on any single trade to protect your investments.


