Understanding Candlestick Patterns for Crypto Trading
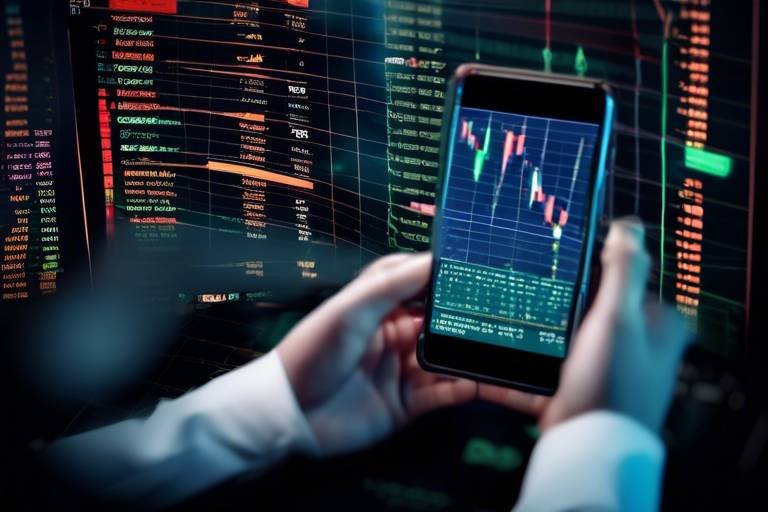
In the fast-paced world of cryptocurrency trading, having the right tools to interpret market movements is crucial. One such tool that stands out is candlestick patterns. These patterns are not just random shapes on a chart; they are visual representations of price action that provide valuable insights into market sentiment. By understanding how these patterns form and what they signify, traders can make informed decisions, potentially increasing their chances of success in this volatile market.
Imagine walking into a crowded room filled with people, each expressing their emotions through body language. Candlestick patterns serve a similar purpose in trading—they reveal the emotional state of the market. When you see a bullish pattern, it's like witnessing a surge of optimism among the crowd; conversely, a bearish pattern signals a wave of pessimism. This emotional insight is what makes candlestick patterns a vital part of any trader's toolkit.
Additionally, the beauty of candlestick patterns lies in their diversity. From single candlestick formations, like dojis and hammers, to complex multiple candlestick patterns such as engulfing and harami, each pattern tells a unique story. By learning to recognize these patterns, traders can gain a deeper understanding of market dynamics, allowing them to anticipate potential price movements.
But how do we interpret these patterns effectively? It’s all about context. A single candlestick pattern might not reveal much on its own, but when placed within the broader context of other candles and market conditions, it can provide powerful signals. For instance, a doji appearing after a strong trend can indicate a potential reversal, while a hammer following a downtrend might suggest that buyers are stepping in. The key is to combine these insights with other technical indicators to create a robust trading strategy.
Moreover, traders should be aware of common pitfalls when interpreting candlestick patterns. It’s easy to get caught up in the excitement of a potential trade and overlook the bigger picture. Ignoring the surrounding market conditions or failing to wait for confirmation signals can lead to poor trading decisions. Therefore, maintaining a disciplined approach is essential.
In conclusion, mastering candlestick patterns is not just about learning to recognize shapes; it’s about understanding the emotions and market psychology behind those shapes. As you delve deeper into the world of crypto trading, remember that these patterns are your guides, helping you navigate through the chaos. By leveraging the insights gained from candlestick patterns, you can enhance your trading strategies and improve your chances of success in this ever-changing landscape.
- What are candlestick patterns? Candlestick patterns are graphical representations of price movements that help traders understand market sentiment and predict future price movements.
- How do I identify a bullish candlestick pattern? Bullish patterns often appear after a downtrend and indicate potential price increases, such as the hammer or engulfing patterns.
- Can I rely solely on candlestick patterns for trading? While candlestick patterns are valuable, they should be used in conjunction with other technical indicators and market analysis for a more comprehensive trading strategy.
- What is the significance of confirmation signals? Confirmation signals help validate candlestick patterns, reducing the risk of false signals and improving the accuracy of trading decisions.
What are Candlestick Patterns?
Candlestick patterns are more than just a collection of colorful shapes on a chart; they are visual representations of price movements in financial markets, particularly in the world of cryptocurrency trading. Each candlestick provides vital information about the market's behavior within a specific time frame, capturing the opening, closing, high, and low prices. The beauty of these patterns lies in their ability to convey market sentiment—the emotional state of traders at any given moment. Are they feeling bullish and optimistic, or bearish and fearful? Understanding this sentiment can give traders a significant edge in predicting future price movements.
Essentially, a candlestick is like a snapshot of market activity. Imagine you’re peering into a bustling café; each customer represents a trade, and the overall atmosphere reflects the collective mood of the patrons. Just as you can gauge whether the café is lively or subdued, traders can ascertain market conditions by analyzing candlestick patterns. These patterns can indicate whether a trend is likely to continue or reverse, making them indispensable tools for anyone looking to navigate the often turbulent waters of the crypto market.
To grasp the significance of candlestick patterns, it's crucial to understand their components. Each candlestick consists of a body and wicks (or shadows). The body represents the opening and closing prices, while the wicks illustrate the highest and lowest prices during that time frame. For instance, a long body suggests strong buying or selling pressure, while a short body indicates indecision among traders. This interplay of forces creates a rich tapestry of information, allowing traders to make informed decisions.
Moreover, candlestick patterns can be categorized into two main types: single candlestick patterns and multiple candlestick patterns. Single candlestick patterns, like the doji or hammer, convey specific market signals that can indicate potential reversals or continuations. On the other hand, multiple candlestick patterns, such as engulfing patterns or harami, provide deeper insights by combining several candles to reveal stronger signals. Understanding these patterns is akin to learning a new language—once you become fluent, you can communicate effectively in the fast-paced world of crypto trading.
In summary, candlestick patterns serve as critical indicators of market sentiment and price movements. By studying these patterns, traders can gain valuable insights into the psychology of the market, enabling them to make more informed trading decisions. So, the next time you glance at a chart, remember that behind those candlesticks lies a story waiting to be told.

Types of Candlestick Patterns
Candlestick patterns are the heart and soul of technical analysis in cryptocurrency trading. They serve as visual cues that help traders understand market sentiment and predict potential price movements. Each pattern tells a story, reflecting the battle between buyers and sellers. By recognizing these patterns, traders can position themselves advantageously in the fast-paced crypto market.
There are two primary categories of candlestick patterns: single candlestick patterns and multiple candlestick patterns. Each type has its unique characteristics and implications for traders.
Single candlestick patterns are the simplest forms of candlestick analysis. They consist of just one candle and convey powerful signals about market sentiment. Some notable single candlestick patterns include:
- Doji: Represents indecision in the market, where the opening and closing prices are nearly equal. This pattern often indicates a potential reversal or consolidation.
- Hammer: Appears after a downtrend and signals a potential bullish reversal. Its small body and long lower shadow indicate buying pressure emerging in the market.
- Shooting Star: Found at the top of an uptrend, it suggests a potential bearish reversal. The small body and long upper shadow indicate selling pressure.
Recognizing these patterns can help traders identify potential reversals or continuations in price trends, allowing them to make informed decisions.
On the other hand, multiple candlestick patterns consist of two or more candles that provide deeper insights into market trends. These patterns are often more reliable than single candlestick patterns because they reflect a more comprehensive view of market behavior. Some common multiple candlestick patterns include:
- Engulfing Pattern: This pattern occurs when a smaller candle is followed by a larger candle that completely engulfs the previous one. A bullish engulfing pattern suggests a potential upward reversal, while a bearish engulfing pattern indicates a possible downward reversal.
- Harami Pattern: The harami pattern consists of two candles, where the second candle is contained within the body of the first. A bullish harami indicates a potential reversal from a downtrend, while a bearish harami suggests a reversal from an uptrend.
- Evening Star: This three-candle pattern appears at the top of an uptrend and signals a potential bearish reversal. The first candle is bullish, followed by a small-bodied candle, and then a bearish candle that closes below the midpoint of the first candle.
Understanding these patterns is crucial for traders looking to navigate the volatile crypto market. By analyzing the formation and context of these patterns, traders can gain valuable insights into potential price movements and market sentiment.

Single Candlestick Patterns
When it comes to understanding the intricacies of crypto trading, are like the breadcrumbs that lead you to a treasure trove of insights. These patterns are formed by a single candlestick and can convey powerful signals about market sentiment. Recognizing these patterns can be a game-changer for traders, as they often indicate potential reversals or continuations in price trends. Let's delve deeper into some of the most significant single candlestick patterns that every trader should be aware of.
One of the most notable single candlestick patterns is the doji. A doji occurs when the opening and closing prices of a candlestick are nearly equal, creating a small body. This pattern suggests indecision in the market, where buyers and sellers are at a stalemate. Traders often interpret a doji as a signal to reassess their positions, especially if it appears after a strong trend. For instance, if a doji forms after a bullish trend, it may indicate that the momentum is waning, potentially leading to a reversal. Conversely, if it appears after a bearish trend, it could signal a possible bullish reversal. The key takeaway here is that dojis prompt traders to pause and consider the market's next move.
Another essential pattern to recognize is the hammer candlestick. This pattern typically appears after a downtrend and is characterized by a small body at the top of the candlestick with a long lower shadow. The hammer signifies that despite selling pressure, buyers stepped in to push the price back up, indicating a potential bullish reversal. Traders often look for confirmation in subsequent candlesticks before making a decision. The hammer is like a phoenix rising from the ashes, suggesting that a new bullish trend could be on the horizon.
It's vital to note that while single candlestick patterns can provide valuable insights, they should not be used in isolation. To enhance their effectiveness, traders should consider the context in which these patterns appear. For example, a doji in a strong uptrend may hold different implications than one in a downtrend. Additionally, combining these patterns with other technical indicators can lead to a more comprehensive analysis. This approach allows traders to make informed decisions and navigate the often volatile waters of the crypto market with greater confidence.
In summary, single candlestick patterns are essential tools in a trader's arsenal. By understanding dojis, hammers, and other similar patterns, traders can gain insights into market sentiment and potential price movements. However, always remember that context is key, and combining these patterns with other technical analysis tools can significantly enhance your trading strategy.
- What is a doji candlestick? A doji candlestick indicates indecision in the market, where the opening and closing prices are nearly equal, suggesting a potential reversal or consolidation.
- What does a hammer candlestick signify? A hammer candlestick appears after a downtrend and signals a potential bullish reversal, indicating that buying pressure is emerging in the market.
- How can I use single candlestick patterns in my trading strategy? Single candlestick patterns can be used to identify potential market reversals or continuations. Combine them with other technical indicators for a more robust trading strategy.

Doji Candlestick
The is a unique formation that signals a moment of indecision in the market. It occurs when the opening and closing prices of a given trading period are nearly equal, resulting in a candlestick with a very small body. This pattern can appear in various forms, including the standard doji, long-legged doji, and gravestone doji, each carrying its own implications for traders. The essence of the doji is its ability to reflect the balance between buying and selling pressures, making it a crucial indicator for traders looking to gauge market sentiment.
When you spot a doji, it's essential to consider the context in which it appears. For example, if a doji forms after a strong uptrend, it may indicate that the buying momentum is fading, suggesting a potential reversal or at least a consolidation phase. Conversely, if it appears after a downtrend, it could signify that selling pressure is weakening, hinting at a possible bullish reversal. This duality makes the doji an invaluable tool for traders, as it encourages them to pause and reassess their positions.
To enhance your understanding, let's break down the different types of doji candlesticks:
- Standard Doji: Characterized by its small body and long wicks, indicating equal buying and selling pressure.
- Long-Legged Doji: Features long upper and lower shadows, suggesting significant price movement but ultimately closing near the opening price. This emphasizes the indecision in the market.
- Gravestone Doji: Appears at the top of an uptrend, with a long upper shadow and little to no lower shadow, indicating a potential bearish reversal.
Understanding the doji's implications can significantly improve your trading strategy. However, it's crucial to wait for confirmation from subsequent candlestick patterns or other technical indicators before making any trading decisions. For instance, if a doji is followed by a bearish candle, it could reinforce the idea of a reversal, prompting traders to consider exiting long positions or even opening short ones. On the other hand, if a bullish candle follows a doji, it may signal the continuation of an upward trend.
In summary, the doji candlestick is a powerful indicator of market indecision. By recognizing and interpreting this pattern effectively, traders can enhance their ability to make informed decisions in the ever-changing landscape of cryptocurrency trading.
What does a doji candlestick indicate?
A doji candlestick indicates indecision in the market, where the opening and closing prices are nearly equal. It suggests that neither buyers nor sellers have gained control, which may lead to a potential reversal or consolidation.
Are there different types of doji candlesticks?
Yes, there are several types of doji candlesticks, including the standard doji, long-legged doji, and gravestone doji. Each type conveys different market sentiments and potential future price movements.
How should traders use doji candlesticks?
Traders should use doji candlesticks in conjunction with other technical indicators and patterns for confirmation before making trading decisions. Observing the context in which a doji appears is crucial for interpreting its significance accurately.

Hammer Candlestick
The is one of the most recognizable patterns in the world of trading, especially in the volatile realm of cryptocurrency. It typically appears after a downtrend, serving as a beacon of hope for traders looking for signs of a potential bullish reversal. Picture this: the market has been on a downward spiral, and suddenly, a hammer forms. This distinctive candlestick has a small body located at the top of the trading range with a long lower shadow. It’s like a phoenix rising from the ashes, signaling that buyers are stepping in, pushing prices up from the lows.
What makes the hammer so significant? The long lower shadow indicates that sellers pushed prices down during the trading session, but buyers quickly stepped in, driving the price back up close to the opening level. This battle between buyers and sellers creates a visual representation of market indecision, but in the case of the hammer, it leans toward a bullish sentiment. Traders often interpret this pattern as a sign to consider entering a long position, especially if it is confirmed by subsequent price action.
When analyzing a hammer, it's essential to consider the context in which it appears. For instance, if the hammer forms after a prolonged downtrend, it carries more weight than if it appears in a sideways market. Additionally, the longer the lower shadow relative to the body, the more potent the signal. Here’s a quick overview of the key characteristics of a hammer candlestick:
| Characteristic | Description |
|---|---|
| Body Size | Small, located at the upper end of the trading range |
| Lower Shadow | Long, at least twice the length of the body |
| Upper Shadow | Very short or nonexistent |
| Market Context | Typically appears after a downtrend |
Incorporating the hammer into your trading strategy can be a game changer. However, it’s crucial to wait for confirmation. A subsequent bullish candle following the hammer can provide the validation needed before making any trading decisions. Keep in mind that while the hammer is a powerful pattern, it should not be used in isolation. Always consider other factors like overall market conditions, volume, and additional technical indicators to enhance your analysis.
In conclusion, the hammer candlestick is not just a pattern; it's a story of resilience and potential change in market dynamics. By understanding its formation and implications, traders can better navigate the unpredictable waters of cryptocurrency trading.

Multiple Candlestick Patterns
When diving deeper into the world of candlestick patterns, you’ll discover that some patterns are more complex and provide richer insights than single candlestick formations. consist of two or more candles that work together to give traders a clearer picture of market sentiment and potential price movements. These patterns can signal strong reversals or continuations, making them invaluable in the volatile realm of cryptocurrency trading.
Among the most recognized multiple candlestick patterns are the Engulfing Pattern and the Harami Pattern. Each of these patterns tells a unique story about the market's dynamics. For instance, the engulfing pattern occurs when a larger candle completely engulfs the previous candle, indicating a potential reversal. On the flip side, the harami pattern, which consists of a small candle nestled within the body of a larger candle, suggests a pause in the current trend and can signal a reversal as well.
Understanding these patterns requires more than just recognition; it involves interpreting their implications in the context of the broader market. For example, a bullish engulfing pattern appearing after a downtrend can be a powerful signal for traders, suggesting that buyers are gaining strength. Conversely, a bearish engulfing pattern emerging after an uptrend can indicate that sellers are stepping in, creating a potential opportunity for profit-taking or short positions.
Here’s a quick comparison of some common multiple candlestick patterns:
| Pattern | Direction | Market Sentiment |
|---|---|---|
| Engulfing Pattern | Reversal | Strong shift in momentum |
| Harami Pattern | Reversal | Potential indecision |
| Morning Star | Reversal | Transition from bearish to bullish |
| Evening Star | Reversal | Transition from bullish to bearish |
What’s essential for traders is to not only identify these patterns but also to consider the surrounding market conditions. For instance, a bullish engulfing pattern that appears during a strong uptrend may not carry the same weight as one that appears after a significant downtrend. Therefore, context is everything. Traders should also look for confirmation from other indicators, such as volume spikes or additional technical signals, to validate their interpretations.
In summary, mastering multiple candlestick patterns is a powerful tool in any trader's arsenal. By understanding the nuances of these formations and their implications, traders can make more informed decisions in the fast-paced world of cryptocurrency trading. The ability to interpret these patterns effectively can lead to better timing in entries and exits, ultimately enhancing overall trading performance.
Interpreting Candlestick Patterns
Interpreting candlestick patterns is a crucial skill for any trader looking to navigate the unpredictable waters of the cryptocurrency market. These patterns are not just random shapes; they tell a story about market sentiment and potential future price movements. By analyzing the shapes, sizes, and positions of candlesticks relative to one another, traders can gain valuable insights into whether the market is bullish or bearish. For instance, a series of long green candles might indicate strong buying interest, while a series of red candles could suggest selling pressure.
One of the key aspects of interpreting these patterns is understanding the context in which they appear. For example, a doji candlestick appearing after a strong uptrend could signal a potential reversal, while the same doji appearing after a downtrend might indicate a consolidation phase. This is why context is king in the world of candlestick analysis. It’s not enough to simply recognize a pattern; traders must also consider the broader market environment and any relevant news or events that could influence price movements.
Moreover, confirmation signals play a vital role in the interpretation process. Traders often look for additional indicators to validate their interpretations of candlestick patterns. For example, if a bullish engulfing pattern appears, traders might wait for a subsequent green candle to confirm the upward momentum before entering a trade. This extra layer of confirmation can significantly enhance the reliability of the signals derived from candlestick patterns.
However, misinterpretation can lead to costly mistakes. It's essential for traders to be aware of common pitfalls, such as ignoring the overall trend or failing to consider volume. A candlestick pattern accompanied by low trading volume may not hold the same weight as one supported by high volume, which indicates stronger conviction among traders. Therefore, effective interpretation requires a holistic approach that combines candlestick analysis with other tools and indicators.
In summary, interpreting candlestick patterns is both an art and a science. It involves a mix of technical analysis and an understanding of market psychology. By honing this skill, traders can make more informed decisions and potentially increase their chances of success in the volatile world of cryptocurrency trading.
- What are candlestick patterns? Candlestick patterns are graphical representations of price movements in financial markets, used to gauge market sentiment and predict future price movements.
- How can I identify candlestick patterns? You can identify candlestick patterns by observing the shapes and formations of the candles on a price chart, comparing them to known patterns such as dojis, hammers, and engulfing patterns.
- Why is context important in candlestick interpretation? Context is crucial because it helps traders understand the market environment in which a pattern appears, influencing the reliability of the signals they derive from it.
- What are confirmation signals? Confirmation signals are additional indicators or events that validate a candlestick pattern, helping traders confirm their interpretations before making trading decisions.
Confirmation Signals
When it comes to trading based on candlestick patterns, play a pivotal role in ensuring that your decisions are backed by solid evidence. It’s like having a trusty compass that guides you through the unpredictable waters of the crypto market. Traders often find themselves in a dilemma: should they act on a candlestick pattern alone, or wait for additional indicators to confirm their instincts? The latter is often the wiser choice.
Confirmation signals can come in various forms, including volume spikes, additional candlestick formations, or even signals from other technical indicators. For instance, if you spot a bullish engulfing pattern, it’s essential to look for an increase in trading volume on the subsequent candle. This surge in volume indicates that more traders are backing the price movement, lending credibility to the bullish signal. Think of it as a crowd cheering for a team; the louder the crowd, the more confident you can feel about their chances of winning.
Moreover, waiting for a confirmation candle to follow a pattern can also be beneficial. For example, if you identify a doji candle after a significant downtrend, you might want to wait for a subsequent bullish candle to confirm that buyers are indeed stepping in. This approach minimizes the risk of false signals, which can lead to costly mistakes. In trading, patience is not just a virtue; it’s a necessity.
Here’s a quick overview of some common confirmation signals:
- Volume Increase: A noticeable rise in trading volume can validate the strength of a candlestick pattern.
- Subsequent Candlestick Patterns: Following a pattern, a confirming candle can provide additional assurance of the trend direction.
- Technical Indicators: Indicators like the Relative Strength Index (RSI) or Moving Averages can help reinforce the signals from candlestick patterns.
In conclusion, while candlestick patterns are powerful tools for predicting market movements, relying solely on them without confirmation can be a recipe for disaster. By integrating confirmation signals into your trading strategy, you not only enhance your decision-making process but also increase your chances of success in the volatile world of cryptocurrency trading.
What are confirmation signals in trading?
Confirmation signals are additional indicators or patterns that support the validity of a trade signal derived from candlestick patterns. They help traders make more informed decisions.
Why is it important to wait for confirmation?
Waiting for confirmation helps to reduce the risk of false signals, which can lead to unprofitable trades. It ensures that the market sentiment aligns with your trading strategy.
Can I rely solely on candlestick patterns without confirmation?
While candlestick patterns can provide valuable insights, relying solely on them without confirmation increases the risk of making poor trading decisions. Combining them with confirmation signals enhances your strategy.

Common Mistakes in Interpretation
When diving into the world of candlestick patterns, it’s easy to get swept away by their intricate designs and the stories they tell. However, many traders—especially those who are new to crypto trading—often fall into the trap of misinterpreting these patterns. One of the most common mistakes is ignoring the context in which a pattern appears. For instance, a bullish engulfing pattern in a strong downtrend might not hold the same weight as it would in a sideways market. It's crucial to consider the overall market sentiment and the preceding price action before making any decisions.
Another frequent error is placing too much emphasis on a single candlestick pattern without considering the broader chart. Candlestick patterns should be viewed as part of a larger narrative rather than isolated events. This means that traders should look for confirmation from subsequent candles or additional indicators. For example, a doji might signal indecision, but without further confirmation from the following candles, it could lead to hasty decisions.
Moreover, traders often overlook the significance of volume when interpreting candlestick patterns. High volume accompanying a pattern can lend it greater credibility, while low volume might suggest a lack of conviction. Understanding this relationship is vital; it’s like trying to hear a whisper in a crowded room—if the volume isn’t there, the message may not be as clear. To illustrate this, consider the following table:
| Candlestick Pattern | Volume Significance |
|---|---|
| Doji | Low volume may suggest indecision, while high volume indicates a potential reversal. |
| Engulfing | High volume confirms the strength of the reversal, while low volume may indicate a false signal. |
| Hammer | Strong volume on a hammer can signal a bullish reversal, while weak volume may suggest a lack of buying interest. |
Lastly, one of the biggest pitfalls is failing to adapt to the rapidly changing nature of the cryptocurrency market. Unlike traditional markets, crypto is characterized by high volatility and rapid price swings. Thus, a pattern that worked yesterday may not hold the same predictive power today. Traders must remain flexible and ready to adjust their strategies based on current market conditions.
In summary, avoiding these common mistakes in candlestick pattern interpretation can significantly enhance your trading effectiveness. By paying attention to context, seeking confirmation, considering volume, and staying adaptable, you can navigate the complexities of the crypto market with greater confidence and skill.
- What are candlestick patterns? - Candlestick patterns are visual representations of price movements that help traders understand market sentiment and potential future price movements.
- How do I interpret a doji candlestick? - A doji indicates indecision in the market, suggesting that traders should reassess their positions, especially if it appears at a significant support or resistance level.
- What is the importance of volume in candlestick patterns? - Volume provides context to candlestick patterns; high volume can validate a pattern, while low volume may indicate a lack of conviction.
- Can candlestick patterns predict future price movements? - While candlestick patterns can provide insights, they should be used in conjunction with other indicators and market analysis for more reliable predictions.
Utilizing Candlestick Patterns in Trading Strategies
When it comes to navigating the unpredictable waters of cryptocurrency trading, candlestick patterns can be your compass. By integrating these patterns into your trading strategies, you can significantly enhance your decision-making process. Imagine you're a sailor; just as you wouldn’t set sail without checking the weather, you shouldn’t dive into trades without analyzing candlestick patterns. They provide crucial insights that can help you determine the best times to enter or exit a trade.
One effective way to utilize candlestick patterns is by combining them with other technical indicators. For instance, when you spot a bullish engulfing pattern, it’s wise to check the Relative Strength Index (RSI) or moving averages to confirm the trend. This dual approach not only validates your candlestick signals but also strengthens your overall analysis. Think of it as having a second opinion before making a big decision; it adds a layer of confidence to your trading strategy.
Additionally, risk management techniques are essential when applying candlestick patterns in your trading plan. A common practice is to set stop-loss orders based on the patterns you observe. For example, if you identify a hammer candlestick signaling a potential reversal, you might place your stop-loss just below the low of the hammer. This way, if the market moves against you, your losses are minimized, allowing you to trade with peace of mind.
Moreover, understanding the context in which these patterns appear is crucial. For instance, a doji candlestick following a strong trend can indicate a potential reversal, but if it appears in a consolidating market, it might suggest indecision rather than a change in direction. Therefore, always consider the larger market dynamics alongside your candlestick analysis.
To summarize, effectively utilizing candlestick patterns in your trading strategies involves:
- Combining candlestick patterns with other technical indicators for enhanced confirmation.
- Implementing robust risk management techniques, such as setting stop-loss orders.
- Understanding the market context to avoid misinterpretations and false signals.
By employing these strategies, you can navigate the crypto market with greater confidence and clarity, ultimately leading to more informed trading decisions.
Q: What are candlestick patterns?
A: Candlestick patterns are visual representations of price movements that indicate market sentiment and potential future price movements.
Q: How can I confirm a candlestick pattern?
A: Confirmation can be achieved by using additional indicators, such as volume spikes or other technical indicators like moving averages and RSI.
Q: What is the importance of risk management in trading?
A: Risk management is crucial to protect your capital from unexpected market movements. Techniques like setting stop-loss orders help minimize losses.
Q: Can candlestick patterns predict future price movements?
A: While they can provide insights into potential future movements, no pattern guarantees outcomes. They should be used in conjunction with other analysis tools.

Combining with Technical Indicators
When it comes to crypto trading, relying solely on candlestick patterns can be like sailing a ship without a compass. While these patterns provide valuable insights into market sentiment, combining them with technical indicators can significantly enhance your trading strategy. Think of technical indicators as the wind in your sails, helping to guide your decisions and navigate the often turbulent waters of the cryptocurrency market.
To get started, it’s essential to understand what technical indicators are. These are statistical calculations based on historical price and volume data that help traders identify trends, reversals, and potential entry and exit points. When you pair candlestick patterns with these indicators, you create a more comprehensive view of the market, allowing for better-informed decisions.
For instance, consider the Relative Strength Index (RSI), which measures the speed and change of price movements. When you spot a bullish candlestick pattern, such as a hammer, and the RSI indicates that the market is oversold (typically below 30), this could be a strong signal to enter a long position. Conversely, if you see a bearish candlestick pattern like an engulfing candle while the RSI is above 70, it might be time to consider selling or shorting, as the market could be overbought.
Another powerful combination is using moving averages alongside candlestick patterns. Moving averages smooth out price data to identify the direction of the trend over a specific period. For example, if a bullish candlestick pattern forms above a moving average, it may suggest a strong upward trend, reinforcing the buy signal. On the other hand, if a bearish pattern appears below a moving average, it could indicate a potential downtrend, signaling traders to take caution.
Here’s a quick summary of how to effectively combine candlestick patterns with technical indicators:
| Combination | Signal Interpretation |
|---|---|
| Bullish Candlestick + RSI < 30 | Potential buying opportunity |
| Bearish Candlestick + RSI > 70 | Potential selling opportunity |
| Bullish Candlestick above Moving Average | Strong uptrend confirmation |
| Bearish Candlestick below Moving Average | Strong downtrend confirmation |
Incorporating these strategies into your trading plan not only increases your chances of success but also provides a safety net against the unpredictable nature of the crypto market. Remember, while candlestick patterns can give you a glimpse into potential market movements, technical indicators act as a guiding force, helping you make more accurate and confident trading decisions.
- What are candlestick patterns? Candlestick patterns are visual representations of price movements that help traders understand market sentiment.
- How do I combine candlestick patterns with technical indicators? By analyzing candlestick patterns alongside indicators like RSI and moving averages, traders can make more informed decisions.
- Why is risk management important in crypto trading? Effective risk management protects traders from unexpected market movements and helps ensure long-term success.
Risk Management Techniques
When it comes to trading in the crypto market, risk management isn't just a buzzword—it's a necessity. The crypto landscape is notoriously volatile, and without a solid risk management strategy, traders can quickly find themselves in deep waters. So, how can you protect your investments while still aiming for those juicy profits? Let's break it down.
One of the most effective techniques is setting stop-loss orders. This tool allows traders to define a price point at which they will automatically sell their assets to prevent further losses. Think of it as a safety net; it catches you before you fall too far. By determining your stop-loss level ahead of time, you can make emotional decisions less likely, which is crucial in a market that can swing wildly in a matter of minutes.
Another cornerstone of risk management is position sizing. This involves deciding how much of your capital to risk on a single trade. A common rule of thumb is to risk no more than 1-2% of your total trading capital on any given trade. This way, even a series of losses won't wipe you out. Imagine if you had a $10,000 trading account; risking 1% means you would only lose $100 on a single trade. If you keep your losses small, you give yourself a much better chance of recovering from setbacks.
Moreover, diversifying your portfolio can significantly mitigate risks. Instead of putting all your eggs in one basket, consider spreading your investments across different cryptocurrencies. This strategy can help cushion your overall portfolio against the volatility of a single asset. For instance, if Bitcoin takes a tumble, but Ethereum holds steady, your losses may be minimized. Just like a balanced diet, a diversified portfolio can lead to healthier trading outcomes.
It's also essential to stay informed about market conditions. Keeping an eye on news, trends, and technical analysis can help you make better decisions. This is where incorporating technical indicators into your trading strategy comes into play. Indicators like the Relative Strength Index (RSI) or Moving Averages can provide insights into market momentum and help you identify potential entry and exit points.
Lastly, don't underestimate the power of emotional discipline. Trading can be an emotional rollercoaster, and allowing fear or greed to dictate your decisions can lead to disastrous outcomes. Setting clear rules for yourself, sticking to your trading plan, and maintaining a level head are just as important as any technical analysis tool in your arsenal. Remember, the market can be unpredictable, but your response to it doesn't have to be.
In summary, effective risk management techniques are vital for anyone looking to thrive in the crypto trading world. By employing strategies such as stop-loss orders, position sizing, diversification, market awareness, and emotional discipline, you can navigate the turbulent waters of cryptocurrency with greater confidence and security.
- What is a stop-loss order? A stop-loss order is a predetermined price level at which a trader will sell an asset to prevent further losses.
- How much should I risk on a trade? It's generally advised to risk no more than 1-2% of your total trading capital on any single trade.
- Why is diversification important? Diversification helps spread risk across different assets, reducing the impact of a poor-performing investment on your overall portfolio.
- What are technical indicators? Technical indicators are mathematical calculations based on price and volume data that help traders assess market trends and make informed decisions.
- How can I maintain emotional discipline while trading? Setting clear trading rules and sticking to your plan can help you avoid emotional decision-making.
Frequently Asked Questions
- What are candlestick patterns?
Candlestick patterns are visual tools used in financial markets that represent price movements over a specific period. They help traders understand market sentiment and predict potential future price movements, making them essential in crypto trading.
- How do I identify a bullish candlestick pattern?
A bullish candlestick pattern typically has a small body with a long lower shadow, indicating that buyers are gaining strength. Patterns like the hammer or engulfing pattern can signal a potential upward price movement, especially after a downtrend.
- What does a doji candlestick indicate?
A doji candlestick signifies market indecision, where the opening and closing prices are almost equal. This pattern often suggests potential reversals or consolidation, making it a critical signal for traders to reassess their positions.
- How can I improve my candlestick pattern interpretation?
Improving your interpretation involves practice and understanding market context. Pay attention to the shapes, sizes, and positions of candlesticks relative to previous candles, and consider combining them with other technical indicators for better accuracy.
- What are confirmation signals, and why are they important?
Confirmation signals are additional indicators or volume spikes that validate the signals from candlestick patterns. Waiting for these confirmations before entering or exiting trades can significantly reduce the risk of false signals and enhance trading effectiveness.
- Can I use candlestick patterns with other technical indicators?
Absolutely! Combining candlestick patterns with technical indicators like moving averages or the Relative Strength Index (RSI) can provide a more comprehensive view of market trends, helping you refine your entry and exit strategies.
- What are common mistakes traders make with candlestick patterns?
Common mistakes include ignoring the broader market context, misinterpreting the patterns, and failing to wait for confirmation signals. Being aware of these pitfalls can enhance your trading effectiveness and decision-making process.
- How can I manage risk when trading based on candlestick patterns?
Effective risk management involves setting stop-loss orders and determining proper position sizes. This approach helps protect you from unexpected market movements and ensures you maintain a disciplined trading strategy.