Understanding the Use of Volume Indicators in Crypto Trading
In the ever-evolving world of cryptocurrency trading, volume indicators play a pivotal role in shaping the decisions of traders. These indicators provide essential insights into the market, allowing traders to gauge the strength of price movements and understand the underlying market dynamics. Imagine trying to navigate a vast ocean without a compass; volume indicators act as that compass, guiding traders through the turbulent waters of crypto markets. They help traders identify trends, confirm price movements, and even spot potential reversals, which can make all the difference between a profitable trade and a costly mistake.
Volume indicators measure the total amount of a cryptocurrency traded over a specific timeframe. This information is crucial because it reflects the market interest and liquidity for a particular asset. When trading volume is high, it often indicates that there is strong interest in that asset, which can lead to significant price movements. Conversely, low volume may suggest a lack of interest, potentially leading to stagnant prices. By analyzing these indicators, traders can make more informed decisions, enhancing their chances of success in this volatile market.
Furthermore, understanding the significance of volume in crypto trading is not just about knowing how much is being traded; it's about interpreting what that volume means in the context of price action. For instance, a sudden spike in volume can signal a major market event or a shift in sentiment, prompting traders to take action. This correlation between volume and price is a critical aspect of technical analysis, allowing traders to discern whether a price movement is genuine or merely a fleeting spike.
In addition to helping traders make real-time decisions, volume indicators can also be used to develop comprehensive trading strategies. By combining volume analysis with other technical tools, traders can create a robust framework for identifying entry and exit points. This synergy between different indicators can amplify the effectiveness of a trading strategy, providing a clearer picture of the market landscape.
In conclusion, volume indicators are essential tools in the arsenal of any crypto trader. They not only provide valuable insights into market trends and liquidity but also help traders navigate the complexities of price movements. By understanding and effectively utilizing these indicators, traders can enhance their decision-making process and improve their overall trading performance. So, whether you're a seasoned trader or just starting out, embracing the power of volume indicators could be the key to unlocking your trading potential.
- What are volume indicators? Volume indicators measure the total amount of a cryptocurrency traded over a specific time period, helping traders assess market activity and liquidity.
- Why is volume important in crypto trading? Volume reflects market interest and liquidity, aiding traders in identifying trends and confirming price movements.
- How can I effectively use volume indicators? Combine volume indicators with other technical analysis tools and continuously monitor market conditions to make informed trading decisions.
- What is On-Balance Volume (OBV)? OBV is a volume indicator that calculates cumulative volume to indicate buying and selling pressure, assisting traders in predicting price movements.

What Are Volume Indicators?
Volume indicators are essential tools in the world of cryptocurrency trading. They measure the amount of a cryptocurrency that is traded over a specific period, offering traders crucial insights into market activity and liquidity. Imagine you’re at a bustling market; the number of people buying and selling at any given moment reflects the market's vitality. Similarly, volume indicators help traders gauge the strength of price movements and understand whether a trend is likely to continue or reverse.
In essence, volume indicators serve as a barometer for market interest. When trading volume is high, it often indicates strong interest in a particular cryptocurrency, suggesting that the price movement may be more reliable. Conversely, low trading volume can signal a lack of interest, potentially leading to more volatile price action. Understanding these dynamics is vital for traders looking to make informed decisions in the fast-paced crypto environment.
There are various types of volume indicators, each designed to provide different insights. For instance, some indicators focus on the relationship between price and volume, while others may highlight buying or selling pressure. Familiarizing oneself with these different types can empower traders to select the most appropriate tools for their specific trading strategies and market analysis. Here’s a quick overview of some common volume indicators:
| Indicator | Description |
|---|---|
| On-Balance Volume (OBV) | Calculates cumulative volume to indicate buying and selling pressure. |
| Accumulation/Distribution Line | Assesses the relationship between price and volume to determine overall market pressure. |
By incorporating volume indicators into their trading arsenal, traders can enhance their market analysis and improve their decision-making processes. Whether you're a seasoned trader or just starting, understanding volume indicators is a crucial aspect of successful cryptocurrency trading. They not only provide clarity on market movements but also help in identifying potential entry and exit points, allowing traders to navigate the complexities of the crypto market with greater confidence.

Types of Volume Indicators
This article explores the significance of volume indicators in cryptocurrency trading, highlighting their role in decision-making, market trends, and strategies for traders to maximize their investments.
Volume indicators measure the amount of a cryptocurrency traded within a specific period, providing insights into market activity and liquidity, helping traders gauge the strength of price movements.
When it comes to trading cryptocurrencies, understanding volume indicators is crucial. These tools help traders make sense of the often chaotic market by providing a clearer picture of the trading landscape. There are several types of volume indicators, each with its unique function and utility. By familiarizing yourself with these indicators, you can enhance your trading strategies and improve your chances of success in the volatile world of crypto.
Some of the most common types of volume indicators include:
- On-Balance Volume (OBV): This indicator uses cumulative volume to reflect buying and selling pressure. By adding volume on up days and subtracting it on down days, OBV helps traders predict future price movements based on the flow of volume.
- Accumulation/Distribution Line: This indicator analyzes the relationship between price and volume to determine whether a stock is being accumulated (bought) or distributed (sold). It provides insights into the overall market sentiment and can signal potential reversals.
- Chaikin Money Flow (CMF): This indicator combines price and volume to gauge the buying and selling pressure over a specific period. A positive CMF indicates accumulation, while a negative CMF suggests distribution.
Each of these indicators serves a different purpose, and understanding their nuances can help you choose the right tools for your trading approach. For instance, while OBV is excellent for identifying trends, the Accumulation/Distribution Line can provide a more nuanced view of market sentiment. Traders often find that combining multiple indicators yields a more comprehensive understanding of market dynamics.
Moreover, it’s essential to remember that no single indicator is foolproof. Each has its strengths and weaknesses, and relying solely on one can lead to poor decision-making. Instead, consider using a combination of volume indicators alongside other technical analysis tools to create a robust trading strategy.
Volume is crucial in crypto trading as it reflects market interest and liquidity, helping traders identify trends, confirm price movements, and avoid potential pitfalls in their strategies.
Analyzing the correlation between volume and price movements can provide traders with insights into market sentiment and potential reversals, enhancing their trading decisions.
Volume spikes often indicate significant market events or shifts in sentiment, alerting traders to potential opportunities or risks that may require immediate attention.
To maximize the effectiveness of volume indicators, traders should combine them with other technical analysis tools, develop a clear strategy, and continuously monitor market conditions for informed decision-making.
Integrating volume indicators with price action analysis can enhance trading strategies, allowing traders to identify potential entry and exit points based on market dynamics.
Backtesting volume-based strategies helps traders evaluate their effectiveness, refine their approaches, and adapt to changing market conditions for improved trading performance.
Q: What is the most reliable volume indicator?
A: There isn't a one-size-fits-all answer, as reliability can vary based on market conditions and individual trading strategies. However, many traders find On-Balance Volume (OBV) and the Accumulation/Distribution Line to be particularly useful.
Q: Can volume indicators predict price movements?
A: While volume indicators can provide insights into market sentiment and potential price movements, they should not be used in isolation. Combining them with other indicators and analysis methods enhances their predictive power.
Q: How often should I check volume indicators?
A: It depends on your trading style. Day traders may check volume indicators multiple times a day, while swing traders might look at them weekly or daily. It's essential to align your frequency with your trading strategy.
On-Balance Volume (OBV)
On-Balance Volume, commonly referred to as OBV, is a powerful tool in the arsenal of traders looking to make sense of the chaotic world of cryptocurrency trading. At its core, OBV is a momentum indicator that uses volume flow to predict changes in price. Imagine it as a detective unraveling the mystery of market movements, where every trade adds to the story. The basic premise is simple: when the price of a cryptocurrency increases, the volume associated with that price increase is added to the OBV. Conversely, when the price decreases, the volume is subtracted. This cumulative approach allows traders to see the underlying pressure of buying and selling, providing insights that price alone might not reveal.
To put it simply, if you notice that the OBV is rising while the price remains stagnant, it could be a sign that a bullish move is on the horizon. This is because the increasing volume indicates that more traders are buying in, creating upward momentum that may soon reflect in the price. On the flip side, if the OBV is declining while prices are stable, it suggests selling pressure is building, hinting at a potential downturn. Thus, OBV serves as a silent yet powerful whisper in the trader’s ear, guiding decisions on when to enter or exit a position.
However, like any tool, OBV is not without its quirks. It’s essential for traders to be aware of its limitations. For instance, OBV does not account for price volatility, which means it can sometimes give false signals. A trader might see a spike in OBV and assume a price increase is imminent, only to find that the market behaves unexpectedly. Therefore, while OBV can be a valuable indicator, it should be used in conjunction with other tools and analysis methods to form a more comprehensive trading strategy.
In conclusion, understanding and utilizing On-Balance Volume can significantly enhance your trading strategy. By keeping an eye on OBV trends and recognizing its signals, traders can better navigate the complexities of the cryptocurrency market. Just remember, like any good detective story, the clues are there, but it’s up to you to piece them together!

How to Interpret OBV
Interpreting On-Balance Volume (OBV) is crucial for any trader looking to make informed decisions in the volatile world of cryptocurrency. At its core, OBV helps traders understand the relationship between price and volume, allowing them to gauge whether the price movement is supported by strong buying or selling pressure. When interpreting OBV, it’s essential to focus on several key aspects that can signal potential trading opportunities.
First and foremost, look for trends in the OBV line itself. A rising OBV indicates that the volume of trades is increasing in the direction of the price movement, suggesting that the trend is likely to continue. Conversely, if the OBV is falling while prices are rising, it may indicate that the upward price movement is not supported by strong buying pressure, potentially signaling a reversal. This divergence can be a critical indicator for traders, as it often foreshadows potential shifts in market sentiment.
Another important factor to consider is the divergence between the price chart and the OBV chart. For example, if the price of a cryptocurrency is making new highs while the OBV is not, it could be a sign that the upward momentum is weakening and that a price correction may be on the horizon. Similarly, if prices are making new lows but the OBV is rising, it could indicate that selling pressure is diminishing and a reversal might be imminent.
To make the most of OBV, traders should also consider combining it with other technical indicators. For instance, when used alongside moving averages, OBV can provide a more comprehensive view of market dynamics. By analyzing the OBV in conjunction with other tools, traders can strengthen their decision-making process, ensuring they are not relying solely on one indicator.
Here’s a quick summary of key points to remember when interpreting OBV:
- Rising OBV: Indicates strong buying pressure; likely continuation of an uptrend.
- Falling OBV: Suggests selling pressure; potential for a downtrend.
- Price/OBV Divergence: A critical signal for potential reversals.
- Combine with Other Indicators: Enhances reliability and depth of analysis.
In summary, mastering the interpretation of OBV can significantly enhance your trading strategy. By closely monitoring trends and divergences, and combining OBV with other technical indicators, traders can make more informed decisions and potentially capitalize on market movements. Remember, the key to successful trading lies not just in understanding one indicator but in integrating multiple tools to paint a complete picture of market dynamics.
Q: What is OBV?
A: On-Balance Volume (OBV) is a technical indicator that uses volume flow to predict changes in stock price. It adds volume on up days and subtracts volume on down days to create a cumulative total.
Q: How can I use OBV in my trading strategy?
A: You can use OBV to confirm trends, identify potential reversals, and gauge market sentiment. Pairing it with other indicators can enhance its effectiveness.
Q: Are there any limitations to using OBV?
A: Yes, OBV does not account for volatility and can generate false signals, so it’s essential to use it in conjunction with other analysis tools.
Q: Can I rely solely on OBV for trading decisions?
A: While OBV is a valuable tool, relying solely on it can be risky. It's best to incorporate it with other indicators and market analysis for well-rounded decision-making.

Limitations of OBV
This article explores the significance of volume indicators in cryptocurrency trading, highlighting their role in decision-making, market trends, and strategies for traders to maximize their investments.
Volume indicators measure the amount of a cryptocurrency traded within a specific period, providing insights into market activity and liquidity, helping traders gauge the strength of price movements.
Various volume indicators exist, each serving different purposes. Understanding these types can help traders select the most appropriate tools for their trading strategies and market analysis.
On-Balance Volume (OBV) calculates cumulative volume to indicate buying and selling pressure, assisting traders in predicting price movements based on volume flow.
Interpreting OBV involves analyzing trends and divergences between price and volume, which can signal potential buy or sell opportunities in the market.
While On-Balance Volume (OBV) is a powerful tool in the trader's arsenal, it is not without its limitations. One of the primary drawbacks is that OBV does not account for market volatility. In a highly volatile market, price fluctuations can occur rapidly, making it difficult for traders to rely solely on OBV signals. This means that traders may experience false signals, where the OBV suggests a buying opportunity, but the price action contradicts it.
Additionally, OBV can sometimes lead to misleading interpretations. For instance, if a cryptocurrency experiences a sudden spike in volume but the price remains stagnant, traders might misinterpret this as a bullish signal. However, this could be due to large sell orders being executed without a corresponding increase in price. Therefore, it’s essential to consider the context of volume changes alongside other indicators.
Another limitation is that OBV is a lagging indicator. This means that it reacts to price movements rather than predicting them. As a result, traders may find themselves entering or exiting trades too late, missing out on optimal entry points. To mitigate these issues, traders should consider using OBV in conjunction with other technical indicators, such as moving averages or RSI, to create a more comprehensive trading strategy.
In summary, while OBV can provide valuable insights into market trends, it's crucial for traders to be aware of its limitations. By understanding these constraints, traders can better navigate the complexities of the crypto market and make more informed decisions.
The Accumulation/Distribution Line assesses the relationship between price and volume to determine the overall buying or selling pressure in the market.
Volume is crucial in crypto trading as it reflects market interest and liquidity, helping traders identify trends, confirm price movements, and avoid potential pitfalls in their strategies.
Analyzing the correlation between volume and price movements can provide traders with insights into market sentiment and potential reversals, enhancing their trading decisions.
Volume spikes often indicate significant market events or shifts in sentiment, alerting traders to potential opportunities or risks that may require immediate attention.
To maximize the effectiveness of volume indicators, traders should combine them with other technical analysis tools, develop a clear strategy, and continuously monitor market conditions for informed decision-making.
Integrating volume indicators with price action analysis can enhance trading strategies, allowing traders to identify potential entry and exit points based on market dynamics.
Backtesting volume-based strategies helps traders evaluate their effectiveness, refine their approaches, and adapt to changing market conditions for improved trading performance.
- What is the main purpose of volume indicators?
Volume indicators help traders assess market activity and liquidity, providing insights into price movements and potential trading opportunities. - Can volume indicators guarantee successful trades?
No, while volume indicators are valuable tools, they should be used in conjunction with other analysis methods to enhance trading decisions. - How can I combine volume indicators with other tools?
Traders can integrate volume indicators with technical analysis tools like moving averages or RSI to create a more robust trading strategy.

Accumulation/Distribution Line
The Accumulation/Distribution Line (A/D Line) is a powerful tool that traders use to assess the overall buying and selling pressure in the market. It provides insights into whether a cryptocurrency is being accumulated (purchased) or distributed (sold) over time. Essentially, the A/D Line combines price and volume to give a clearer picture of market sentiment. When the A/D Line is rising, it indicates that buying pressure is increasing, which can suggest that the price may follow suit. Conversely, a declining A/D Line signals that selling pressure is greater than buying, potentially forecasting a price drop.
Understanding how to read the A/D Line is crucial for traders. It’s not just about the line moving up or down; it’s about the context behind those movements. For instance, if the price of a cryptocurrency is increasing but the A/D Line is falling, it could indicate that the rally is not supported by strong buying pressure, which may lead to a reversal. This divergence between price and the A/D Line is a red flag that traders must pay attention to.
Moreover, the A/D Line can be used in conjunction with other indicators to strengthen trading strategies. For example, integrating it with moving averages or relative strength index (RSI) can provide a more comprehensive view of market conditions. By observing how the A/D Line behaves in relation to these indicators, traders can make more informed decisions about when to enter or exit trades.
| Market Condition | A/D Line Behavior | Implication |
|---|---|---|
| Price Increases, A/D Line Rises | Strong buying pressure | Potential upward trend |
| Price Increases, A/D Line Falls | Weak buying pressure | Possible reversal |
| Price Decreases, A/D Line Falls | Strong selling pressure | Potential downward trend |
| Price Decreases, A/D Line Rises | Weak selling pressure | Possible reversal |
In summary, the Accumulation/Distribution Line is an invaluable indicator for traders looking to gauge market sentiment and make informed decisions. By analyzing its movements alongside price changes, traders can better understand the underlying forces at play in the cryptocurrency market, which can lead to more strategic trading opportunities.
- What is the purpose of the Accumulation/Distribution Line?
The A/D Line helps traders identify the overall buying and selling pressure in the market, providing insights into potential price movements. - How do I calculate the Accumulation/Distribution Line?
The A/D Line is calculated by taking the previous A/D value and adding or subtracting the current volume based on the price movement. - Can the A/D Line be used with other indicators?
Yes, combining the A/D Line with other indicators like moving averages or RSI can enhance trading strategies and improve decision-making. - What should I look for when analyzing the A/D Line?
Watch for divergences between the A/D Line and price movements, as these can indicate potential reversals or continuations in market trends.

Why Volume Matters in Crypto Trading
Volume is a fundamental metric in the world of cryptocurrency trading, and understanding its implications can significantly enhance your trading strategy. When we talk about volume, we refer to the total amount of a cryptocurrency that is traded within a specific timeframe. Why does this matter? Well, volume is a direct indicator of market interest and liquidity. Without sufficient volume, a market can become stagnant, leading to high volatility and unpredictable price movements.
Imagine trying to sell a rare collectible item. If there are plenty of buyers eager to purchase it, you can expect a fair market price. However, if there's little interest, you might struggle to sell at all, or you may have to accept a much lower price. The same principle applies to cryptocurrencies. High trading volume often correlates with increased liquidity, allowing traders to enter and exit positions more easily. This liquidity is essential for making informed trading decisions, as it helps prevent significant price fluctuations caused by large trades.
Moreover, volume plays a crucial role in confirming price movements. For instance, if the price of Bitcoin surges but the volume remains low, it could be a sign that the rally lacks genuine support. On the other hand, a price increase accompanied by high volume typically indicates strong market interest, suggesting that the upward trend is likely to continue. Thus, observing the volume can help traders avoid potential pitfalls, such as falling for false breakouts or being caught in a market reversal.
To illustrate this point, consider the following table that showcases the relationship between price movements and volume:
| Price Movement | Volume Level | Market Sentiment |
|---|---|---|
| Price Increase | High Volume | Strong Bullish Sentiment |
| Price Increase | Low Volume | Weak Bullish Sentiment |
| Price Decrease | High Volume | Strong Bearish Sentiment |
| Price Decrease | Low Volume | Weak Bearish Sentiment |
As you can see, the combination of price movements and volume provides valuable insights into the overall market sentiment. By analyzing these factors together, traders can make more informed decisions about when to buy or sell. Additionally, volume can help identify potential reversals in trends, allowing traders to adapt their strategies accordingly.
In summary, volume is not just a number; it is a vital component of successful crypto trading. By keeping an eye on volume trends, traders can better understand market dynamics, confirm price movements, and make strategic decisions that can lead to more profitable outcomes. So, the next time you look at a cryptocurrency chart, remember to pay attention to the volume—it could be the key to unlocking your trading potential.
- What is the significance of volume in crypto trading? Volume indicates market interest and liquidity, helping traders confirm price movements and identify trends.
- How can I use volume indicators effectively? Combine volume indicators with other technical analysis tools and continuously monitor market conditions for informed decision-making.
- What are some common volume indicators? Popular volume indicators include On-Balance Volume (OBV) and the Accumulation/Distribution Line.

Volume and Price Correlation
When it comes to trading cryptocurrencies, understanding the relationship between volume and price movements is like having a secret weapon. Imagine you're a detective trying to solve a mystery; the clues you gather lead you to the truth. In this case, volume serves as a critical clue that can help you decipher market sentiment and potential price reversals.
Typically, a rise in trading volume often coincides with significant price movements. This means that when you see an increase in volume, it can indicate that traders are either buying or selling aggressively, which might lead to a price breakout or breakdown. For instance, if the price of Bitcoin suddenly surges while volume spikes, it suggests that the market is backing the move, reinforcing the idea that the price increase is sustainable. Conversely, if prices rise but volume remains low, it may signal a lack of conviction among traders, hinting that the price could soon reverse.
To illustrate this correlation, consider the following table that highlights different scenarios of volume and price movements:
| Scenario | Volume Trend | Price Movement | Market Sentiment |
|---|---|---|---|
| 1 | Increasing | Rising | Positive |
| 2 | Decreasing | Rising | Bearish |
| 3 | Increasing | Falling | Negative |
| 4 | Stable | Stable | Indecisive |
In this table, you can see how different combinations of volume and price movements can indicate various market sentiments. For example, scenario 1 shows that increasing volume alongside rising prices is a strong bullish signal, indicating that traders are confident in the upward momentum. On the other hand, scenario 2 reveals a potential red flag; rising prices with decreasing volume may suggest that the rally lacks support, making it vulnerable to a pullback.
As traders, it's essential to not just watch volume in isolation but to analyze it in conjunction with price action. This means looking for patterns and divergences. For instance, if you notice that the price of a cryptocurrency is making higher highs, but the volume is declining, it could be a sign that the upward trend is losing steam. In such cases, being aware of these subtle signals can help you make more informed trading decisions, potentially saving you from costly mistakes.
In conclusion, mastering the correlation between volume and price is vital for any trader aiming to navigate the volatile waters of cryptocurrency trading. By keeping an eye on volume trends, you can gain valuable insights into market sentiment, identify potential reversals, and enhance your overall trading strategy.
- What is the importance of volume in crypto trading? Volume helps traders gauge market interest and liquidity, confirming price movements and trends.
- How can I use volume indicators effectively? Combine volume indicators with other technical analysis tools and continuously monitor market conditions.
- What does a spike in volume indicate? A spike in volume often signifies significant market events or shifts in sentiment, alerting traders to potential opportunities or risks.

Volume Spikes and Market Sentiment
When it comes to crypto trading, volume spikes can be like fireworks on the Fourth of July—sudden, bright, and impossible to ignore. These spikes often signal significant market movements or shifts in sentiment that traders should pay close attention to. Imagine you're at a concert, and suddenly the crowd erupts with energy; that’s what a volume spike can feel like in the trading world. It indicates that something important is happening, whether it’s a major news event, a regulatory announcement, or perhaps a whale moving large amounts of cryptocurrency.
Understanding the relationship between volume and market sentiment is crucial for traders. A volume spike can suggest that a trend is gaining momentum, or it can indicate a potential reversal. For instance, if you notice a substantial increase in volume while the price is rising, it might mean that the bulls are in control, and the upward trend could continue. Conversely, if there’s a volume spike during a price drop, it might signal that sellers are overpowering buyers. This contrast in volume activity can provide valuable insights into market dynamics.
Moreover, volume spikes can serve as a precursor to price volatility. When many traders are entering or exiting positions simultaneously, it can create sharp price movements. This is why many seasoned traders keep an eye on volume trends as part of their overall strategy. They understand that volume is not just a number; it’s a reflection of market sentiment and can often precede significant price changes.
To illustrate this further, let’s take a look at a hypothetical scenario presented in the table below:
| Date | Price ($) | Volume (BTC) | Market Sentiment |
|---|---|---|---|
| 2023-10-01 | 40,000 | 500 | Neutral |
| 2023-10-02 | 41,000 | 1,500 | Positive |
| 2023-10-03 | 39,000 | 2,000 | Negative |
| 2023-10-04 | 42,000 | 3,500 | Very Positive |
In this example, you can see how the volume correlates with price changes and market sentiment. Notice how on October 4th, the price spiked to $42,000 with a dramatic increase in volume to 3,500 BTC. This suggests that the market sentiment was very positive, and traders were eager to buy, anticipating further price increases.
As a trader, recognizing these patterns can help you make informed decisions. Are you seeing a volume spike? What does it mean for the current trend? Is it time to buy, sell, or hold? By asking these questions, you can better position yourself in the market.
In conclusion, volume spikes are more than just numbers on a chart; they're a vital indicator of market sentiment. They can alert you to potential opportunities or risks, guiding your trading decisions. So, the next time you see a volume spike, don’t just brush it off—dive deeper and analyze what it could mean for your trading strategy.
- What is a volume spike? A volume spike refers to a sudden increase in the amount of a cryptocurrency traded over a specific period, often indicating significant market activity.
- How can I identify a volume spike? Traders can identify volume spikes by comparing current volume levels to historical averages, looking for significant deviations.
- What does a volume spike mean for price action? A volume spike can indicate strong market sentiment, either bullish or bearish, and may precede significant price movements.
- Should I always act on volume spikes? While volume spikes can signal important events, it's essential to consider other indicators and market conditions before making trading decisions.

How to Use Volume Indicators Effectively
Using volume indicators effectively can be a game-changer in the world of cryptocurrency trading. To truly harness their potential, it's essential to blend these indicators with other technical analysis tools and develop a coherent trading strategy. Think of volume indicators as your trusty compass in the vast ocean of market data; they guide you, but they work best when combined with other navigational tools.
First and foremost, integrating volume indicators with price action analysis can significantly enhance your trading strategies. For instance, when you observe a price increase accompanied by a spike in volume, it often signals strong buying interest. Conversely, if prices rise but volume is low, it might indicate a lack of conviction, suggesting the move could be short-lived. By paying attention to these dynamics, you can identify potential entry and exit points that align with market trends.
Another critical aspect is backtesting volume-based strategies. This process involves applying your volume indicators to historical data to evaluate their effectiveness. By backtesting, you can refine your approach, adapt to changing market conditions, and improve your overall trading performance. It’s like rehearsing for a play; the more you practice, the more confident and prepared you become for the real performance.
Furthermore, staying vigilant in monitoring market conditions is vital. The cryptocurrency market is notoriously volatile, with rapid changes that can catch even the most seasoned traders off guard. Regularly reviewing your volume indicators and adjusting your strategies accordingly can help you stay ahead of the curve. For example, if you notice an unusual increase in volume without a corresponding price movement, it might be a signal of upcoming volatility or a potential reversal.
Lastly, it’s essential to remain aware of the broader market context. Volume indicators can sometimes produce misleading signals if viewed in isolation. Therefore, consider the overall sentiment of the market and other influencing factors, such as news events or regulatory changes. By combining your volume analysis with a comprehensive understanding of the market environment, you can make more informed trading decisions.
- What are volume indicators, and why are they important? Volume indicators measure the amount of cryptocurrency traded over a specific period, helping traders gauge market activity and liquidity, which is crucial for making informed trading decisions.
- How can I effectively combine volume indicators with other tools? You can enhance your trading strategies by integrating volume indicators with price action analysis and other technical indicators, allowing for a more comprehensive view of market trends.
- What should I be cautious about when using volume indicators? Be aware that volume indicators can produce false signals, especially in volatile markets. It's essential to consider them alongside other market factors and indicators.
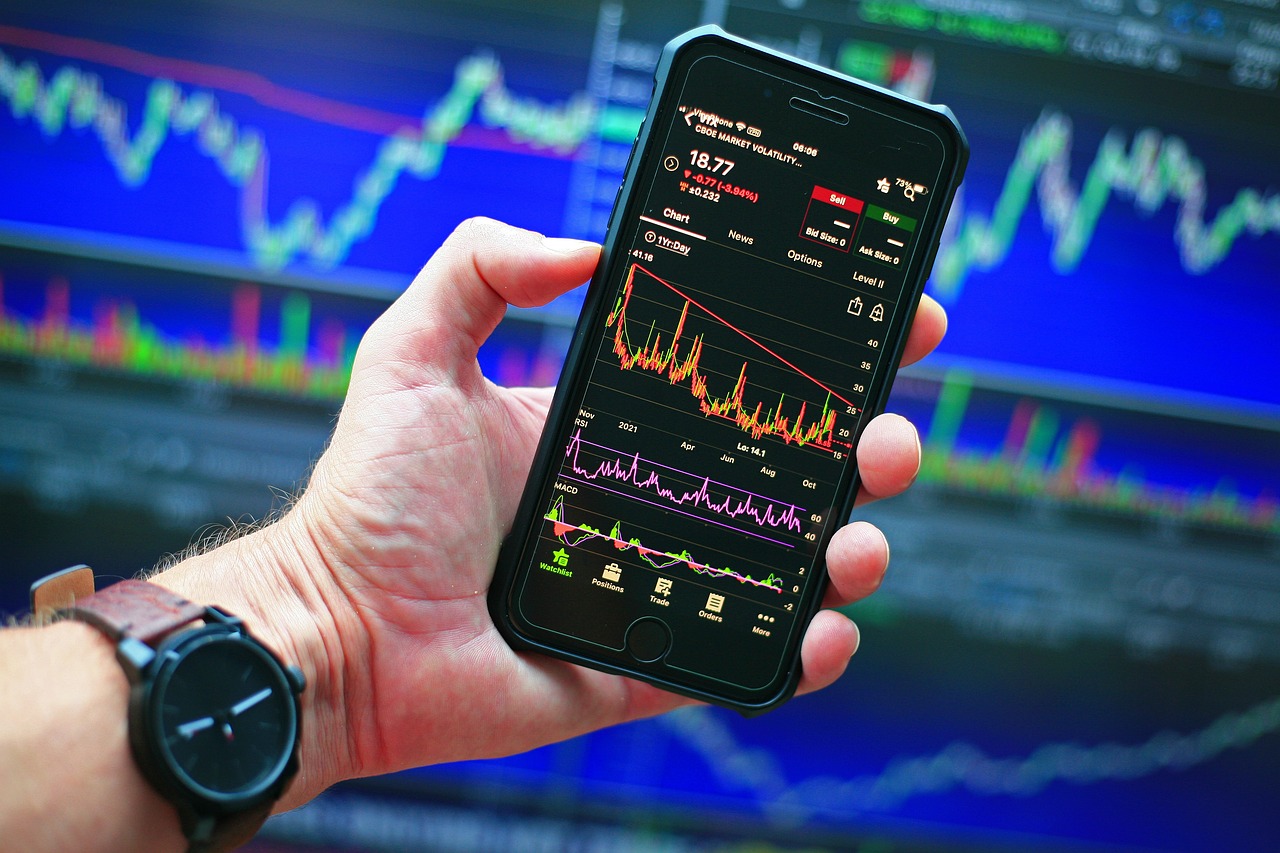
Combining Volume with Price Action
When it comes to trading in the volatile world of cryptocurrencies, understanding how to combine volume indicators with price action can be a game-changer. Think of it like a dance—volume is the rhythm, while price action is the movement. Together, they create a harmonious strategy that can lead to profitable trades. By analyzing these two elements in tandem, traders can gain deeper insights into market dynamics, helping them make informed decisions.
To effectively combine volume with price action, traders should first focus on recognizing key price levels. These levels often act as support or resistance, where price tends to bounce or reverse. When volume spikes occur at these critical points, it can signal a strong commitment from buyers or sellers, indicating potential breakouts or reversals. For instance, if the price approaches a resistance level with increasing volume, it could suggest that a breakout is imminent. On the flip side, if the price is falling but volume is decreasing, it might indicate a lack of selling pressure, hinting at a possible reversal.
Moreover, traders can enhance their strategies by observing the relationship between volume and candlestick patterns. For example, a bullish engulfing pattern accompanied by high volume can signal a strong buying interest, suggesting that the price may continue to rise. Conversely, if a bearish candlestick pattern forms with increasing volume, it might indicate that sellers are gaining control. This interplay between volume and price action can provide traders with valuable clues about market sentiment.
Another critical aspect is to look for divergences between volume and price action. A divergence occurs when the price is making new highs or lows, but the volume does not confirm the move. For instance, if the price is climbing steadily while volume is declining, it could indicate a weakening trend. Traders should be cautious of such scenarios, as they often precede reversals. By keeping an eye on these divergences, traders can better anticipate potential market shifts.
In summary, combining volume with price action is not just about observing numbers on a chart; it's about understanding the story they tell. By recognizing key levels, analyzing candlestick patterns, and watching for divergences, traders can develop a more robust trading strategy. This approach not only enhances the chances of successful trades but also helps in managing risks effectively. So, the next time you’re analyzing a crypto chart, remember to listen closely to the rhythm of volume and the movements of price action—together, they can lead you to trading success.
- What are volume indicators? Volume indicators measure the number of assets traded over a specific period, providing insights into market activity.
- How can I use volume indicators in my trading strategy? You can use volume indicators to confirm trends, identify potential reversals, and gauge market sentiment.
- Why is volume important in crypto trading? Volume is crucial as it reflects market interest and liquidity, helping traders make informed decisions.
- What is the On-Balance Volume (OBV) indicator? OBV is a volume indicator that uses cumulative volume to indicate buying and selling pressure, helping predict price movements.
- Can volume indicators be used with other technical analysis tools? Yes, combining volume indicators with other tools like moving averages and candlestick patterns can enhance trading strategies.
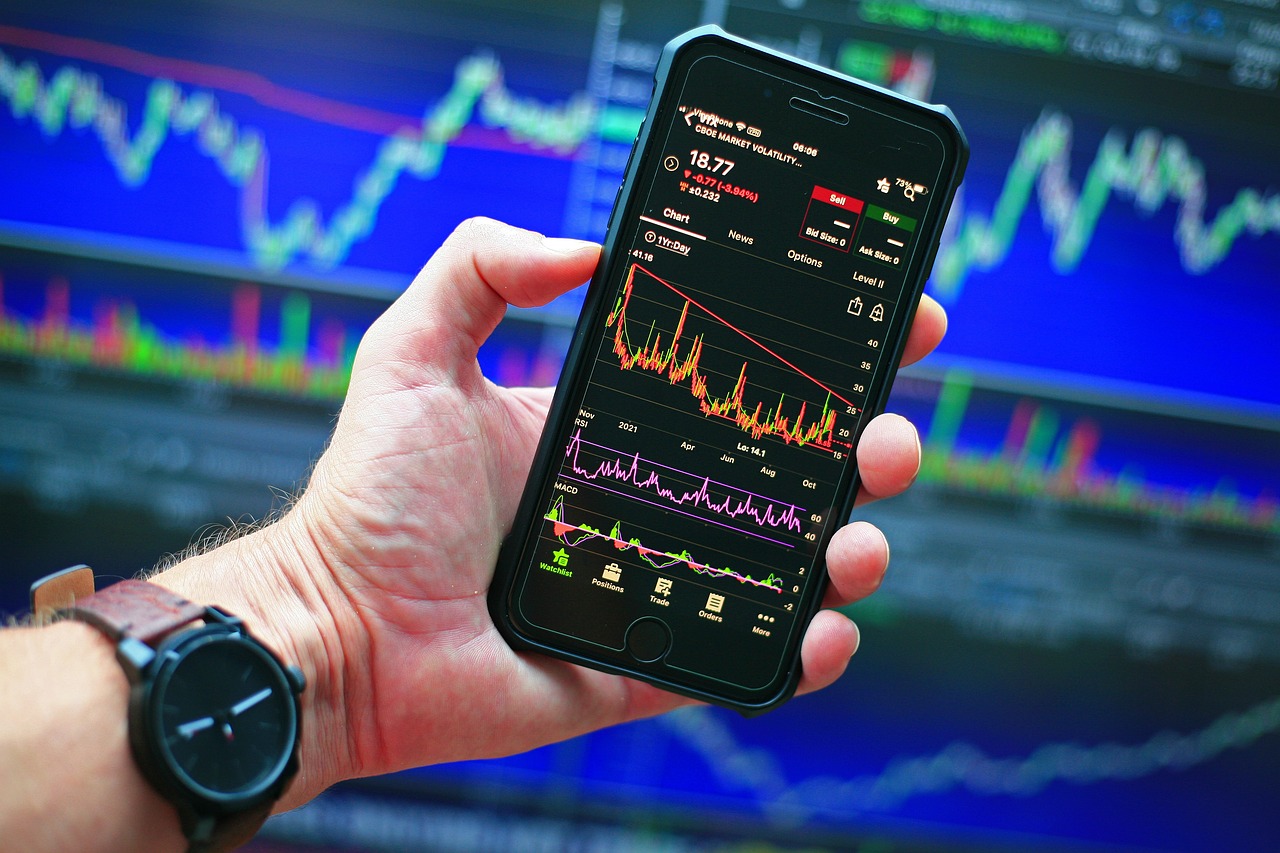
Backtesting Volume Strategies
Backtesting volume strategies is an essential practice for any trader who wants to refine their approach and improve their trading performance. It involves testing a trading strategy using historical data to determine how well it would have performed in the past. This process not only helps in validating the effectiveness of the strategy but also provides insights into how volume indicators interact with price movements over time.
Imagine you're a chef trying out a new recipe. You wouldn't just throw ingredients together without knowing how they interact, right? Similarly, backtesting allows traders to see how their volume strategies would have fared under various market conditions. By analyzing historical price and volume data, traders can identify patterns, spot trends, and make informed decisions about their future trades.
To start backtesting, traders typically follow these steps:
- Define the Strategy: Clearly outline the volume indicators and trading rules you plan to use. For instance, you might decide to buy when the On-Balance Volume (OBV) increases while the price is stable.
- Gather Historical Data: Collect historical price and volume data for the cryptocurrency you wish to trade. This data can often be found on various trading platforms or financial websites.
- Simulate Trades: Using the historical data, simulate trades based on your defined strategy. Note the entry and exit points, and calculate the potential profit or loss for each trade.
- Analyze Results: After simulating several trades, analyze the results to see how well your strategy performed. Look for patterns in winning and losing trades to understand what works and what doesn’t.
For example, let’s say you backtested a strategy using the Accumulation/Distribution Line. You might find that when the line trends upwards while the price is stable, it often leads to a price increase. This insight can be invaluable, guiding your future trades based on historical evidence.
However, it’s crucial to remember that past performance is not always indicative of future results. Market conditions can change dramatically, and what worked in the past may not work in the present or future. Therefore, continuous monitoring and adjustments to your strategies are necessary. Traders should also consider incorporating risk management techniques to protect their capital during volatile market conditions.
In conclusion, backtesting volume strategies is a powerful tool that can enhance a trader's ability to make informed decisions. By understanding how volume indicators have influenced price movements historically, traders can develop more robust trading strategies that adapt to changing market dynamics.
- What is backtesting? Backtesting is the process of testing a trading strategy using historical data to evaluate its effectiveness.
- Why is backtesting important? It helps traders validate their strategies and understand how they might perform under different market conditions.
- Can I rely solely on backtesting results? No, while backtesting provides valuable insights, market conditions can change, so continuous evaluation and adaptation are necessary.
- How often should I backtest my strategies? Regular backtesting is recommended, especially when market conditions change or when you introduce new strategies.
Frequently Asked Questions
- What are volume indicators in crypto trading?
Volume indicators are tools that measure the amount of cryptocurrency traded over a specific time frame. They provide insights into market activity and liquidity, helping traders understand the strength of price movements and make informed decisions.
- How does On-Balance Volume (OBV) work?
On-Balance Volume (OBV) calculates cumulative volume to indicate buying and selling pressure. By analyzing the flow of volume, traders can predict potential price movements, as a rising OBV suggests increasing buying pressure, while a falling OBV indicates selling pressure.
- What is the Accumulation/Distribution Line?
The Accumulation/Distribution Line is a volume indicator that assesses the relationship between price and volume. It helps traders gauge overall buying or selling pressure in the market, providing valuable insights into potential market trends.
- Why is volume important in crypto trading?
Volume is crucial because it reflects market interest and liquidity. High trading volume often confirms price movements, while low volume can indicate potential reversals or weak trends. Understanding volume helps traders avoid pitfalls and identify profitable opportunities.
- How can I effectively use volume indicators?
To use volume indicators effectively, combine them with other technical analysis tools, develop a clear trading strategy, and continuously monitor market conditions. This holistic approach enhances decision-making and improves trading performance.
- What should I consider when interpreting OBV?
When interpreting OBV, look for trends and divergences between price and volume. A divergence can signal potential buy or sell opportunities. However, be aware of its limitations, such as not accounting for volatility and the possibility of false signals.
- How do volume spikes affect market sentiment?
Volume spikes often indicate significant market events or shifts in sentiment. They can alert traders to potential opportunities or risks that require immediate attention, making it essential to monitor volume changes closely.
- What is backtesting in relation to volume strategies?
Backtesting involves evaluating the effectiveness of volume-based trading strategies by applying them to historical data. This process helps traders refine their approaches and adapt to changing market conditions for improved performance.

