The Role of Price Action Trading in Market Analysis
In the fast-paced world of trading, understanding market dynamics is crucial for success. One of the most effective methods to achieve this is through price action trading. This approach focuses on analyzing historical price movements to make informed trading decisions. Unlike traditional methods that rely heavily on indicators, price action trading allows traders to interpret market sentiment directly from price fluctuations. Imagine standing on the sidelines of a busy street; observing the flow of traffic can give you insights into how to navigate the road ahead. Similarly, price action trading provides traders with a clear view of market behavior, enabling them to anticipate potential price movements.
Price action trading is not just a method; it’s a mindset. It encourages traders to develop a keen sense of observation, interpreting the story that price charts tell. As traders delve deeper into this approach, they discover its significance in identifying trends, reversals, and market sentiment. By honing in on price movements, traders can filter out the noise created by indicators and focus on what truly matters—the price itself. This article will explore the significance of price action trading in analyzing market trends, providing insights into its strategies, advantages, and how it differs from other trading methods.
Throughout the article, we will cover essential aspects of price action trading, including its core principles and strategies that can be employed effectively. We’ll also compare this method with other trading styles, giving you a comprehensive understanding of its unique advantages. By the end of this exploration, you’ll see why many traders consider price action trading a vital tool in their market analysis toolkit.
Price action trading is all about making sense of price movements without getting bogged down by complex indicators. When traders focus on price action, they are essentially looking at the raw data—what the market is doing right now. This method emphasizes the importance of historical prices and how they influence current market behavior. Think of it like reading a book; the past chapters (historical prices) provide context for understanding the current plot (current price movements). This approach allows traders to interpret market sentiment more effectively, leading to better trading decisions.
The foundation of price action trading lies in several key principles. These principles include support and resistance levels, trend identification, and candlestick patterns. Each of these elements plays a crucial role in helping traders make informed decisions based on market behavior. For instance, recognizing support and resistance levels can guide traders in setting entry and exit points, while understanding candlestick patterns can provide insights into potential market reversals.
Support and resistance are critical concepts in price action trading. These levels indicate where the price tends to reverse or consolidate, guiding traders in setting entry and exit points. Support levels represent price points where buying interest is strong enough to overcome selling pressure. Recognizing these levels can help traders anticipate potential price reversals, much like knowing where the deep end of a pool is can help you avoid a sudden plunge. On the other hand, resistance levels are price points where selling interest surpasses buying pressure. Understanding these levels is essential for traders to identify potential exit points and profit-taking opportunities.
Identifying support levels can be likened to finding a safety net. When prices approach these levels, traders can expect buying interest to emerge, potentially leading to a bounce back. This is where traders can position themselves to take advantage of a rebound. Recognizing support levels involves looking at historical price data and observing where price has previously reversed or consolidated. The more times a price level has held as support, the stronger it is likely to be in the future.
Conversely, identifying resistance levels is akin to spotting a ceiling that the price struggles to break through. When prices reach these points, selling pressure tends to increase, creating an opportunity for traders to take profits. Understanding resistance levels helps traders avoid getting trapped in positions that might lead to losses. Much like a game of tug-of-war, it’s essential to know when to pull back and when to push forward.
Candlestick patterns offer visual insights into market sentiment. These patterns can tell a story about what traders are feeling at any given moment. For example, a strong bullish candlestick can indicate that buyers are in control, while a bearish candlestick might suggest that sellers are taking charge. By analyzing these patterns, traders can predict future price movements and enhance their decision-making process. It’s like reading the mood in a crowded room—certain patterns can signal whether it’s time to join in or step back.
Price action trading comes with several advantages that make it appealing to many traders. One of the main benefits is its simplicity. By focusing solely on price movements, traders can eliminate the clutter of indicators and make quicker decisions. This adaptability to various markets—whether trending or ranging—allows traders to adjust their strategies accordingly, capitalizing on different opportunities. The ability to react swiftly to market changes is a game-changer, especially in volatile environments.
Price action trading can be applied across various market conditions. Whether the market is trending upward, downward, or moving sideways, traders can adapt their strategies to fit the current environment. This flexibility allows traders to remain agile and seize opportunities as they arise, much like a chameleon that changes color to blend into its surroundings. This adaptability is what sets successful traders apart from the rest.
By honing in on price movements, traders can make quicker, more informed decisions. This reduces reliance on lagging indicators, which can sometimes lead to missed opportunities. The ability to interpret price action allows traders to stay ahead of the curve, enhancing their overall trading performance. Think of it as driving a car; the more you focus on the road ahead, the better your chances of avoiding obstacles.
Understanding the differences between price action trading and other trading methods is crucial for traders seeking to refine their strategies. While technical indicators rely on mathematical calculations based on price and volume, price action trading emphasizes direct price movements. This straightforward approach to market analysis can often lead to clearer insights.
In contrast to price action trading, technical indicators can sometimes create a lag in decision-making. While they can provide valuable insights, they often rely on past data, which may not accurately reflect current market conditions. Price action trading, on the other hand, allows traders to react to market changes in real-time, making it a more dynamic approach.
Fundamental analysis evaluates economic factors influencing market movements, such as interest rates and economic growth. While this method provides a broader context, it can sometimes overlook immediate price changes. Price action trading focuses solely on price behavior, allowing traders to make decisions based on current market sentiment. Both methods can complement each other for a comprehensive trading strategy, providing traders with a well-rounded perspective on market dynamics.
What is price action trading?
Price action trading is a method that focuses on historical price movements to make trading decisions, rather than relying on indicators.
What are support and resistance levels?
Support levels are price points where buying interest is strong enough to overcome selling pressure, while resistance levels are where selling interest surpasses buying pressure.
How do candlestick patterns help in trading?
Candlestick patterns provide visual insights into market sentiment, helping traders predict future price movements.
Is price action trading suitable for all market conditions?
Yes, price action trading can be applied in various market conditions, whether trending or ranging, making it a flexible trading strategy.

Understanding Price Action Trading
This article explores the significance of price action trading in analyzing market trends, providing insights into its strategies, advantages, and how it differs from other trading methods.
Price action trading is a fascinating approach that allows traders to make decisions based solely on the historical movement of prices. Imagine walking into a crowded marketplace, where the chatter and chaos represent all the noise of indicators and complex data. Instead of getting lost in that noise, price action traders focus on the simple yet powerful language of price itself. By analyzing the way prices move, they can gauge market sentiment and make informed trading decisions. This method strips away the clutter, enabling traders to respond to the market's natural rhythm.
At its core, price action trading is about understanding the dynamics of supply and demand. When traders observe price movements, they’re essentially watching the battle between buyers and sellers unfold. If prices are rising, it suggests that buyers are in control, pushing prices higher. Conversely, when prices fall, it indicates that sellers are dominating the market. This direct observation of price movements provides a clear and immediate insight into market conditions, allowing traders to react swiftly to changes.
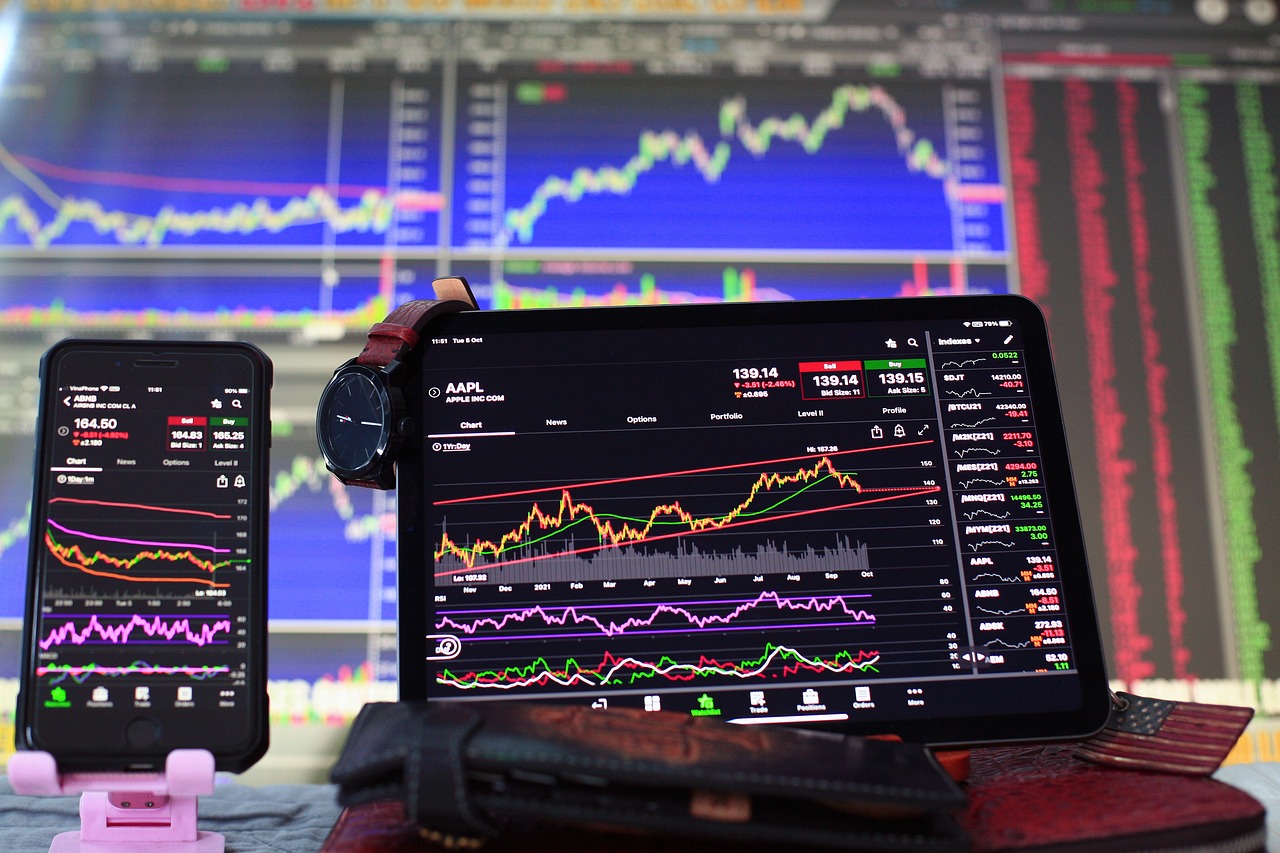
One of the most appealing aspects of price action trading is its adaptability. Whether you’re trading stocks, forex, or commodities, the principles of price action remain consistent. This universality means that traders can apply their knowledge across different markets without needing to learn new systems or tools. Furthermore, price action trading is particularly effective in volatile markets, where rapid price changes can create both risks and opportunities. By honing in on price movements, traders can seize these moments and capitalize on favorable conditions.
Unlike traditional methods that rely heavily on indicators and complex calculations, price action trading emphasizes simplicity. Traders often use basic chart patterns, such as support and resistance levels, to guide their decisions. These levels act as psychological barriers where price reversals often occur. For instance, when a stock price approaches a known resistance level, traders might anticipate a potential reversal, enabling them to plan their trades accordingly.
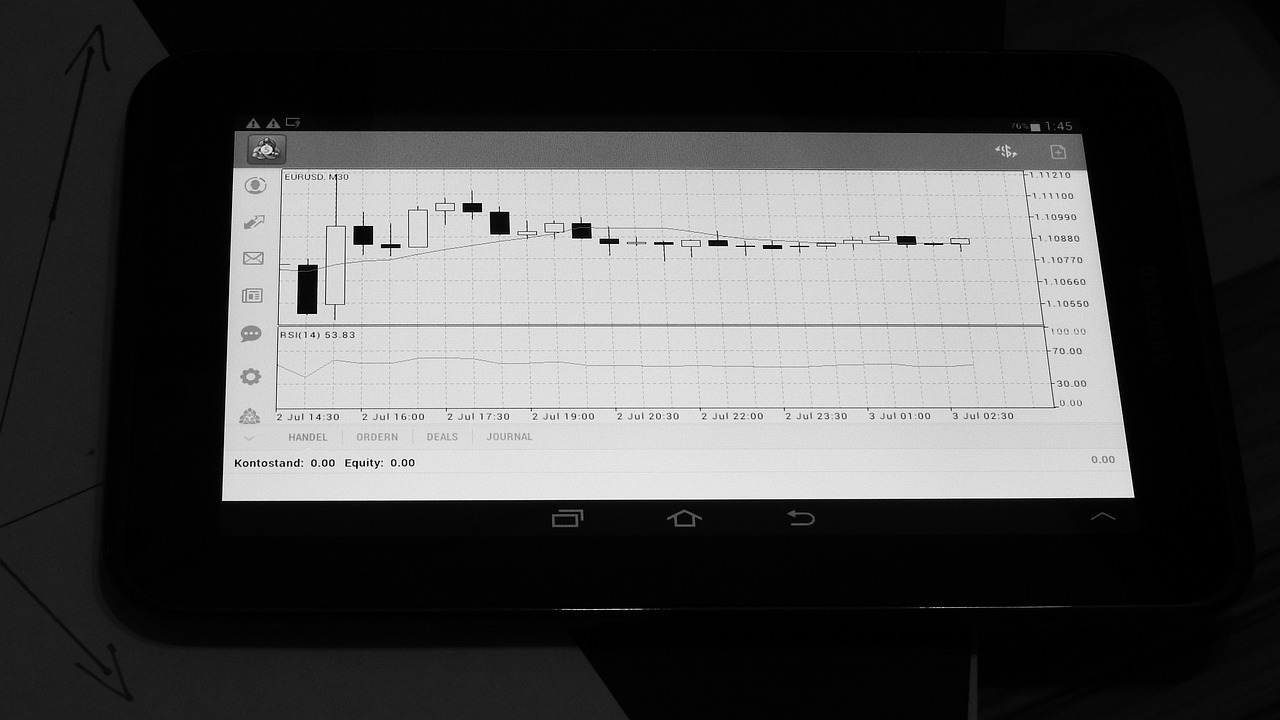
Moreover, the beauty of price action trading lies in its visual nature. Traders utilize candlestick charts to analyze price movements visually. Each candlestick provides a wealth of information, including the opening and closing prices, as well as the high and low for a specific timeframe. By interpreting these patterns, traders can gain insights into market sentiment and potential future movements. For example, a series of bullish candlesticks might indicate a strong buying sentiment, prompting traders to enter long positions.
In essence, understanding price action trading is about embracing a mindset that values the raw data of price movements over the noise of indicators. It’s a straightforward yet effective approach that empowers traders to make decisions based on real-time market behavior. So, whether you’re a novice or an experienced trader, diving into the world of price action can unlock new opportunities and enhance your trading strategies.
- What is price action trading? Price action trading is a method that focuses on analyzing historical price movements to make trading decisions without relying on indicators.
- How does price action trading differ from technical analysis? Unlike technical analysis, which often relies on indicators and mathematical calculations, price action trading emphasizes direct observation of price movements.
- Can price action trading be applied to different markets? Yes, price action trading is versatile and can be applied across various markets, including stocks, forex, and commodities.
- What are support and resistance levels? Support and resistance levels are price points where the price tends to reverse or consolidate, guiding traders in their decision-making.
Key Principles of Price Action Trading
Price action trading is more than just a method; it's an art form that requires a deep understanding of market dynamics. The foundation of this trading style lies in a few key principles that guide traders in their decision-making processes. By focusing on the actual price movements rather than relying on external indicators, traders can gain valuable insights into market sentiment. Let’s delve into these essential principles that make price action trading a powerful tool in the arsenal of any trader.
One of the cornerstones of price action trading is the concept of support and resistance levels. These levels act as psychological barriers where the price tends to either reverse or consolidate. Think of support as a safety net where buyers step in to prevent the price from falling further, while resistance acts like a ceiling where sellers emerge to push the price back down. Understanding these levels is crucial for traders, as they provide clear guidelines for setting entry and exit points.
Support levels are price points where buying interest is strong enough to overcome selling pressure. When the price approaches a support level, it often bounces back up, reflecting the strength of buyers in that area. Recognizing these levels can help traders anticipate potential price reversals. For example, if a stock has consistently bounced off a certain price point, that level can be marked as support. Traders often look for additional confirmation, such as increased volume at these levels, to validate their predictions.
On the flip side, resistance levels are where selling interest exceeds buying pressure. These levels indicate potential exit points and profit-taking opportunities for traders. When the price approaches a resistance level, it may struggle to break through, leading to a reversal or consolidation. Just like support, identifying resistance levels involves looking at historical price data and observing where the price has previously stalled. Traders often utilize tools such as trend lines or horizontal lines to visualize these key areas on their charts.
Another vital aspect of price action trading is the analysis of candlestick patterns. These patterns provide visual cues about market sentiment and can indicate potential future price movements. Each candlestick represents a specific time frame and illustrates the open, high, low, and close prices within that period. By studying these patterns, traders can gain insights into whether the market is bullish or bearish. For instance, a series of bullish candlesticks might suggest increasing buying pressure, while a pattern of bearish candlesticks could indicate the opposite.
Some common candlestick patterns that traders look for include:
- Doji: Indicates indecision in the market.
- Hammer: Suggests a potential reversal after a downtrend.
- Engulfing Pattern: Signifies a strong shift in momentum.
What is price action trading?
Price action trading focuses on historical price movements to make trading decisions, emphasizing the analysis of price changes rather than relying on indicators.
How do I identify support and resistance levels?
Support and resistance levels can be identified by analyzing historical price data, looking for areas where the price has previously reversed or consolidated.
What are candlestick patterns?
Candlestick patterns are visual representations of price movements within a specific time frame, helping traders gauge market sentiment and predict future price actions.
Is price action trading suitable for all market conditions?
Yes, price action trading can be applied in various market conditions, whether trending or ranging, making it a versatile strategy for many traders.

Support and Resistance Levels
Support and resistance levels are fundamental concepts in price action trading that every trader should understand. These levels act as psychological barriers where price movements tend to stall or reverse, making them essential for effective trading strategies. Think of support as a safety net that catches the price when it falls, while resistance is akin to a ceiling that prevents the price from rising further. Recognizing these levels can significantly enhance a trader's ability to make informed decisions.
When we talk about support levels, we refer to price points where buying pressure is strong enough to overcome selling pressure. This is where traders typically look for opportunities to enter the market, anticipating that the price will bounce back up. For instance, if a stock has repeatedly bounced off a certain price point, that point becomes a critical support level. On the flip side, resistance levels indicate price points where selling pressure exceeds buying pressure, making it a prime location for traders to consider exiting their positions or to short the asset. The interplay between these two levels is crucial for understanding market dynamics.
To illustrate how support and resistance levels work, consider the following table that outlines their characteristics:
| Aspect | Support Level | Resistance Level |
|---|---|---|
| Definition | Price level where buying interest is strong | Price level where selling interest is strong |
| Market Behavior | Price tends to bounce back | Price tends to reverse downwards |
| Trading Strategy | Buy near support | Sell near resistance |
Identifying these levels is not just about drawing lines on a chart; it involves analyzing historical price movements and understanding market sentiment. Traders can use various methods to pinpoint these levels, including:
- Chart Patterns: Observing historical price patterns can reveal potential support and resistance zones.
- Moving Averages: These can act as dynamic support and resistance levels.
- Volume Profile: Analyzing volume at different price levels can highlight where significant buying or selling has occurred.
Moreover, the strength of these levels can change over time. A previously strong support level can become a resistance level if the price breaks below it, and vice versa. This phenomenon is known as a "role reversal" and is a vital concept for traders to grasp. By keeping an eye on these levels, traders can better navigate the complexities of market movements and make decisions that align with the prevailing market sentiment.
In summary, understanding support and resistance levels is crucial for any trader looking to enhance their price action trading skills. By identifying these key levels, traders can make more informed decisions about when to enter or exit trades, ultimately improving their chances of success in the market.
- What are support and resistance levels? Support and resistance levels are price points where the market tends to reverse or consolidate, indicating strong buying or selling pressure.
- How do I identify support and resistance levels? You can identify these levels by analyzing historical price movements, chart patterns, and using tools like moving averages and volume profiles.
- Can support and resistance levels change? Yes, support levels can become resistance levels and vice versa, especially after a price breakout.

Identifying Support Levels
Identifying support levels is a fundamental aspect of price action trading that can significantly enhance a trader's decision-making process. Support levels are essentially price points on a chart where buying interest is strong enough to overcome selling pressure. Think of these levels as a safety net for prices; when the market approaches a support level, it's like a trampoline that bounces back, indicating that buyers are stepping in to prop up the price. Recognizing these levels can help traders anticipate potential price reversals, allowing them to strategize their entries and exits more effectively.
To identify support levels, traders typically look for historical price data where the asset has previously bounced back after hitting a certain price point. This analysis can be done by examining price charts over different time frames, such as daily, weekly, or even hourly charts. The more times a price level has been tested without breaking below it, the stronger the support level is considered. For instance, if a stock has bounced off the $50 mark three times in the past few months, this level can be deemed as a significant support level.
Moreover, it’s essential to consider the context in which these support levels exist. Are they forming in a trending market or a consolidating one? A support level in a strong upward trend might carry more weight, while the same level in a sideways market could be less reliable. Traders often use additional tools to confirm the strength of these support levels. For example, they might look for volume spikes at these levels or use candlestick patterns to gauge market sentiment.
Here are some key points to remember when identifying support levels:
- Look for historical price points where the price has bounced back multiple times.
- Consider the overall market context to determine the reliability of the support level.
- Use volume analysis and candlestick patterns for additional confirmation.
By mastering the identification of support levels, traders can develop a more nuanced understanding of market dynamics, leading to more informed trading decisions. This skill not only helps in recognizing potential buying opportunities but also plays a crucial role in managing risk effectively. After all, in the world of trading, knowing where the floor is can save you from falling too hard.
- What is a support level? A support level is a price point where buying interest is strong enough to prevent the price from falling further, often leading to a price rebound.
- How can I identify support levels? Support levels can be identified by looking at historical price charts and observing where the price has bounced back multiple times.
- Why are support levels important? They help traders make informed decisions regarding entry and exit points, manage risk, and anticipate market reversals.
- Can support levels change over time? Yes, support levels can change as market conditions evolve, and new price data emerges.

Identifying Resistance Levels
Resistance levels are crucial in the realm of price action trading, acting as psychological barriers that traders often watch closely. These levels signify points at which selling interest surpasses buying pressure, leading to potential price reversals or stalls. Imagine a crowded elevator: when too many people try to enter at once, it can only hold so much before reaching its maximum capacity. Similarly, when the price reaches a resistance level, it often finds it challenging to break through due to the overwhelming selling pressure.
To identify resistance levels effectively, traders often look for previous high points on the price chart. These high points serve as clues, revealing where the market has previously struggled to push higher. For instance, if a stock has reached a peak of $100 multiple times but fails to surpass it, that $100 mark becomes a significant resistance level. Traders can visualize this through a simple line drawn across these peaks, creating what is often referred to as a resistance line.
Additionally, traders utilize various techniques to confirm resistance levels, such as:
- Multiple Touches: The more times a price level is tested without being broken, the stronger the resistance is considered. If a stock bounces off the same resistance level three or four times, it indicates a robust selling interest at that price.
- Volume Analysis: High trading volume at a resistance level can signal strong selling pressure. If traders notice that a significant number of shares are being sold as the price approaches resistance, it can reinforce the idea that this level will hold.
- Technical Indicators: Some traders use tools like moving averages or Bollinger Bands to help identify potential resistance levels. For example, if a stock price is consistently hitting its 50-day moving average from below, that moving average can act as a dynamic resistance level.
Understanding resistance levels is not just about identifying where the price might struggle; it's also about strategizing. Traders often set their exit points just below these levels to maximize profits while minimizing risk. For example, if a trader enters a position at $95 and identifies a resistance level at $100, they might choose to sell at $99 to ensure they capture gains before the price potentially reverses.
In summary, identifying resistance levels is a fundamental skill in price action trading. By recognizing these critical points, traders can make more informed decisions, enhancing their ability to navigate the often unpredictable waters of market movements. Whether you're a novice or an experienced trader, mastering the art of spotting resistance can significantly impact your trading strategy and overall success in the market.
Q: How do I know if a resistance level is strong?
A: A resistance level is considered strong if it has been tested multiple times without being breached. Additionally, high trading volume at that level can also indicate strong selling pressure.
Q: Can resistance levels change over time?
A: Yes, resistance levels can evolve as market conditions change. New highs can create new resistance levels, while a breakout above an old resistance level can turn it into a support level.
Q: Should I always sell at resistance levels?
A: While selling at resistance levels can be a good strategy, it’s essential to consider other factors, such as market trends and overall sentiment. Sometimes, prices can break through resistance, leading to further gains.

Candlestick Patterns
Candlestick patterns are like the heartbeat of the market, providing traders with vital clues about potential price movements. Each candlestick represents a specific time frame and encapsulates the open, high, low, and close prices within that period. By studying these patterns, traders can gain insights into market sentiment, helping them make informed decisions. Imagine reading a story where each candlestick is a chapter; together, they narrate the tale of market dynamics, revealing the emotions of buyers and sellers.
There are numerous candlestick patterns, each with its own significance. Some patterns indicate a potential reversal in trend, while others suggest a continuation. For instance, a Hammer pattern, characterized by a small body and a long lower shadow, often signals a bullish reversal after a downtrend. Conversely, the Engulfing pattern can indicate a strong shift in momentum, where a larger candle completely engulfs the previous one, suggesting a potential reversal. Understanding these patterns is crucial for traders looking to capitalize on market movements.
Here’s a quick overview of some common candlestick patterns:
| Pattern Name | Description | Indication |
|---|---|---|
| Hammer | Small body with a long lower shadow. | Potential bullish reversal. |
| Engulfing | A larger candle engulfs the previous one. | Potential reversal in trend. |
| Doji | Open and close prices are nearly equal. | Market indecision. |
| Morning Star | Three-candle pattern indicating a bullish reversal. | Potential bullish trend. |
By analyzing these patterns, traders can enhance their decision-making process. For example, if a trader spots a Hammer pattern after a downtrend, it may prompt them to consider entering a long position, anticipating a price increase. However, it’s essential to combine candlestick analysis with other factors, such as support and resistance levels, to confirm trading signals.
In conclusion, candlestick patterns are invaluable tools in the price action trader's toolkit. They provide a visual representation of market sentiment, allowing traders to interpret price movements more effectively. By mastering these patterns, traders can improve their ability to predict future price actions, making them more confident and strategic in their trading endeavors.
- What are candlestick patterns? Candlestick patterns are formations created by the price movements of an asset over a specific time frame, indicating potential market sentiment and future price movements.
- How do I identify candlestick patterns? Traders identify candlestick patterns by observing the shape and arrangement of candlesticks on a chart, looking for specific formations that signal potential reversals or continuations.
- Can I rely solely on candlestick patterns for trading? While candlestick patterns provide valuable insights, it’s advisable to combine them with other forms of analysis, such as support and resistance levels and market trends, to make well-informed trading decisions.

Advantages of Price Action Trading
This article explores the significance of price action trading in analyzing market trends, providing insights into its strategies, advantages, and how it differs from other trading methods.
Price action trading focuses on historical prices to make trading decisions. It emphasizes the analysis of price movements rather than relying on indicators, enabling traders to interpret market sentiment effectively.
The foundation of price action trading lies in specific principles, such as support and resistance levels, trend identification, and candlestick patterns, which help traders make informed decisions based on market behavior.
Support and resistance are critical concepts in price action trading. These levels indicate where the price tends to reverse or consolidate, guiding traders in setting entry and exit points.
Support levels represent price points where buying interest is strong enough to overcome selling pressure. Recognizing these levels can help traders anticipate potential price reversals.
Resistance levels are price points where selling interest surpasses buying pressure. Understanding these levels is essential for traders to identify potential exit points and profit-taking opportunities.
Candlestick patterns offer visual insights into market sentiment. Traders analyze these patterns to predict future price movements and enhance their decision-making process.
Price action trading provides several advantages that make it a popular choice among traders. One of the most significant benefits is its simplicity. Unlike other trading methods that may require complex indicators and calculations, price action trading relies solely on price movements. This straightforward approach allows traders to quickly grasp market dynamics without getting bogged down by technical jargon.
Another key advantage is the adaptability of price action trading across various market conditions. Whether the market is trending upward, downward, or moving sideways, price action strategies can be tailored to fit the situation. This flexibility means that traders can seize opportunities in different environments, maximizing their potential for profit.
Moreover, price action trading enhances decision-making capabilities. By focusing on real-time price movements, traders can react swiftly to market changes. This immediacy reduces reliance on lagging indicators, which can often provide outdated information. Instead, traders can make timely decisions based on current market behavior, which is crucial in fast-paced trading environments.
To illustrate the advantages further, consider the following table that summarizes key benefits of price action trading:
| Advantage | Description |
|---|---|
| Simplicity | Easy to understand and implement without complex indicators. |
| Adaptability | Can be applied in various market conditions, whether trending or ranging. |
| Enhanced Decision-Making | Allows for quick reactions to market changes, improving trading performance. |
In essence, the advantages of price action trading make it a compelling choice for traders looking to improve their performance. By simplifying the trading process, offering adaptability, and enhancing decision-making, price action trading stands out as a powerful tool in the trader's arsenal.
Understanding the differences between price action trading and other trading methods, such as technical analysis and fundamental analysis, is crucial for traders seeking to refine their strategies.
While technical indicators rely on mathematical calculations based on price and volume, price action trading emphasizes direct price movements, offering a more straightforward approach to market analysis.
Fundamental analysis evaluates economic factors influencing market movements, whereas price action trading focuses solely on price behavior. Both methods can complement each other for a comprehensive trading strategy.
- What is price action trading? Price action trading involves making trading decisions based on historical price movements rather than relying on indicators.
- How can I start price action trading? Begin by studying price charts, identifying support and resistance levels, and practicing with demo accounts.
- Is price action trading suitable for all traders? Yes, it can be adapted to various trading styles and market conditions, making it suitable for many traders.
- What are the main benefits of price action trading? Key benefits include simplicity, adaptability, and enhanced decision-making capabilities.

Flexibility in Different Market Conditions
One of the most remarkable aspects of price action trading is its inherent flexibility, which allows traders to adapt their strategies to a variety of market conditions. Whether the market is trending upward, downward, or moving sideways, price action trading provides the tools needed to navigate through these scenarios effectively. Imagine being a surfer, riding the waves; you wouldn’t just paddle out and wait for the perfect wave—you’d need to read the ocean and adjust your position accordingly. Similarly, price action traders must be agile, adjusting their tactics based on the current market dynamics.
In a trending market, where prices are consistently moving in one direction, price action traders can capitalize on momentum. They look for opportunities to enter trades in the direction of the trend, using tools like support and resistance levels to determine optimal entry and exit points. For instance, if a trader identifies a strong upward trend, they might wait for a pullback to a support level before entering a long position, maximizing their potential for profit.
Conversely, in a ranging market, where prices oscillate between defined support and resistance levels, price action traders can employ different strategies. They might focus on buying at support and selling at resistance, creating a systematic approach to trading that takes advantage of the market's natural fluctuations. This adaptability is one of the key reasons why many traders prefer price action trading over other methods that may be less versatile.
Moreover, price action trading is not limited to any specific asset class. Whether you're trading stocks, forex, commodities, or cryptocurrencies, the principles remain the same. This universality makes it an attractive option for traders who wish to diversify their portfolios without having to learn a completely new set of rules for each market. The ability to apply the same strategies across different markets means that traders can become proficient more quickly, enhancing their overall trading experience.
In summary, the flexibility of price action trading enables traders to respond effectively to changing market conditions, whether they are trending or ranging. This adaptability not only helps in identifying profitable trading opportunities but also fosters a deeper understanding of market behavior. As traders gain experience, they can refine their strategies, tailoring them to their unique trading style and the specific nuances of the markets they choose to engage with.
- What is price action trading? Price action trading is a strategy that focuses on historical price movements to make trading decisions, rather than relying on technical indicators.
- How do I identify support and resistance levels? Support levels are identified at price points where buying interest overcomes selling pressure, while resistance levels are where selling interest exceeds buying pressure.
- Can price action trading be used in any market? Yes, price action trading can be applied across various markets, including stocks, forex, commodities, and cryptocurrencies.
- What are the advantages of price action trading? Advantages include simplicity, adaptability to different market conditions, and enhanced decision-making capabilities.
Enhanced Decision-Making
When it comes to trading, the ability to make quick and informed decisions can be the difference between success and failure. Price action trading excels in this area, as it allows traders to focus on the actual movements of the market rather than getting bogged down by complex indicators. Imagine trying to navigate through a dense forest using a map filled with symbols and lines; it can be disorienting. Now, picture instead using a clear path marked by footprints. Price action trading provides that clarity, enabling traders to see the market's direction and sentiment in real-time.
One of the standout features of price action trading is its reliance on real-time data. Traders can observe how prices react to various levels of support and resistance, leading to more intuitive decision-making. This approach eliminates the lag often associated with traditional indicators, which can sometimes give false signals. For instance, while a moving average might suggest a buy signal, the price action could be indicating a strong reversal. By focusing on what the price is doing right now, traders can pivot their strategies on a dime.
Moreover, price action trading encourages a deeper understanding of market psychology. Every price movement tells a story about the collective sentiment of all market participants. By analyzing these movements, traders can gauge whether the market is bullish or bearish, and adjust their positions accordingly. This insight is invaluable, as it allows traders to anticipate potential market shifts before they happen.
To illustrate the advantages of enhanced decision-making through price action trading, consider the following key points:
- Speed: Decisions can be made in real-time, allowing traders to capitalize on fleeting opportunities.
- Simplicity: By stripping away the noise of indicators, traders can focus on price movements that matter.
- Market Sentiment: Understanding the psychology behind price movements can lead to more accurate predictions.
In essence, price action trading empowers traders to react swiftly and effectively to market dynamics. It’s like being a skilled surfer who can read the waves, anticipating when to paddle and when to ride. This adaptability not only enhances overall trading performance but also builds confidence in decision-making. As traders become more attuned to price movements, they develop a sharper intuition, which can be a game-changer in the fast-paced world of trading.
- What is price action trading?
Price action trading is a method that focuses on historical prices to make trading decisions, emphasizing price movements over technical indicators. - How does price action trading differ from other methods?
Unlike technical analysis, which relies on indicators and formulas, price action trading looks directly at price movements, making it a more straightforward approach. - Can beginners use price action trading?
Yes, price action trading is suitable for beginners as it simplifies market analysis and helps traders focus on essential price movements. - What are the advantages of price action trading?
Some advantages include enhanced decision-making, flexibility across different market conditions, and a clearer understanding of market sentiment.

Comparing Price Action Trading with Other Methods
When it comes to trading, there are multiple methods and strategies that traders can adopt. Understanding the nuances between price action trading and other popular methods is crucial for anyone looking to refine their trading strategies. Price action trading stands out primarily because it focuses solely on the movement of prices and the patterns they create, rather than relying heavily on external indicators or economic data. This direct approach can be likened to reading a book without the distractions of footnotes or commentary; it allows traders to focus on the story unfolding in the market.
Let's delve into how price action trading compares with two prominent methods: technical analysis and fundamental analysis. Each method has its own merits, but they also have distinct differences that can significantly impact trading outcomes.
Technical analysis is often characterized by the use of various indicators, such as moving averages, Bollinger Bands, and the Relative Strength Index (RSI). These indicators are derived from mathematical calculations based on price and volume data. While they can provide insights into market trends, they often lag behind price movements. In contrast, price action trading emphasizes the actual movements of price, allowing traders to react more promptly to market changes. This can be particularly beneficial in volatile markets where timing is everything. For instance, a trader using price action may spot a reversal pattern immediately on the chart, while a trader relying on indicators might miss the move due to the lag in signal generation.
On the other hand, fundamental analysis takes a broader view by evaluating economic indicators, news events, and other factors that can influence market movements. This approach is akin to understanding the background story of a character in a novel; it provides context but may not always predict immediate actions. While fundamental analysis can be invaluable for long-term trading strategies, it often does not cater to the need for quick decision-making in fast-paced markets. Price action trading, with its focus on real-time price behavior, allows traders to capitalize on short-term opportunities without getting bogged down by extensive research.
Ultimately, the choice between these methods often comes down to personal preference and trading style. Some traders may find that a combination of these approaches works best for them. For instance, they might use fundamental analysis to gauge the overall market sentiment and then apply price action techniques to execute trades efficiently. This hybrid approach can provide a more comprehensive view of the market, enabling traders to make more informed decisions.
| Method | Focus | Timeframe | Advantages |
|---|---|---|---|
| Price Action Trading | Price movements | Short to Medium Term | Quick decision-making, simplicity |
| Technical Analysis | Indicators and patterns | Medium to Long Term | Trend identification, statistical backing |
| Fundamental Analysis | Economic factors | Long Term | Contextual understanding, macroeconomic insights |
In summary, while price action trading offers a straightforward and effective method for market analysis, it is essential to understand how it fits within the broader landscape of trading strategies. By recognizing the strengths and weaknesses of each approach, traders can develop a more nuanced strategy that aligns with their trading goals.
- What is price action trading? - Price action trading is a method that focuses on analyzing historical price movements to make trading decisions without relying heavily on indicators.
- How does price action trading differ from technical analysis? - Price action trading emphasizes direct price movements, while technical analysis relies on indicators derived from price and volume data.
- Can price action trading be used in conjunction with other methods? - Yes, many traders use a combination of price action and other methods like fundamental analysis to enhance their trading strategies.
- Is price action trading suitable for beginners? - Absolutely! Its simplicity and focus on price movements make it an excellent choice for traders at all levels.
Price Action vs. Technical Indicators
When it comes to trading, one of the most common debates is whether to rely on price action trading or to utilize technical indicators. Each method has its own set of advantages and disadvantages, and understanding these can be the key to refining your trading strategy. Price action trading focuses solely on the movement of prices, providing a more direct and often clearer picture of market sentiment. On the other hand, technical indicators, which are derived from price and volume data, can offer additional insights but may also introduce complexity and lag in decision-making.
Price action trading thrives on the principle that all necessary information is reflected in the price itself. This means traders can make decisions based on current market conditions without being bogged down by mathematical formulas and indicators that might not always be accurate. For instance, consider a trader who observes a sudden spike in price with no accompanying indicator signal; they might interpret this as a strong bullish signal, whereas an indicator might take time to confirm this movement, potentially leading to missed opportunities.
In contrast, technical indicators can provide valuable insights, especially for those who are more data-oriented. Indicators such as moving averages, RSI (Relative Strength Index), or MACD (Moving Average Convergence Divergence) can help traders identify trends and potential reversal points. However, these indicators often lag behind price movements, which can result in delayed reactions to market changes. For example, if a trader waits for a moving average crossover to enter a trade, they might enter after a significant portion of the price movement has already occurred.
To illustrate the differences, let's consider a simple comparison:
| Aspect | Price Action Trading | Technical Indicators |
|---|---|---|
| Focus | Direct price movements | Calculated data from price and volume |
| Complexity | Simpler, intuitive | Can be complex, requires understanding of various indicators |
| Speed of Decision-Making | Faster, immediate reactions | Slower, often reactive |
| Market Conditions | Effective in all market conditions | May perform better in trending markets |
Ultimately, the choice between price action trading and technical indicators often comes down to personal preference and trading style. Some traders find that a combination of both methods can yield the best results, allowing them to benefit from the clarity of price action while still utilizing indicators for additional confirmation. This hybrid approach can enhance a trader's ability to navigate the complexities of the market.
In conclusion, understanding the differences between price action and technical indicators is crucial for any trader looking to sharpen their skills. Both methods have their merits, and the best strategy may involve a blend of both, tailored to fit individual trading goals and risk tolerance.
- What is price action trading? Price action trading is a method that focuses on the historical price movements of an asset to make trading decisions, without relying heavily on indicators.
- How do technical indicators work? Technical indicators use mathematical calculations based on price and volume data to help traders identify trends and potential entry or exit points.
- Can I use both price action and technical indicators? Absolutely! Many traders find that combining both methods provides a more comprehensive view of the market.
- Which method is better for beginners? Price action trading is often recommended for beginners due to its simplicity and direct focus on price movements.
Price Action vs. Fundamental Analysis
When diving into the world of trading, one of the most common debates is between price action trading and fundamental analysis. Each approach has its unique strengths and weaknesses, and understanding these can significantly impact your trading success. At its core, fundamental analysis is all about the big picture. It evaluates economic indicators, interest rates, earnings reports, and other financial metrics to determine the intrinsic value of an asset. This method is akin to looking at the health of a tree—you’re examining the roots, the trunk, and the leaves to understand how robust it is and whether it will flourish or wither.
On the flip side, price action trading is more like observing the weather patterns in a specific area. It focuses solely on the movement of prices over time, ignoring the underlying fundamentals. Traders who adopt this approach believe that all the information they need is already reflected in the price movements. They analyze charts, looking for patterns and trends, to make informed decisions. This method allows them to react swiftly to market changes, often leading to quicker trades and potentially higher profits. But does that mean one method is superior to the other? Not necessarily.
Both methods can be used in tandem to create a more robust trading strategy. For instance, a trader might use fundamental analysis to identify a potentially undervalued stock and then apply price action techniques to determine the best entry and exit points. In this way, the two methods can complement each other, providing a more comprehensive view of the market.
To illustrate the differences between these two approaches, let’s look at a simple comparison table:
| Aspect | Price Action Trading | Fundamental Analysis |
|---|---|---|
| Focus | Price movements and trends | Economic indicators and company performance |
| Timeframe | Short-term to medium-term | Long-term |
| Tools Used | Charts, candlestick patterns, support and resistance | Financial statements, economic reports, news |
| Decision Making | Reactive to price changes | Proactive based on economic forecasts |
In conclusion, while price action trading and fundamental analysis serve different purposes, they can be powerful allies in a trader's toolkit. By understanding both methods, traders can enhance their market analysis and make more informed decisions. So, whether you prefer to watch the price dance on your charts or delve into the depths of economic reports, remember that the key to successful trading often lies in a well-rounded approach.
- What is price action trading? Price action trading is a method that focuses on historical price movements to make trading decisions, without relying heavily on indicators.
- How does fundamental analysis differ from price action trading? Fundamental analysis examines economic factors and financial health, while price action trading focuses on price movements and trends.
- Can I use both methods together? Absolutely! Many traders find that combining both approaches offers a more comprehensive understanding of the market.
- Which method is better for beginners? Price action trading may be easier for beginners to grasp since it relies on direct price movements rather than complex economic data.
Frequently Asked Questions
- What is price action trading?
Price action trading is a method that focuses on analyzing historical price movements to make trading decisions. Instead of relying on indicators or complex calculations, traders observe price patterns and market sentiment to guide their strategies.
- How do support and resistance levels work in price action trading?
Support and resistance levels are crucial in price action trading. Support levels indicate price points where buying pressure is strong enough to prevent further decline, while resistance levels show where selling pressure can halt price increases. Identifying these levels helps traders set entry and exit points effectively.
- What are candlestick patterns, and why are they important?
Candlestick patterns are visual representations of price movements over a specific time period. They provide insights into market sentiment and potential future price movements. By analyzing these patterns, traders can make more informed decisions based on the behavior of buyers and sellers.
- What are the advantages of using price action trading?
Price action trading offers several advantages, including its simplicity and adaptability to different market conditions. Traders can react quickly to price changes without being bogged down by lagging indicators, enhancing their decision-making process and overall trading performance.
- How does price action trading differ from technical analysis?
While technical analysis often relies on various indicators and mathematical calculations, price action trading focuses solely on the actual price movements. This direct approach allows traders to interpret the market more intuitively and respond to changes more effectively.
- Can price action trading be used alongside fundamental analysis?
Absolutely! Price action trading can complement fundamental analysis. While fundamental analysis evaluates economic factors influencing market movements, price action trading focuses on price behavior. Combining both methods can lead to a more comprehensive trading strategy.