How to Navigate the User Interface of Crypto Exchanges
Welcome to the world of cryptocurrency trading! If you’re just dipping your toes into this thrilling realm, you might be feeling a bit overwhelmed by the user interface (UI) of crypto exchanges. But fear not! This article will guide you through the essential features of these platforms, helping you to navigate with ease and confidence. Think of the user interface as your cockpit; it’s where you’ll control your trading journey, and understanding it can mean the difference between making informed decisions and feeling lost in the digital chaos.
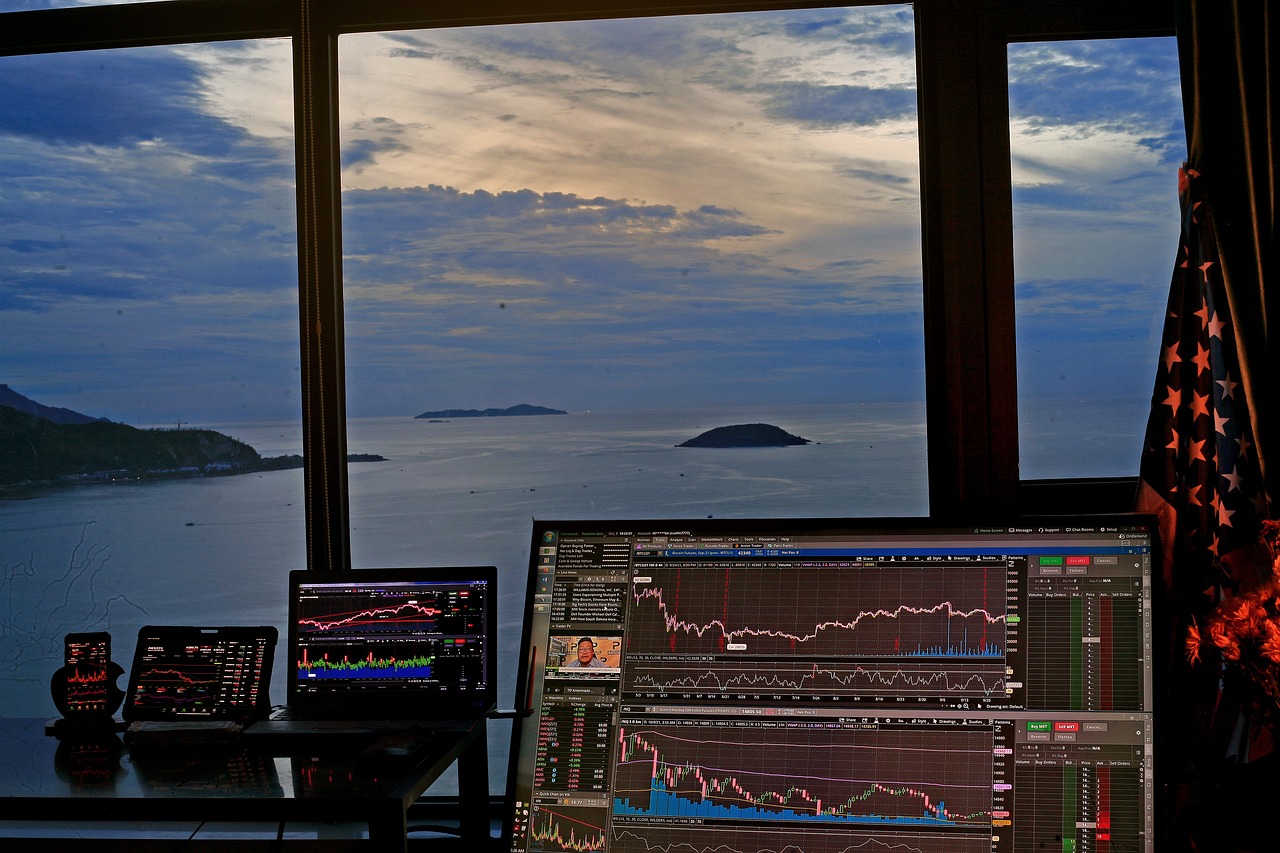
The dashboard is the central hub of any crypto exchange. Imagine it as your command center, displaying vital information such as your account balances, market trends, and recent transactions. A well-designed dashboard will provide you with an overview of your trading activity and the current market landscape, helping you make informed decisions. When you log in, you’ll typically see a snapshot of your portfolio’s performance alongside real-time price charts and market news. This information is crucial for keeping your finger on the pulse of the crypto world.
Many exchanges allow you to customize your dashboard, so take advantage of this feature. You can usually rearrange widgets or select which data is displayed prominently. This customization makes it easier to focus on the information that matters most to you. For instance, if you’re interested in trading Bitcoin and Ethereum, ensure those charts are front and center on your dashboard.
Now that you’re familiar with the dashboard, let’s dive into the different order types available on crypto exchanges. Understanding these order types is crucial for executing trades effectively and minimizing risks. Here’s a quick rundown of the main types you’ll encounter:
- Market Orders: These are used to buy or sell cryptocurrencies at the current market price.
- Limit Orders: These allow you to set a specific price at which you want to buy or sell.
- Stop Orders: These are designed to limit losses by triggering a market order once a specified price is reached.
Market orders are the simplest type of order. When you place a market order, you’re instructing the exchange to buy or sell your chosen cryptocurrency at the best available price. This is particularly useful when you want to execute a trade quickly, especially in a volatile market where prices can change rapidly.
One of the biggest advantages of market orders is their speed. They allow for quick execution, making them ideal for traders looking to capitalize on immediate price movements. In a bustling market, every second counts, and market orders can help you seize opportunities before they slip away. However, this speed comes with its own set of challenges.
While market orders are fast, they can lead to slippage, especially in volatile conditions. Slippage occurs when the execution price differs from the expected price, which can happen if there aren’t enough orders at your desired price level. This is particularly important to keep in mind during times of high volatility, where prices can fluctuate wildly within seconds.
Limit orders, on the other hand, allow you to set specific price points for buying or selling cryptocurrencies. This means you can control the price at which your order is executed. For example, if you want to buy Bitcoin at $30,000, you can place a limit order at that price. If the market reaches your desired price, your order will be executed. This strategy can help you avoid the pitfalls of slippage.
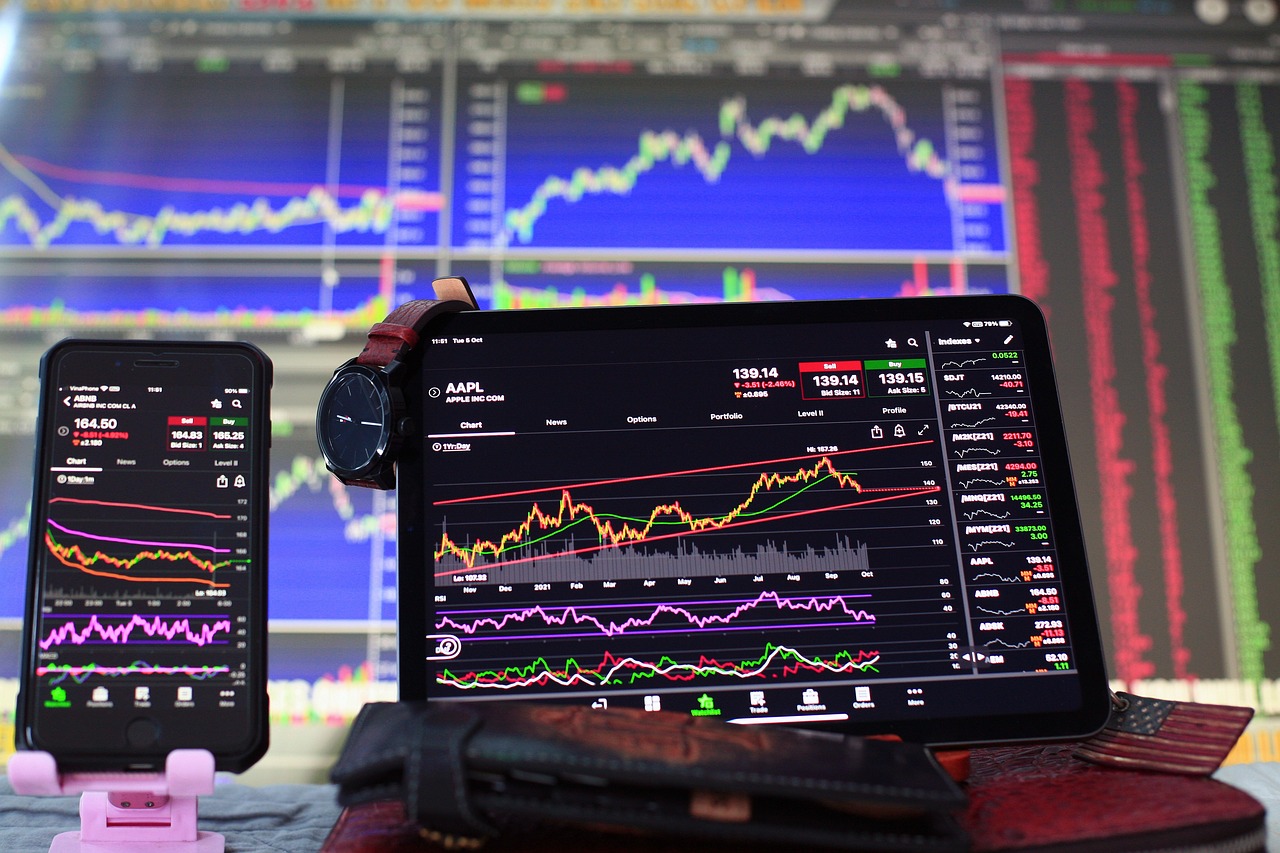
Charts and technical indicators are essential tools for traders. They provide visual representations of price movements and help you identify trends. Understanding how to read price charts and utilize various indicators can significantly enhance your trading strategies. For instance, candlestick charts are popular among traders for their ability to convey a wealth of information in a compact form. Learning how to interpret candlestick patterns can give you insights into market sentiment and potential price movements.
Candlestick charts provide visual insights into price movements over time. Each candlestick represents a specific time frame and shows the open, high, low, and close prices. By analyzing these patterns, you can identify bullish and bearish trends, which can help you make better trading decisions. It’s like reading a story about the market's behavior—each candlestick tells you what happened during that time period.
Technical indicators, such as the Relative Strength Index (RSI) and Moving Average Convergence Divergence (MACD), are essential for analyzing market trends. These tools can help you understand whether a cryptocurrency is overbought or oversold, allowing you to make more informed trading decisions. Incorporating these indicators into your trading strategy can enhance your ability to predict market movements and time your trades more effectively.
Q: What is a crypto exchange?
A: A crypto exchange is a platform where you can buy, sell, or trade cryptocurrencies. They act as intermediaries between buyers and sellers.
Q: How do I choose the right crypto exchange?
A: Look for factors such as security features, user interface, fees, and the range of cryptocurrencies offered. Research reviews and compare different platforms to find the best fit for your trading needs.
Q: Can I use a crypto exchange on my mobile device?
A: Yes, most exchanges offer mobile apps or mobile-friendly websites, allowing you to trade on the go.

Understanding the Dashboard
The dashboard is the central hub of any crypto exchange, serving as your command center for all trading activities. Imagine it as the cockpit of an airplane; everything you need to navigate the turbulent skies of cryptocurrency is right at your fingertips. When you log into your chosen exchange, the dashboard greets you with a wealth of information that can feel overwhelming at first, but once you get the hang of it, it becomes an invaluable tool for making informed decisions.
At the top of the dashboard, you’ll typically find your account balances. This section displays the total amount of each cryptocurrency you hold, along with the equivalent value in your local currency. Keeping an eye on this area is crucial, as it helps you gauge your overall portfolio performance. Below your balances, you’ll often see market trends presented through various charts and graphs. These visual representations can help you understand how different cryptocurrencies are performing over time, allowing you to spot potential opportunities or risks.
Another vital component of the dashboard is the recent transactions section. Here, you can track your trading history, including buys, sells, and any fees incurred. This feature is particularly useful for analyzing your past performance and refining your trading strategies. If you’re serious about trading, you might want to keep a close watch on your transaction history to identify patterns in your trading behavior.
Many dashboards also include a section for market news or updates, which can provide insights into factors affecting cryptocurrency prices. Staying informed about the latest developments in the crypto world can give you an edge over other traders who might not be as vigilant. Additionally, some exchanges offer customizable widgets that allow you to tailor your dashboard to your preferences, displaying the information that matters most to you.
To give you a clearer picture, here’s a simple breakdown of what you might typically find on a crypto exchange dashboard:
| Feature | Description |
|---|---|
| Account Balances | Your total holdings in various cryptocurrencies along with their fiat value. |
| Market Trends | Charts and graphs showing price movements and trends of cryptocurrencies. |
| Recent Transactions | A history of your trades, including buys, sells, and fees paid. |
| Market News | Latest updates and news articles relevant to cryptocurrency markets. |
| Custom Widgets | Personalized features that allow you to display preferred information. |
As you become more familiar with the dashboard, you'll find that it’s not just a collection of numbers and graphs; it’s a dynamic tool that can enhance your trading experience. By regularly checking your dashboard, you can stay ahead of market trends and make timely decisions. Remember, in the world of cryptocurrency, timing can be everything, and having a well-organized dashboard can be the difference between a missed opportunity and a profitable trade.
Order Types Explained
When diving into the world of crypto trading, understanding order types is crucial for making effective and strategic decisions. The types of orders you can place on a crypto exchange are not just technical jargon; they are essential tools that can either make or break your trading experience. Each order type serves a unique purpose and can significantly impact your trading outcomes. In this section, we’ll break down the most common order types, helping you navigate the complex waters of cryptocurrency trading.
First up, we have the market order, which is the simplest and most straightforward. A market order allows you to buy or sell a cryptocurrency at the current market price. Imagine you're at a bustling market, and you want to grab the freshest fruit available. You wouldn't haggle over the price; you’d just buy it at whatever the seller is asking. Similarly, market orders execute trades almost instantly at the best available price. This makes them ideal for traders looking to capitalize on immediate price movements.
However, while market orders are quick and efficient, they do come with their own set of challenges. One of the most significant drawbacks is the risk of slippage. Slippage occurs when the market price changes between the time you place your order and when it is executed. In highly volatile markets, this can lead to you buying or selling at a price that is significantly different from what you expected. It’s like trying to catch a bus that suddenly speeds away just as you’re about to hop on. So, while market orders are great for speed, they can lead to unexpected costs.
Next, let’s talk about limit orders. Unlike market orders, limit orders allow you to set a specific price at which you want to buy or sell a cryptocurrency. Think of it like setting a personal budget before shopping. If you only want to buy apples for $1 each, you won’t buy them at $1.50, right? Similarly, with a limit order, you can specify the price you’re willing to pay or receive. This gives you more control over your trades and can help you avoid the pitfalls of slippage.
Limit orders are particularly useful in a fluctuating market where prices can swing wildly. By setting your limit, you can wait for the market to come to you rather than chasing after it. However, the downside is that your order may not be executed at all if the market price doesn’t reach your specified limit. It’s a balancing act between patience and opportunity.
To summarize, here’s a quick comparison of market and limit orders:
| Order Type | Execution Speed | Price Control | Risk of Slippage |
|---|---|---|---|
| Market Order | Fast | None (current market price) | High |
| Limit Order | Variable (depends on market price) | Yes (set by user) | None (if executed at limit price) |
In conclusion, understanding the different order types is fundamental for anyone looking to trade cryptocurrencies effectively. Whether you choose to use market orders for speed or limit orders for control, each type has its advantages and disadvantages. The key is to align your trading strategy with your goals and risk tolerance. So, before jumping into a trade, take a moment to consider which order type best suits your needs.
Here are some common questions that new traders often ask about order types:
- What is the best order type for beginners? Market orders are typically easier for beginners as they execute immediately at the current price.
- Can I cancel an order once it's placed? Yes, both market and limit orders can usually be canceled before they are executed.
- Is it possible to combine order types? Yes, some traders use a combination of market and limit orders to optimize their trading strategies.
Market Orders
Market orders are one of the simplest and most straightforward ways to buy or sell cryptocurrencies. When you place a market order, you’re essentially telling the exchange, “I want to buy or sell this cryptocurrency at the best available price right now.” This type of order is executed almost instantly, making it a popular choice among traders who want to take advantage of rapid price movements.
Imagine you’re at a bustling market where vendors are shouting out prices for their goods. If you spot a vendor selling your favorite fruit at a great price, you wouldn’t hesitate to grab it, right? That’s exactly how market orders work in the crypto world. You’re seizing the opportunity without waiting for a better deal, which can be crucial in a fast-paced trading environment.
However, while market orders are quick and easy, they come with their own set of pros and cons. One major advantage is the speed of execution. If you’re looking to jump on a price spike or cut your losses quickly, a market order can be your best friend. It’s like hitting the gas pedal when you see a green light—fast and direct. But, there’s a flip side to this convenience. In volatile markets, the price at which your order gets executed can be different from what you anticipated, a phenomenon known as slippage.
To illustrate how slippage can affect your trades, consider the following table:
| Scenario | Expected Price | Executed Price | Slippage |
|---|---|---|---|
| Buying during a price surge | $100 | $105 | +$5 |
| Selling during a market dip | $50 | $45 | -$5 |
As shown in the table, if you place a market order during a sudden price surge, you might end up paying much more than you expected. Conversely, if you’re selling during a downturn, you could receive less than anticipated. This unpredictability is why some traders prefer to use market orders sparingly or in conjunction with other order types.
In conclusion, market orders are a powerful tool for traders who prioritize speed and convenience. They allow you to act quickly in a fast-moving market, but be aware of the potential for slippage. Understanding when and how to use market orders effectively can significantly enhance your trading strategy. So, the next time you’re ready to make a move, weigh the pros and cons and decide if a market order is the right choice for you.
- What is the main advantage of using market orders?
Market orders offer quick execution, making them ideal for traders looking to capitalize on immediate price movements. - Can market orders lead to unexpected prices?
Yes, in volatile markets, market orders can experience slippage, leading to execution at a price different from what you expected. - When should I use market orders?
Market orders are best used when you need to buy or sell quickly and are okay with the current market price.
Advantages of Market Orders
When it comes to trading on crypto exchanges, market orders are often the go-to choice for many traders, and for good reason. One of the biggest advantages of market orders is their speed of execution. Imagine you're at a concert, and the band is about to play your favorite song. You wouldn't want to miss it, right? That's how market orders work—they allow you to jump into a trade at the current market price without delay. This is particularly beneficial in the fast-paced world of cryptocurrency, where prices can change in the blink of an eye.
Another significant advantage is liquidity. Market orders are executed immediately, which means you're more likely to find a buyer or seller willing to complete the transaction. This is crucial in a market that can be as volatile as cryptocurrencies. Think of it like trying to sell lemonade on a hot day; if the demand is high, you'll sell out quickly. In crypto trading, a market order ensures that you can buy or sell your assets swiftly, taking advantage of favorable market conditions.
Moreover, market orders are incredibly user-friendly. For beginners, they simplify the trading process. You don’t need to worry about complex strategies or setting specific prices. Just hit that buy or sell button, and you're in. This accessibility can make a world of difference for someone just starting their trading journey. It’s like learning to ride a bike; once you get the hang of it, you can focus on enjoying the ride instead of worrying about balance.
However, while market orders have their perks, it's essential to be aware of the potential downsides, such as slippage during extreme market fluctuations. But if you're looking for speed and simplicity, market orders are hard to beat. They allow you to react quickly to market changes, making them a vital tool for any trader's arsenal.
- What is a market order? A market order is a type of order to buy or sell a cryptocurrency immediately at the best available price.
- When should I use a market order? Use a market order when you want to execute a trade quickly and are less concerned about the exact price.
- Are there risks associated with market orders? Yes, the primary risk is slippage, which occurs when the market price changes between the time you place the order and when it is executed.
- Can I cancel a market order? Once a market order is placed, it cannot be canceled as it is executed immediately.

Disadvantages of Market Orders
While market orders may seem like the perfect solution for traders looking to jump on price movements quickly, they come with their own set of challenges. One of the most significant disadvantages is the potential for slippage. Slippage occurs when the price at which your order is executed differs from the expected price, particularly in highly volatile markets. Imagine you're trying to buy Bitcoin at $40,000, but by the time your order is executed, the price has jumped to $40,200. That’s a $200 difference that could have been avoided with a different order type.
Another downside of market orders is the lack of control over the execution price. When you place a market order, you're essentially saying, "I want to buy or sell now, no matter the price." This can be a double-edged sword. In a fast-moving market, you might end up paying more than you anticipated or selling for less. This unpredictability can lead to unwanted losses, especially for inexperienced traders who might not fully understand market dynamics.
Additionally, market orders can lead to overtrading. The ease of executing these orders might tempt traders to make impulsive decisions based on short-term market fluctuations rather than sticking to a well-thought-out trading strategy. This can be particularly detrimental in a market as unpredictable as cryptocurrency, where emotional trading can lead to significant financial setbacks.
Lastly, during periods of extreme market conditions, such as flash crashes or rapid price spikes, market orders can exacerbate losses. In these moments, liquidity can dry up, leading to orders being filled at much worse prices than expected. For instance, if a sudden market downturn occurs, your market sell order may execute at a price far below your intended sell point, resulting in a larger loss than you had planned for.
In conclusion, while market orders offer speed and convenience, they come with risks that traders need to be aware of. Understanding these disadvantages is crucial for developing a balanced trading strategy that minimizes risks while maximizing potential gains. Always consider your options and think twice before hitting that "buy" or "sell" button!
- What is slippage? Slippage is the difference between the expected price of a trade and the actual price at which the trade is executed, often occurring in fast-moving markets.
- Are market orders always the best choice? Not necessarily. While they are quick and easy, they can lead to unexpected losses, especially in volatile markets.
- How can I minimize the risks of market orders? Consider using limit orders or setting stop-loss orders to control the price at which you buy or sell.

Limit Orders
Limit orders are a powerful tool in the arsenal of any cryptocurrency trader. They allow you to set a specific price at which you want to buy or sell a cryptocurrency, giving you greater control over your trades. Imagine you’re at a market, and instead of just buying the first apple you see, you wait until the vendor offers it at your desired price. That’s essentially what a limit order does for you in the world of crypto trading.
To place a limit order, you simply specify the price you’re willing to pay (for a buy order) or the price you want to receive (for a sell order). If the market reaches that price, your order is executed automatically. This feature is particularly beneficial in a volatile market where prices can fluctuate wildly within minutes. By setting a limit order, you can protect yourself from unexpected price swings and ensure that you only buy or sell at the price you’re comfortable with.
Limit orders can be particularly advantageous in several scenarios:
- Strategic Buying and Selling: You can wait for the market to reach your target price, allowing you to optimize your entry and exit points.
- Reduced Emotional Trading: By setting a limit order, you can take emotion out of the equation. You won’t be tempted to make impulsive decisions based on fear or greed.
- Flexibility: You can set multiple limit orders at different price points, creating a more nuanced trading strategy.
However, it’s essential to understand that limit orders are not without their drawbacks. For instance, if the market price never reaches your specified limit, your order will remain unfilled. This means that you could miss out on potential trading opportunities. Additionally, in rapidly moving markets, there may be instances where your limit order is executed at a price that’s less favorable than expected, especially if there’s a sudden spike or drop in price.
To give you a clearer picture, here’s a simple table illustrating the differences between market orders and limit orders:
| Order Type | Execution Speed | Price Control | Risk of Slippage |
|---|---|---|---|
| Market Order | Immediate | None | High |
| Limit Order | Conditional | Yes | Low |
In conclusion, limit orders are a fantastic way to enhance your trading strategy, especially if you prefer to have more control over your transactions. They allow you to wait for the right moment to execute a trade, potentially maximizing your profits while minimizing risks. Just remember that patience is key; sometimes, the market may not hit your target price, but the peace of mind that comes with having a plan is invaluable.

Using Charts and Indicators
When diving into the world of cryptocurrency trading, understanding how to use charts and indicators is like having a treasure map in a vast ocean of information. Charts visually represent price movements, while indicators help you analyze those movements to make informed decisions. Imagine trying to navigate a ship without a compass; that’s how it feels to trade without these essential tools.
First off, let’s talk about price charts. These are graphical representations of how the price of a cryptocurrency has changed over time. They can be viewed in various time frames, from minutes to months, depending on your trading strategy. The most common type of chart used is the candlestick chart, which provides a wealth of information at a glance. Each candlestick shows the opening, closing, highest, and lowest prices within a specific period, allowing traders to gauge market sentiment quickly.
To get the most out of candlestick charts, it's crucial to understand the patterns they form. For example, a series of green candlesticks indicates bullish sentiment, while red candlesticks suggest bearish trends. Recognizing these patterns can help you anticipate price movements and make timely decisions. Think of it as reading the mood of the market; just like how you can tell if a party is lively or dull by observing the crowd.
Candlestick patterns can be simple or complex, but some are particularly significant. Here are a few common patterns to keep an eye out for:
- Doji: Indicates indecision in the market.
- Hammer: Suggests a potential reversal after a downtrend.
- Engulfing Pattern: Indicates a strong reversal signal when a small candlestick is followed by a larger one.
By learning to identify these patterns, you can make smarter trading decisions that align with market movements.
Next, let’s explore technical indicators. These are mathematical calculations based on price, volume, or open interest that traders use to forecast future price movements. Some of the most popular indicators include the Relative Strength Index (RSI) and the Moving Average Convergence Divergence (MACD).
The RSI is a momentum oscillator that measures the speed and change of price movements. It ranges from 0 to 100 and is typically used to identify overbought or oversold conditions. A value above 70 may indicate that a cryptocurrency is overbought, while a value below 30 may suggest it is oversold. This can be a signal to enter or exit trades.
On the other hand, the MACD is a trend-following momentum indicator that shows the relationship between two moving averages of a security’s price. Traders look for crossovers of the MACD line and the signal line to identify potential buy or sell signals. It’s like having a seasoned navigator guiding you through choppy waters.
Using a combination of charts and indicators can significantly enhance your trading strategy. For instance, you might spot a bullish pattern on a candlestick chart and confirm it with an RSI reading, giving you more confidence in your trade. However, always remember that no indicator is foolproof; they are merely tools to assist you in making informed decisions.
In summary, mastering charts and indicators is vital for anyone looking to thrive in the crypto trading arena. They not only provide insights into market dynamics but also help you understand the psychology behind price movements. So, grab your tools, study the charts, and get ready to navigate the exciting world of cryptocurrency trading!
Q: What is the best chart type for beginners?
A: Candlestick charts are highly recommended for beginners as they provide detailed information about price movements in a visually intuitive format.
Q: How can I effectively use indicators in my trading strategy?
A: Start by learning a few key indicators, like RSI and MACD, and practice using them in conjunction with price charts to confirm trading signals.
Q: Are indicators always reliable?
A: While indicators can provide valuable insights, they should not be solely relied upon. Always consider market context and combine multiple indicators for better accuracy.

Understanding Candlestick Charts
Candlestick charts are one of the most popular tools for traders, and for good reason! They provide a visually appealing and informative way to analyze price movements over a specified period. Each candlestick represents four key pieces of information: the open, high, low, and close prices of an asset during a specific time frame. By observing these candles, traders can gauge market sentiment and make informed decisions.
So, how does it all work? Imagine each candlestick as a tiny story about the price action in a given timeframe. The body of the candlestick is formed between the open and close prices, while the wicks (or shadows) extend to the high and low prices. If the close price is higher than the open price, the candle is typically colored green (or white), indicating bullish sentiment. Conversely, if the close price is lower than the open price, it’s usually colored red (or black), signaling bearish sentiment.
To truly master candlestick charts, it's crucial to understand some common patterns that can provide insights into future price movements. Here are a few key patterns you should know:
- Doji: A doji occurs when the open and close prices are virtually the same, indicating indecision in the market.
- Hammer: This pattern appears after a downtrend and suggests a potential reversal. It has a small body with a long lower wick.
- Engulfing Pattern: This consists of two candles where the second one completely engulfs the first, signaling a potential trend reversal.
Understanding these patterns can help traders anticipate market movements. For instance, if you spot a hammer after a downtrend, it might be time to consider a buying opportunity. However, it’s essential to combine candlestick analysis with other technical indicators to confirm your trading decisions.
Moreover, the time frame you choose for your candlestick chart can significantly impact your analysis. Short-term traders might prefer 5-minute or hourly charts, while long-term investors may look at daily, weekly, or even monthly charts. Each time frame tells a different story and can help you spot trends or reversals that align with your trading strategy.
In summary, mastering candlestick charts is an invaluable skill for any trader. They not only provide a clear visual representation of price action but also offer insights into market psychology. By recognizing patterns and understanding the underlying emotions of buyers and sellers, you can enhance your trading strategy and make more informed decisions.
Q: What is a candlestick chart?
A: A candlestick chart is a type of financial chart that displays the price movements of an asset over a specified period, using candlesticks to represent open, high, low, and close prices.
Q: How do I read a candlestick chart?
A: To read a candlestick chart, look at the body of the candle to determine the opening and closing prices, and examine the wicks to identify the highest and lowest prices during the time frame.
Q: What are some common candlestick patterns?
A: Some common patterns include the Doji, Hammer, and Engulfing Pattern. Each pattern can indicate potential market reversals or continuations.
Q: Can I use candlestick charts for long-term trading?
A: Yes, candlestick charts can be used for both short-term and long-term trading. The key is to choose the appropriate time frame that aligns with your trading strategy.
Popular Technical Indicators
When it comes to trading cryptocurrencies, understanding technical indicators is like having a secret weapon in your arsenal. These indicators are mathematical calculations based on the price, volume, or open interest of a security or contract. They help traders make sense of market trends and predict future price movements. Among the myriad of indicators out there, a few stand out as particularly useful for both novice and seasoned traders.
One of the most popular indicators is the Relative Strength Index (RSI). This momentum oscillator measures the speed and change of price movements. The RSI ranges from 0 to 100, and typically, an RSI above 70 indicates that a cryptocurrency is overbought, while an RSI below 30 suggests it is oversold. By keeping an eye on the RSI, traders can identify potential reversals in market trends, helping them to make more informed decisions.
Another key player in the world of technical indicators is the Moving Average Convergence Divergence (MACD). The MACD is a trend-following momentum indicator that shows the relationship between two moving averages of a security's price. It's calculated by subtracting the 26-period exponential moving average (EMA) from the 12-period EMA. The result is the MACD line. Traders often look for crossovers of the MACD line and the signal line (which is the 9-period EMA of the MACD) to identify potential buy or sell signals. This indicator is particularly useful in trending markets.
To give you a clearer picture of how these indicators work, let’s look at a comparison table:
| Indicator | Type | Purpose | Key Levels |
|---|---|---|---|
| Relative Strength Index (RSI) | Momentum | Identifies overbought or oversold conditions | Above 70 (Overbought), Below 30 (Oversold) |
| Moving Average Convergence Divergence (MACD) | Trend-following | Identifies potential buy/sell signals | Crossovers of MACD and Signal Line |
But that's not all! Another widely used indicator is the Simple Moving Average (SMA). This indicator smooths out price data by creating a constantly updated average price. Traders often use the SMA to identify the overall direction of the market. For instance, a crossing of the short-term SMA above a long-term SMA can signal a bullish trend, while the opposite can indicate a bearish trend.
Moreover, for those who love diving deeper into market analysis, the Bollinger Bands can be a game-changer. This indicator consists of a middle band (the SMA) and two outer bands that are standard deviations away from the SMA. The bands expand and contract based on market volatility. When prices touch the upper band, it could signify an overbought condition, while touching the lower band might indicate an oversold condition. This dynamic can guide traders in making timely decisions.
As you can see, technical indicators are invaluable tools that can enhance your trading strategy. By combining multiple indicators, traders can gain a more comprehensive understanding of market movements, helping them to make smarter trades. However, remember that no indicator is foolproof. Always combine your analysis with other forms of research and market awareness.
- What are technical indicators? Technical indicators are tools used to analyze price movements and market trends, aiding traders in making informed decisions.
- How do I choose the right indicator? The right indicator depends on your trading style and strategy. Experiment with different indicators to see which ones work best for you.
- Can I rely solely on technical indicators for trading? While technical indicators are helpful, it’s crucial to combine them with fundamental analysis and market news for a well-rounded approach.
Frequently Asked Questions
- What is a crypto exchange?
A crypto exchange is a platform that allows you to buy, sell, and trade cryptocurrencies. Think of it as a marketplace where digital currencies are exchanged, similar to how a stock exchange works for stocks. Users can trade various cryptocurrencies against each other or against fiat currencies like USD or EUR.
- How do I create an account on a crypto exchange?
Creating an account on a crypto exchange is usually straightforward. You typically need to provide your email address, create a password, and verify your identity through documents like a government-issued ID. Once your account is verified, you can start trading!
- What are market and limit orders?
Market orders let you buy or sell a cryptocurrency immediately at the current market price. In contrast, limit orders allow you to set a specific price at which you want to buy or sell. This means you can control the price you pay or receive, but the trade may not execute if the market doesn't reach your set price.
- Why should I use limit orders instead of market orders?
Limit orders can be advantageous because they enable you to set your preferred price, helping you avoid unexpected costs from price fluctuations. While market orders execute quickly, they can lead to slippage, where you end up buying or selling at a less favorable price, especially in volatile markets.
- What are candlestick charts?
Candlestick charts are a popular way to visualize price movements over time. Each "candlestick" represents the opening, closing, high, and low prices within a specific time frame. They help traders identify trends and patterns, making it easier to make informed trading decisions.
- How can I use technical indicators in trading?
Technical indicators, like the Relative Strength Index (RSI) and Moving Average Convergence Divergence (MACD), help traders analyze market trends and price movements. By incorporating these indicators into your trading strategy, you can identify potential buy or sell signals based on historical data.
- Is trading on a crypto exchange safe?
While many exchanges implement robust security measures, trading in cryptocurrencies always carries risks. It’s essential to use exchanges with strong security protocols, enable two-factor authentication, and keep your funds in a secure wallet when not actively trading.
- What should I do if I forget my password?
If you forget your password, most exchanges have a "Forgot Password" option. You’ll typically need to provide your email address, and they’ll send you a link to reset your password. Make sure to choose a strong password that you can remember!