The Role of Data Analysis in Trading Strategies
In today's fast-paced financial markets, the significance of data analysis cannot be overstated. It acts as the backbone of successful trading strategies, providing traders with the insights they need to navigate the complexities of buying and selling assets. Imagine trying to find your way in a dense fog without a map; that's what trading without data analysis feels like. By leveraging data, traders can uncover patterns, make informed decisions, and ultimately boost their profitability.
Data analysis is not just about crunching numbers; it’s about transforming raw data into actionable intelligence. Whether you're a seasoned trader or just starting, understanding how to analyze data can significantly enhance your trading approach. It’s like having a secret weapon in your trading arsenal. The ability to sift through mountains of data and extract meaningful insights allows traders to anticipate market movements and adjust their strategies accordingly.
Moreover, the integration of data analysis into trading strategies fosters a more disciplined approach. Instead of relying on gut feelings or market rumors, traders can base their decisions on solid evidence. This shift from intuition to analysis is akin to switching from a chaotic game of chance to a well-planned chess match. Each move is calculated, each decision backed by data, leading to greater confidence and improved outcomes.
As we delve deeper into the world of data analysis in trading, we will explore various types of data, including historical price data, volume statistics, and real-time market information. Each type plays a crucial role in shaping trading strategies and enhancing decision-making processes. By the end of this article, you’ll not only understand the importance of data analysis but also how to apply it effectively in your trading endeavors.
Data analysis involves inspecting, cleansing, and modeling data to discover useful information. In trading, it helps traders identify patterns and trends, guiding them in making informed decisions.
Traders utilize various data types, including historical price data, volume statistics, and economic indicators. Understanding these data types is crucial for developing effective trading strategies.
Historical price data provides insights into past market behavior, allowing traders to identify trends and make predictions about future price movements. Analyzing this data is essential for backtesting strategies.
Chart patterns, derived from historical price data, help traders recognize potential market reversals or continuations. Familiarity with these patterns can enhance decision-making and strategy development.
Technical indicators, such as moving averages and RSI, are derived from historical data to provide additional insights. They assist traders in identifying entry and exit points in their strategies.
Volume analysis examines the number of shares traded over a specific period. It plays a crucial role in confirming trends and understanding market strength, aiding traders in making better decisions.
Real-time data is vital for traders as it allows them to react swiftly to market changes. Accessing up-to-date information can significantly impact trading outcomes.
Staying informed about market news and events is essential for traders. Major announcements can lead to volatility, making real-time data analysis critical for successful trading strategies.
Algorithmic trading relies heavily on data analysis to execute trades automatically based on predefined criteria. Understanding the role of algorithms can enhance trading efficiency and profitability.
- What is data analysis in trading? - Data analysis in trading refers to the process of inspecting and interpreting data to make informed trading decisions.
- Why is historical price data important? - Historical price data helps traders understand past market behavior, identify trends, and backtest strategies.
- How does volume analysis aid trading? - Volume analysis provides insights into market strength and helps confirm trends, influencing trading decisions.
- What role does real-time data play in trading? - Real-time data allows traders to react quickly to market changes, which is crucial for maximizing trading opportunities.

Understanding Data Analysis
Data analysis is like the compass for traders navigating the vast ocean of financial markets. It involves a meticulous process of inspecting, cleansing, and modeling data to unveil insights that are crucial for making informed trading decisions. Imagine trying to find your way in a dense fog without a map or a compass; that’s what trading can feel like without proper data analysis. By analyzing data, traders can identify patterns, trends, and correlations that might otherwise go unnoticed, allowing them to make decisions that are not only educated but also timely.
At its core, data analysis in trading is all about transforming raw data into actionable insights. This transformation is crucial because, in the fast-paced world of trading, every second counts. Traders need to be able to quickly interpret data to seize opportunities or mitigate risks. For instance, a trader might analyze historical price movements to predict future trends, or they may look at trading volumes to gauge market strength. The ability to distill complex data into simple, understandable insights is what sets successful traders apart from the rest.
Moreover, data analysis is not just about looking at numbers; it’s about understanding the stories behind those numbers. For example, a sudden spike in trading volume might indicate a significant market event or shift in investor sentiment. By digging deeper into the data, traders can uncover the underlying factors driving market movements. This level of understanding can give traders a competitive edge, allowing them to anticipate market trends before they happen.
In today’s digital age, the tools available for data analysis are more sophisticated than ever. From spreadsheets to advanced statistical software and machine learning algorithms, traders have a wealth of resources at their fingertips. These tools can help automate the data analysis process, making it faster and more efficient. However, it’s essential for traders to understand the limitations of these tools as well. Data analysis is as much an art as it is a science, requiring intuition and experience to interpret the results correctly.
Ultimately, the goal of data analysis in trading is to enhance decision-making. By leveraging data effectively, traders can increase their chances of profitability while minimizing risks. Whether it’s through identifying trends, forecasting price movements, or understanding market sentiment, data analysis serves as the backbone of successful trading strategies.

Types of Data Used in Trading
When it comes to trading in financial markets, the type of data you utilize can make all the difference. Traders rely on a myriad of data sources to enhance their strategies, and understanding these data types is crucial for anyone looking to succeed in trading. The most prominent types of data include historical price data, volume statistics, and economic indicators. Each of these data types plays a unique role in shaping trading decisions and strategies.
Historical price data is perhaps the most fundamental type of data used by traders. It encompasses the past prices of a security over a specific period, giving traders insights into how the market has behaved historically. By analyzing this data, traders can identify trends and make informed predictions about future price movements. For instance, if a trader notices that a stock has consistently risen after a certain price point, they might decide to buy when it approaches that level again. This is where the importance of backtesting strategies comes into play, allowing traders to see how their strategies would have performed based on historical data.
Another crucial type of data is volume statistics. Volume refers to the number of shares or contracts traded in a given period and is essential for confirming trends. For example, if a stock's price is rising but the volume is low, it might indicate a lack of conviction in that move. Conversely, a price increase accompanied by high volume can signal strong buying interest, making it a more reliable indicator. This insight allows traders to gauge market strength and make better decisions regarding when to enter or exit trades.
In addition to historical price and volume data, economic indicators play a vital role in trading strategies. These indicators provide insights into the overall health of the economy and can influence market movements. Some key economic indicators include:
- Gross Domestic Product (GDP): Measures the overall economic output and growth.
- Unemployment Rate: Indicates the health of the labor market.
- Consumer Price Index (CPI): Reflects inflation and purchasing power.
- Interest Rates: Affect borrowing costs and consumer spending.
By keeping an eye on these indicators, traders can better anticipate market reactions to economic news and adjust their strategies accordingly. For instance, if a central bank announces a rate hike, it might lead to a sell-off in stocks, prompting traders to reassess their positions.
In summary, the types of data used in trading are diverse and crucial for developing effective strategies. Whether it's analyzing historical price movements, examining trading volumes, or keeping track of economic indicators, each data type contributes to a trader's ability to make informed decisions. As the financial markets continue to evolve, staying updated on these data types will be key to enhancing trading strategies and achieving greater profitability.
- What is the most important type of data for trading?
While all types of data are important, historical price data is often considered the foundation for making informed trading decisions. - How can volume statistics impact trading decisions?
Volume statistics help confirm trends and provide insights into market strength, enabling traders to make more reliable decisions. - Why are economic indicators important for traders?
Economic indicators provide insights into the overall health of the economy, which can significantly influence market movements and trading strategies.
Historical Price Data
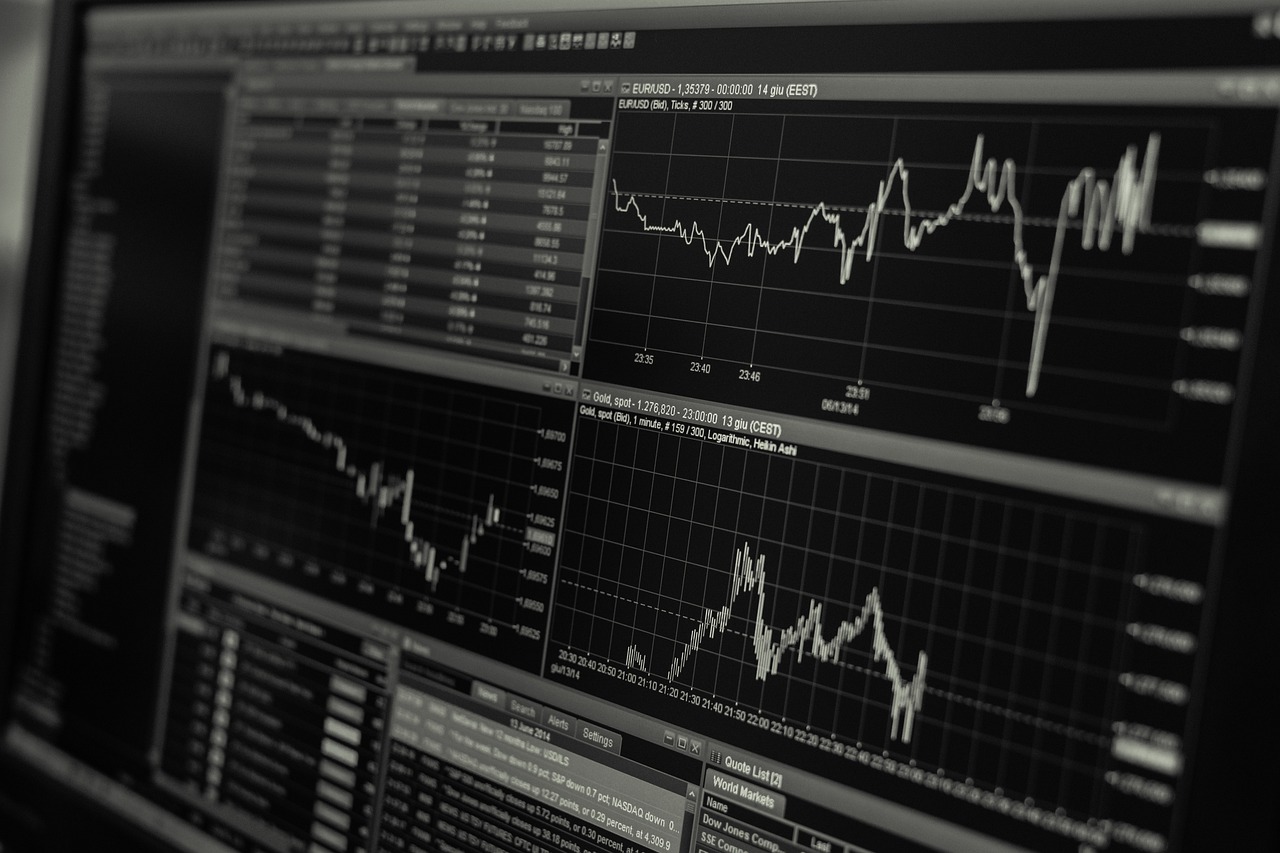
When it comes to trading, understanding is akin to having a treasure map. This data, which chronicles past market behavior, can reveal patterns and trends that are crucial for predicting future price movements. Think of it as a time machine that allows traders to revisit the market's past, helping them make educated guesses about what might happen next. By analyzing historical price data, traders can identify significant price levels, support and resistance zones, and overall market sentiment.
One of the primary advantages of using historical price data is the ability to conduct backtesting. This process involves applying a trading strategy to historical data to see how it would have performed in the past. It’s like testing a recipe before serving it at a dinner party; you want to ensure it’s a hit! By backtesting, traders can refine their strategies and gain confidence in their decision-making process.
Moreover, historical price data allows traders to recognize chart patterns that can signal potential market reversals or continuations. For example, classic patterns like head and shoulders, flags, and triangles can indicate whether a price is likely to rise or fall. Familiarity with these patterns can significantly enhance a trader's ability to make informed decisions. It’s like being a detective—when you know the clues, you can solve the mystery of market movements.
In addition, technical indicators derived from historical price data play a pivotal role in trading strategies. Indicators such as moving averages and the Relative Strength Index (RSI) help traders identify entry and exit points. For instance, when a short-term moving average crosses above a long-term moving average, it can indicate a buying opportunity. Conversely, if the RSI shows that a stock is overbought, it might be time to consider selling. These indicators transform raw data into actionable insights, making them invaluable tools in a trader's arsenal.
In summary, historical price data serves as a foundational element in the world of trading. It provides insights into past market behavior, facilitates backtesting, helps recognize chart patterns, and supports the use of technical indicators. By harnessing the power of this data, traders can navigate the complex waters of the financial markets with greater confidence and precision.
- What is historical price data?
Historical price data refers to the past prices of a security or asset over a specific time frame, used to analyze market trends and make trading decisions.
- How can I access historical price data?
Historical price data can be accessed through various financial platforms, brokerage services, and market data providers.
- Why is backtesting important?
Backtesting allows traders to evaluate the effectiveness of their strategies using historical data, helping to refine approaches before applying them in real-time.

Chart Patterns
Chart patterns are visual representations of historical price movements and are crucial for traders looking to make informed decisions. These patterns emerge from the fluctuations in price over time, and they can indicate potential future movements. Think of chart patterns as the fingerprints of the market; each one tells a unique story about the behavior of traders and investors. By studying these patterns, traders can gauge market sentiment and anticipate possible reversals or continuations.
Among the most recognized chart patterns are the Head and Shoulders, Double Tops and Bottoms, and Triangles. Each of these patterns offers insights into market psychology. For instance, the Head and Shoulders pattern often signals a trend reversal, while Double Tops might indicate that a market is losing momentum. On the other hand, Triangle patterns can suggest a period of consolidation before a breakout, either upward or downward.
Understanding these patterns is not just about recognition; it’s about interpretation. When a trader spots a Head and Shoulders pattern forming, they may prepare for a potential decline, whereas the emergence of a Triangle pattern might get them ready to capitalize on an upcoming volatility spike. The ability to interpret these signals can significantly enhance a trader's strategy and decision-making process.
Moreover, chart patterns are often used in conjunction with other tools, such as technical indicators, to confirm signals. For example, if a trader identifies a Double Bottom pattern and the Relative Strength Index (RSI) shows oversold conditions, it might reinforce the decision to enter a long position. This combination of pattern recognition and technical analysis can create a robust trading strategy.
In summary, mastering chart patterns is an essential skill for traders aiming to navigate the complexities of financial markets. By developing a keen eye for these formations, traders can enhance their ability to predict market movements and make more informed trading decisions. The world of trading is filled with surprises, and those who can read the signs are often the ones who thrive.
- What are chart patterns? Chart patterns are formations created by the price movements of an asset on a chart, indicating potential future price movements.
- How do I recognize a chart pattern? Traders recognize chart patterns by analyzing the shape and structure formed by price movements over time, often using tools like trend lines.
- Can chart patterns guarantee profits? While chart patterns can provide insights and improve decision-making, they do not guarantee profits as market conditions can change rapidly.
- Should I use chart patterns with other analysis tools? Yes, combining chart patterns with technical indicators and other analysis methods can enhance the accuracy of trading strategies.
Technical Indicators
When it comes to trading, are like the compass guiding traders through the turbulent waters of financial markets. These indicators, derived from historical price and volume data, provide essential insights that help traders identify potential entry and exit points in their strategies. Think of them as the tools in a trader's toolbox, each serving a specific purpose to enhance decision-making.
One of the most commonly used technical indicators is the Moving Average (MA). This indicator smooths out price data by creating a constantly updated average price. Traders often look at two types of moving averages: the simple moving average (SMA) and the exponential moving average (EMA). The SMA calculates the average of prices over a specific period, while the EMA gives more weight to recent prices, making it more responsive to new information. For example, if a trader observes the 50-day SMA crossing above the 200-day SMA, it might signal a bullish trend, often referred to as a "golden cross."
Another popular indicator is the Relative Strength Index (RSI). The RSI measures the speed and change of price movements, oscillating between 0 and 100. Traders typically use it to identify overbought or oversold conditions in a market. An RSI above 70 may indicate that an asset is overbought, while an RSI below 30 suggests it is oversold. This information can be crucial for traders looking to time their entries and exits effectively.
To illustrate how these indicators can be used in conjunction, let's take a look at a simple table comparing the Moving Average and RSI:
| Indicator | Purpose | Typical Use |
|---|---|---|
| Moving Average (MA) | Smooths price data to identify trends | Buy when price crosses above MA, sell when it crosses below |
| Relative Strength Index (RSI) | Measures speed of price changes to identify overbought/oversold conditions | Buy when RSI is below 30, sell when above 70 |
By combining these indicators, traders can create a more robust trading strategy. For instance, if a trader sees that the price is above the moving average while the RSI is approaching an oversold condition, it may indicate a strong upward momentum that could lead to a profitable trade. However, it’s essential to remember that no indicator is foolproof. They should be used in conjunction with other analysis methods and risk management strategies.
In summary, technical indicators are invaluable tools for traders looking to navigate the complexities of the financial markets. By understanding how to interpret these indicators, traders can enhance their decision-making process, ultimately leading to more successful trading outcomes.
- What are technical indicators? Technical indicators are statistical calculations based on historical price and volume data that help traders make informed decisions.
- How do I use moving averages in trading? Moving averages help identify trends. Traders often buy when the short-term moving average crosses above the long-term moving average and sell when it crosses below.
- What does the RSI tell me? The RSI indicates whether an asset is overbought or oversold, helping traders identify potential reversal points.
- Can I rely solely on technical indicators? While technical indicators provide valuable insights, they should be used alongside other analysis methods and risk management practices.

Volume Analysis
Volume analysis is a critical component of trading strategies that focuses on the number of shares or contracts traded within a specific timeframe. It’s not just about the price movement; understanding the volume behind those movements can provide traders with deeper insights into market dynamics. Imagine you're at a concert: if the crowd is roaring, it indicates excitement and energy. Similarly, high trading volume can signify strong interest in a stock, while low volume might suggest a lack of conviction among investors. This relationship between price and volume can be a game-changer in making informed trading decisions.
When analyzing volume, traders often look for the following key aspects:
- Volume Trends: Analyzing whether volume is increasing or decreasing can help traders gauge market sentiment. For instance, rising prices accompanied by increasing volume can indicate a strong upward trend, while rising prices with declining volume may suggest a potential reversal.
- Volume Spikes: Sudden spikes in volume can be indicative of significant market events or news. These spikes can lead to increased volatility, providing traders with opportunities to capitalize on rapid price movements.
- Volume and Price Correlation: Understanding how volume correlates with price movements can help traders confirm trends. If a price breakout occurs with substantial volume, it’s often viewed as a more reliable signal compared to a breakout on low volume.
Furthermore, volume analysis can be enhanced through the use of various tools and indicators. For example, the On-Balance Volume (OBV) indicator combines price and volume to provide a clearer picture of market trends. By adding or subtracting volume based on price movement, OBV helps traders confirm trends and identify potential reversals. Another useful tool is the Accumulation/Distribution Line, which helps traders understand whether a stock is being accumulated (bought) or distributed (sold) over time.
Incorporating volume analysis into your trading strategy can significantly improve your decision-making process. It allows you to see beyond the price and understand the underlying forces driving market movements. Just like a captain navigating through stormy seas, knowing the volume can help you steer your trading ship safely through the waves of market fluctuations.
Q: What is volume analysis in trading?
A: Volume analysis involves examining the number of shares or contracts traded over a specific period to gauge market strength and confirm price trends.
Q: How does volume affect price movement?
A: High volume during a price increase typically indicates strong buying interest, while low volume may suggest a lack of conviction. Conversely, high volume during a price drop can signal strong selling pressure.
Q: What tools can I use for volume analysis?
A: Traders often use indicators like On-Balance Volume (OBV) and the Accumulation/Distribution Line to analyze volume trends and confirm price movements.
Q: Can volume analysis predict market reversals?
A: While not foolproof, volume analysis can help identify potential reversals. A significant price movement accompanied by a volume spike may indicate a shift in market sentiment.
The Importance of Real-Time Data
In the fast-paced world of trading, real-time data is not just a luxury; it’s a necessity. Imagine trying to catch a wave without knowing when it’s coming. That’s what trading without real-time data feels like. Traders need instantaneous information to make quick decisions, as the market can shift in the blink of an eye. The ability to react swiftly to market changes can mean the difference between a profitable trade and a significant loss.
Real-time data provides traders with the most current market conditions, allowing them to capitalize on opportunities as they arise. For example, if a trader is monitoring stock prices and suddenly sees a spike due to breaking news, having access to real-time data enables them to make an informed decision—whether it’s to buy, sell, or hold. Without this immediate access, traders risk missing out on lucrative trades or, worse, entering a position at the wrong time.
Moreover, real-time data includes a multitude of information sources that can impact trading decisions. This can range from market news and economic indicators to social media sentiment and geopolitical events. Staying updated on these factors is crucial, as they can cause significant volatility in the markets. For instance, a sudden announcement regarding interest rate changes can lead to rapid price movements, making it essential for traders to have real-time insights.
To illustrate the significance of real-time data, consider the following table that outlines the potential impact of timely information on trading strategies:
| Type of Data | Impact on Trading |
|---|---|
| Market News | Can cause sudden price fluctuations, requiring immediate action. |
| Economic Indicators | Influences market sentiment and can lead to long-term trends. |
| Social Media Sentiment | Reflects public perception, which can drive market behavior. |
| Geopolitical Events | Can create uncertainty, leading to increased volatility. |
In addition to enhancing decision-making, real-time data also plays a pivotal role in algorithmic trading. Algorithms rely heavily on up-to-the-minute information to execute trades automatically based on predefined criteria. This not only increases the efficiency of trades but also allows traders to take advantage of fleeting market conditions that a human trader might miss. Essentially, algorithms act as a safety net, ensuring that traders can respond to market changes without delay.
In conclusion, the importance of real-time data in trading cannot be overstated. It empowers traders to make informed decisions quickly, adapt to changing market conditions, and ultimately, improve their chances of success. As the financial markets continue to evolve, being equipped with real-time data will remain a cornerstone of effective trading strategies.
- What is real-time data in trading? Real-time data refers to information that is delivered immediately after collection, allowing traders to make timely decisions based on the latest market conditions.
- Why is real-time data important? It is crucial for making quick, informed decisions, especially in volatile markets where conditions can change rapidly.
- How does real-time data impact algorithmic trading? Algorithmic trading relies on real-time data to execute trades automatically, enhancing efficiency and responsiveness to market changes.

Market News and Events
In the fast-paced world of trading, staying informed about market news and events is not just important; it's absolutely essential. Why, you ask? Because the financial markets are influenced by a myriad of factors, from economic indicators to geopolitical events. Imagine trying to navigate a stormy sea without a compass; that’s what trading without real-time news feels like. Traders need to be aware of events that could cause sudden market fluctuations, and having access to timely information can be the difference between a profitable trade and a significant loss.
Market news can come from various sources, including financial news outlets, economic reports, and social media platforms. Traders often rely on these sources to gain insights into market sentiment and potential price movements. For instance, when a major company reports earnings that exceed expectations, it can lead to a surge in stock prices. Conversely, negative news, such as regulatory changes or economic downturns, can trigger sell-offs. Therefore, understanding the impact of news events is crucial for making informed trading decisions.
Moreover, the timeliness of information is critical. In trading, every second counts. Traders who have access to real-time data can react to news as it breaks, allowing them to capitalize on market movements before others can even process the information. This speed can be the key to success, especially in volatile markets where prices can change dramatically within minutes. The ability to quickly interpret news and gauge its potential impact on the market is a skill that can significantly enhance a trader's effectiveness.
To illustrate the impact of market news, consider the following table that highlights some key events and their effects on the market:
| Event | Date | Market Reaction |
|---|---|---|
| Federal Reserve Interest Rate Decision | March 2023 | Market rallied as rates were kept low |
| Major Tech Company Earnings Report | April 2023 | Stock prices surged after positive earnings |
| Geopolitical Tensions Escalate | May 2023 | Market experienced a sharp decline |
Additionally, traders often categorize news into two types: scheduled events and unscheduled events. Scheduled events, such as earnings reports or economic data releases, can be anticipated and planned for. On the other hand, unscheduled events, like natural disasters or sudden political changes, can catch traders off guard. Being prepared for both types of news is vital for any trading strategy.
In conclusion, the ability to analyze and react to market news and events is a cornerstone of successful trading. It requires not just access to information, but also the skill to interpret its significance quickly. As the saying goes, "Knowledge is power," and in trading, that knowledge often comes from being the first to know about market-moving events. So, whether you’re a seasoned trader or just starting out, make sure to keep your finger on the pulse of the market news!
- How can I stay updated on market news? You can subscribe to financial news websites, follow market analysts on social media, and use trading platforms that provide real-time news feeds.
- What types of news impact trading the most? Economic indicators, earnings reports, geopolitical events, and regulatory changes are among the most impactful types of news.
- Is algorithmic trading influenced by market news? Yes, algorithmic trading can be programmed to react to specific news events, making it a powerful tool for traders looking to capitalize on rapid market changes.

Algorithmic Trading
Algorithmic trading has revolutionized the way traders operate in the financial markets. Imagine a world where decisions are made in the blink of an eye, where trades are executed faster than a human can even think. That's the power of algorithms! These sophisticated programs utilize data analysis to execute trades automatically based on predefined criteria, allowing traders to capitalize on market opportunities without the emotional biases that often cloud judgment.
At its core, algorithmic trading combines the art of trading with the science of data analysis. By analyzing vast amounts of historical data, algorithms can identify patterns and trends that human traders might overlook. This not only enhances the efficiency of trading strategies but also increases profitability. For instance, an algorithm might analyze thousands of data points in seconds, identifying a profitable trading opportunity that could take a human trader hours to spot.
One of the key advantages of algorithmic trading is its ability to operate in real-time. In today’s fast-paced markets, timing is everything. Algorithms can react to market changes instantly, executing trades at the optimal moment. This is particularly crucial during major market events or news releases, where prices can fluctuate dramatically within seconds. By leveraging real-time data, these algorithms ensure that traders are always one step ahead.
Moreover, algorithmic trading can be tailored to suit various trading strategies. Whether you're a day trader looking for quick profits or a long-term investor aiming for steady growth, algorithms can be programmed to align with your specific goals. For instance, a trend-following algorithm might buy assets when they show upward momentum and sell when they start to decline. This systematic approach helps eliminate emotional trading decisions, which can often lead to losses.
However, it’s important to note that algorithmic trading is not without its challenges. The success of an algorithm heavily relies on the quality of data and the robustness of the trading strategy. Traders must ensure that their algorithms are based on accurate and relevant data to avoid costly mistakes. Additionally, market conditions can change rapidly, and an algorithm that performed well in the past may not necessarily yield the same results in the future. Therefore, continuous monitoring and adjustment of algorithms are essential to maintain their effectiveness.
In summary, algorithmic trading represents a significant advancement in the financial markets, enabling traders to harness the power of data analysis for improved decision-making and profitability. As technology continues to evolve, those who embrace algorithmic trading will likely find themselves at a distinct advantage in the competitive world of trading.
- What is algorithmic trading? Algorithmic trading is the use of computer algorithms to automate trading strategies, allowing for faster and more efficient execution of trades based on predefined criteria.
- How does data analysis enhance algorithmic trading? Data analysis helps algorithms identify patterns and trends in market data, enabling them to make informed trading decisions without emotional biases.
- Is algorithmic trading suitable for all traders? While algorithmic trading can benefit many traders, it requires a solid understanding of data analysis and market conditions. It may not be ideal for those who prefer a hands-on approach.
- What are the risks associated with algorithmic trading? Risks include reliance on data quality, potential for technical failures, and changing market conditions that may affect the performance of trading algorithms.
Frequently Asked Questions
- What is data analysis in trading?
Data analysis in trading refers to the process of inspecting, cleansing, and modeling data to uncover valuable insights. It helps traders identify patterns and trends in the market, which guides them in making informed decisions to enhance their trading strategies.
- Why is historical price data important?
Historical price data is crucial because it provides insights into past market behavior. By analyzing this data, traders can identify trends and make predictions about future price movements, which is essential for backtesting strategies and improving decision-making.
- How do technical indicators assist traders?
Technical indicators, such as moving averages and the Relative Strength Index (RSI), are derived from historical price data. They help traders identify potential entry and exit points in their strategies, providing additional insights that can enhance trading effectiveness.
- What role does volume analysis play in trading?
Volume analysis examines the number of shares traded over a specific period. It is vital for confirming trends and understanding market strength, enabling traders to make better-informed decisions based on market activity.
- Why is real-time data essential for traders?
Real-time data is essential as it allows traders to react swiftly to market changes. Accessing up-to-date information can significantly impact trading outcomes, especially during periods of high volatility following major news announcements.
- What is algorithmic trading?
Algorithmic trading is a method that relies heavily on data analysis to execute trades automatically based on predefined criteria. It enhances trading efficiency and profitability by allowing traders to capitalize on market opportunities without the need for constant manual intervention.
- How can I improve my trading strategies using data analysis?
You can improve your trading strategies by utilizing various data types, including historical price data, volume statistics, and real-time market news. By analyzing these data points, you can develop a deeper understanding of market trends and make more informed trading decisions.


