Building a Trading Strategy Around Technical Analysis
Creating a successful trading strategy can feel like navigating a maze. With countless paths to choose from, how do you know which one will lead you to the treasure? Well, that's where technical analysis comes into play. It’s not just a buzzword thrown around in trading circles; it’s a powerful tool that can help you make informed decisions based on market behavior. In this article, we will explore how to build a trading strategy around technical analysis, focusing on key concepts, tools, and techniques that can enhance your trading performance.
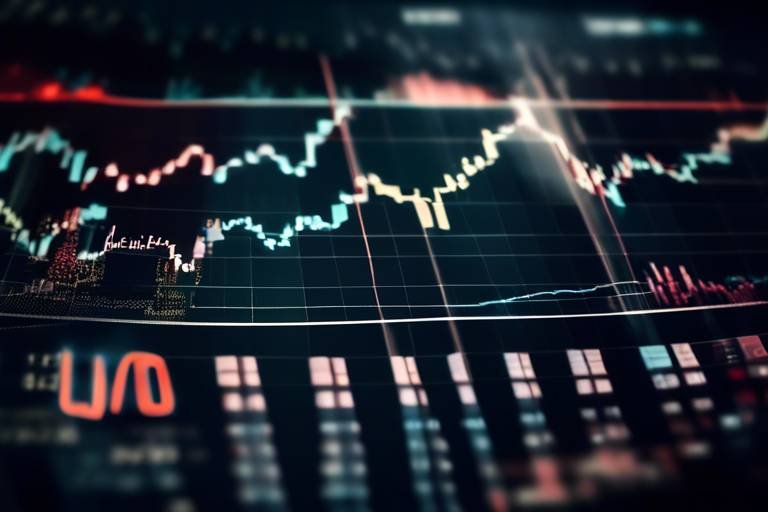
At its core, technical analysis involves examining historical price data and trading volume to forecast future price movements. Unlike fundamental analysis, which looks at economic indicators and company performance, technical analysis is all about the charts and the patterns they reveal. Think of it as reading a map that shows you where the market has been and where it might be headed. By understanding these patterns, traders can identify potential entry and exit points, manage risk, and ultimately improve their chances of success.
But wait, let’s not just skim the surface. Building a robust trading strategy requires a deep dive into the various tools and techniques available. From chart patterns to technical indicators, each element plays a crucial role in forming a comprehensive approach to trading. So, buckle up as we embark on this journey through the world of technical analysis!
Before we get into the nitty-gritty, it’s essential to grasp the fundamentals of technical analysis. It’s all about understanding market psychology and recognizing that price movements are driven by the collective actions of traders. When you look at a price chart, you’re not just seeing numbers; you’re witnessing the emotions of buyers and sellers playing out in real-time. This is where the magic happens!
Technical analysis operates on a few key principles:
- Price Discounts Everything: The market price reflects all available information, including news, earnings, and economic data.
- Price Moves in Trends: Markets tend to move in trends, which can be upward, downward, or sideways.
- History Tends to Repeat Itself: Patterns and trends observed in the past often recur in the future, making historical data a valuable resource.
These principles serve as the foundation for building your trading strategy. By recognizing patterns and understanding market behavior, you can make more educated trading decisions.
Now that we’ve covered the basics, let’s explore the essential tools used in technical analysis. These tools are like a trader's toolbox; each one serves a unique purpose and can significantly enhance your trading strategy. Here’s a breakdown of some key tools:
Chart patterns are visual representations of price movements. They can indicate potential market reversals or continuations. Some popular chart patterns include:
- Head and Shoulders: This pattern can signal a reversal from a bullish to a bearish trend.
- Triangles: These can indicate a continuation of the current trend.
Recognizing these patterns can provide valuable insights into future price movements, making them a staple in any trader’s strategy.
Support and resistance levels are critical in determining entry and exit points. Support is the price level at which a stock tends to stop falling and may bounce back up, while resistance is where it tends to stop rising and may reverse downwards. Identifying these levels can help you make informed decisions about when to enter or exit a trade.
Trend lines are straight lines that connect price points on a chart, helping traders visualize the direction of the market. They are essential for identifying the overall trend, whether it’s bullish or bearish. Drawing accurate trend lines can significantly improve your ability to forecast future price movements.
Technical indicators are mathematical calculations based on price and volume data that help traders analyze market conditions. Some popular indicators include:
- Moving Averages: These smooth out price data to identify trends over a specific period.
- Relative Strength Index (RSI): This measures the speed and change of price movements, helping traders identify overbought or oversold conditions.
Utilizing these indicators can provide additional confirmation for your trading decisions, enhancing your overall strategy.
While technical analysis is crucial for identifying trading opportunities, it’s equally important to have a solid risk management strategy in place. After all, protecting your capital is vital in the world of trading. Without effective risk management, even the best trading strategy can lead to significant losses.
Position sizing refers to determining the amount of capital to allocate to a specific trade. This is crucial for managing risk effectively. A common rule of thumb is to risk no more than 1-2% of your trading capital on a single trade. This way, even a series of losses won't decimate your account.
Stop-loss orders are essential tools that help safeguard your investments. By setting a predetermined price at which your position will be closed, you can limit potential losses. This not only protects your capital but also helps maintain discipline in your trading strategy.
Backtesting is the process of testing a trading strategy using historical data to determine its effectiveness. It’s like taking your strategy for a test drive before hitting the open road. By analyzing how your strategy would have performed in the past, you can identify strengths and weaknesses, allowing you to optimize for future performance.
Collecting and analyzing historical data is essential for refining your trading strategies. By examining past market behavior, you can gain insights into what works and what doesn’t, making it easier to adjust your approach accordingly.
Once you’ve backtested your strategy, it’s time to make adjustments based on the results. This could involve tweaking your entry and exit points, modifying stop-loss levels, or even changing your position sizing. The goal is to improve your strategy’s performance and adaptability in various market conditions.
1. What is the best time frame for technical analysis?
The best time frame depends on your trading style. Day traders may prefer shorter time frames, while swing traders often look at daily or weekly charts.
2. Can technical analysis guarantee profits?
No trading strategy can guarantee profits. Technical analysis helps improve decision-making but carries inherent risks.
3. How often should I backtest my strategy?
It's a good practice to backtest your strategy regularly, especially after significant market changes or when you make adjustments to your approach.

Understanding Technical Analysis
When diving into the world of trading, one of the most crucial concepts to grasp is technical analysis. This approach focuses on analyzing price movements and trading volumes to forecast future price behavior. Unlike fundamental analysis, which evaluates a company's financial health and market position, technical analysis is all about the numbers and charts. Imagine trying to predict the weather by looking at past patterns of sun and rain; that's essentially what technical analysis does for trading. It’s like being a detective, piecing together clues from price charts to make informed decisions.
The core principle of technical analysis rests on the belief that all available information is already reflected in the price. This means that the price movements are not random; they follow patterns that can be identified and used to anticipate future movements. Traders who utilize technical analysis often rely on various tools and techniques to help them interpret these patterns, and the beauty lies in its ability to provide insights no matter the market conditions. Whether the market is trending upwards, downwards, or moving sideways, technical analysis can offer valuable information.
One of the fundamental tenets of technical analysis is the concept of market psychology. Traders' emotions and behaviors significantly influence price movements. For instance, during a market rally, you might see a surge of buying as traders chase prices, driven by fear of missing out. Conversely, in a downturn, panic selling can exacerbate price declines. Technical analysis helps traders understand these psychological factors by analyzing price charts and trading volumes.
In essence, technical analysis can be broken down into a few key components:
- Price Charts: The visual representation of price movements over time, which can help identify trends and patterns.
- Indicators: Mathematical calculations based on price and volume that assist traders in making decisions.
- Volume Analysis: Understanding the number of shares or contracts traded, which can confirm price movements.
By mastering these components, traders can create a robust trading strategy that not only enhances their understanding of market movements but also increases their chances of success. Technical analysis is not just about memorizing patterns or indicators; it’s about developing a keen sense of the market and making educated guesses based on historical data. So, if you're ready to embark on your trading journey, embracing technical analysis could be your ticket to navigating the often turbulent waters of the financial markets.

Key Tools for Technical Analysis
When it comes to trading, having the right tools at your disposal can make all the difference. Technical analysis relies heavily on various tools that help traders dissect price movements and make informed decisions. Think of these tools as your trading arsenal; without them, navigating the volatile markets can feel like sailing a ship without a compass. So, what are the essential tools that every trader should consider?
First and foremost, charts are the backbone of technical analysis. They visually represent price movements over time, allowing traders to spot trends and patterns that might not be evident at first glance. There are several types of charts, including line charts, bar charts, and candlestick charts. Each has its unique strengths, but candlestick charts are particularly popular due to their ability to convey a wealth of information in a compact format. For instance, they show not just the closing price but also the opening price, high, and low, giving traders a more comprehensive view of market sentiment.
In addition to charts, indicators play a crucial role in technical analysis. These are mathematical calculations based on the price, volume, or open interest of a security. Indicators help traders identify trends, momentum, volatility, and market strength. Some of the most widely used indicators include:
- Moving Averages: These smooth out price data to create a trend-following indicator, helping to identify the direction of the trend.
- Relative Strength Index (RSI): This momentum oscillator measures the speed and change of price movements, indicating overbought or oversold conditions.
- Bollinger Bands: These bands expand and contract based on market volatility, providing insight into price levels relative to historical norms.
Another essential aspect of technical analysis is oscillators. These indicators fluctuate between a set range and are particularly useful for identifying potential reversal points in the market. For example, the Stochastic Oscillator can signal when an asset is overbought or oversold, allowing traders to anticipate market corrections. By combining oscillators with other tools, traders can enhance their decision-making process.
Understanding chart patterns is vital for any trader looking to harness the power of technical analysis. Patterns such as head and shoulders, double tops, and triangles can indicate potential market movements. For instance, a head and shoulders pattern often signals a reversal from an uptrend to a downtrend, while triangles can indicate a continuation of the current trend. Recognizing these patterns can help traders anticipate price movements and make strategic decisions.
Identifying support and resistance levels is another key component of technical analysis. Support refers to a price level where a downtrend can be expected to pause due to a concentration of demand, while resistance is where an uptrend can stall due to a concentration of selling interest. These levels are crucial for determining entry and exit points in a trading strategy. By plotting these levels on your charts, you can visualize where the price might struggle to move beyond, allowing you to plan your trades more effectively.
Trend lines are simple yet powerful tools that help traders understand the direction of price movements. By connecting a series of price points, traders can identify the overall trend—whether it’s bullish, bearish, or sideways. Drawing trend lines can also help in spotting potential breakout points. When the price breaks through a trend line, it can signal a significant change in market sentiment, prompting traders to adjust their strategies accordingly.
In conclusion, the tools of technical analysis are not just gadgets; they are essential instruments that can enhance a trader's ability to make informed decisions. By mastering charts, indicators, oscillators, and understanding patterns, support and resistance levels, and trend lines, traders can navigate the complex world of trading with greater confidence and precision.
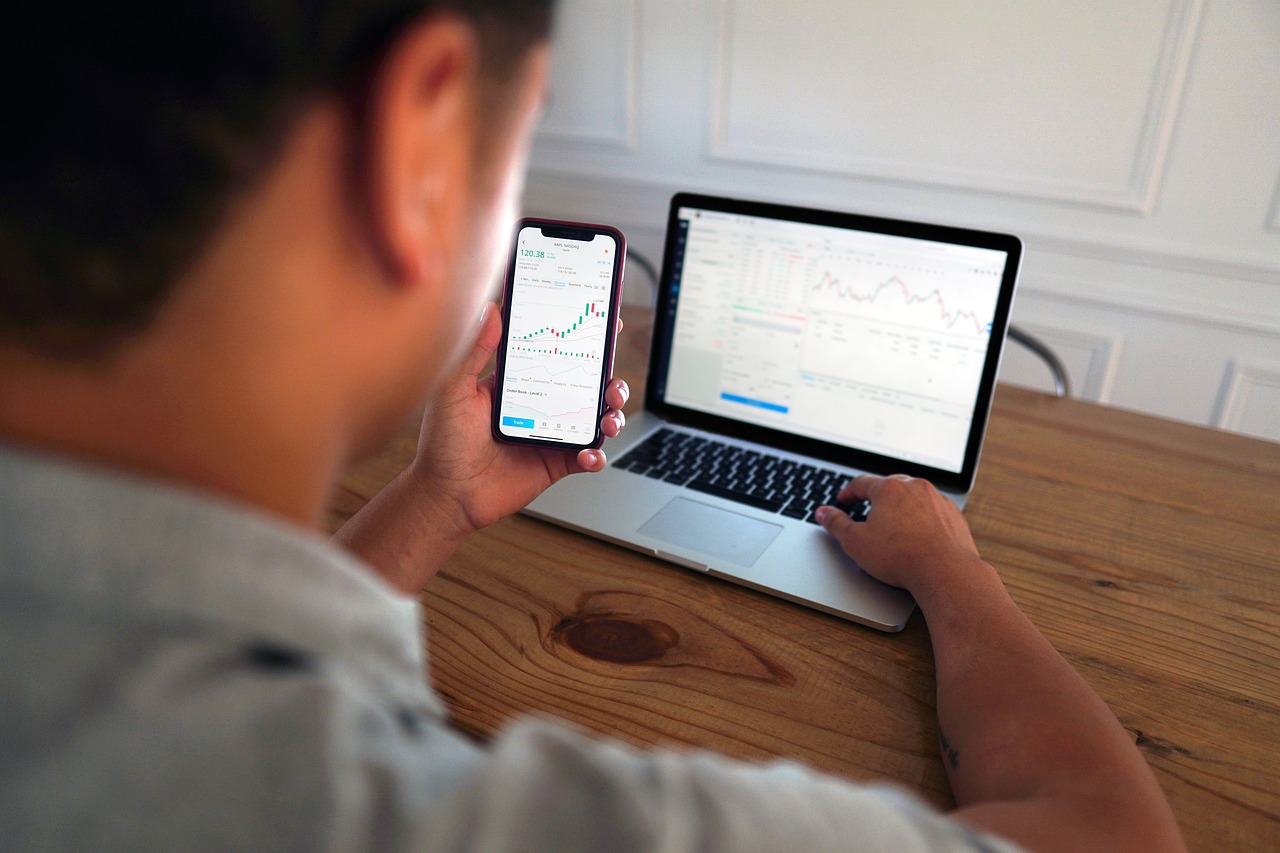
Chart Patterns
Chart patterns are like the secret language of the market, speaking volumes about potential price movements. They are visual representations of price action that can help traders identify trends and reversals. Think of them as the footprints left by market participants, revealing where buyers and sellers are likely to step next. Understanding these patterns can significantly enhance your trading strategy and decision-making process.
One of the most famous chart patterns is the head and shoulders pattern, which typically signals a reversal in trend. Imagine a head with two shoulders on either side; when this pattern forms, it often indicates that the price is about to change direction. Conversely, the inverse head and shoulders pattern suggests a potential bullish reversal, where the market may be gearing up for an upward trend.
Another essential pattern to recognize is the triangle pattern. Triangles can be ascending, descending, or symmetrical, each indicating a different market sentiment. For instance, an ascending triangle often suggests that buyers are gaining strength, while a descending triangle indicates sellers are in control. These patterns can be incredibly useful for traders looking to enter or exit positions based on market momentum.
Alongside these, there are also flags and pennants, which are short-term continuation patterns. Flags resemble a small rectangle that slopes against the prevailing trend, while pennants look like small symmetrical triangles. Both patterns suggest that after a brief consolidation period, the market is likely to continue in the direction of the previous trend. Recognizing these patterns can provide traders with timely entry points.
To effectively utilize chart patterns, it's crucial to combine them with other technical analysis tools. For instance, confirming a pattern with volume can enhance its reliability. If a breakout from a chart pattern is accompanied by increased trading volume, it’s generally a strong signal that the price movement is valid. Conversely, a breakout on low volume might indicate a false signal, leading to potential losses.
In summary, chart patterns are a vital component of technical analysis, offering insights into market psychology and potential future price movements. By mastering these patterns and integrating them into your trading strategy, you can make more informed decisions and improve your overall trading performance.
Q1: How can I identify chart patterns effectively?
A1: Identifying chart patterns requires practice and familiarity with different types of patterns. Using charting software that highlights these patterns can also be incredibly helpful.
Q2: Are chart patterns reliable indicators of future price movements?
A2: While chart patterns can provide valuable insights, they are not foolproof. It's essential to use them in conjunction with other technical indicators and risk management strategies.
Q3: Can I trade solely based on chart patterns?
A3: It’s not advisable to rely solely on chart patterns for trading decisions. Combining them with other analysis methods can lead to more successful outcomes.

Support and Resistance Levels
Support and resistance levels are fundamental concepts in technical analysis that every trader should grasp. They act as psychological barriers where price movements tend to stall or reverse. Imagine a rubber ball bouncing on the ground; the ground represents the support level, while the ceiling above represents the resistance level. When the price approaches these levels, traders often anticipate a reaction, which can lead to significant trading opportunities.
Support is the price level at which a downtrend can be expected to pause due to a concentration of demand. Conversely, resistance is the price level at which a trend can pause or reverse due to a concentration of selling interest. Understanding these levels helps traders make informed decisions about when to enter or exit trades.
Identifying support and resistance levels can be done through various methods, such as:
- Historical Price Levels: Look at past price action to spot where the price has repeatedly bounced or reversed.
- Moving Averages: These can act as dynamic support and resistance, where traders often see price reactions.
- Fibonacci Retracements: These can help identify potential support and resistance levels based on the Fibonacci sequence.
To illustrate the significance of these levels, consider the following table that outlines how price interacts with support and resistance:
| Price Action | Market Reaction |
|---|---|
| Price approaches support level | Potential bounce back upwards |
| Price hits resistance level | Potential reversal downwards |
| Price breaks through support | Indicates a potential downtrend |
| Price breaks through resistance | Indicates a potential uptrend |
Traders often use these levels to set their stop-loss orders and take-profit targets. For instance, if a trader identifies a strong support level, they might place a buy order just above it, expecting the price to bounce back. Conversely, if they notice a resistance level, they could set a sell order just below it, anticipating a price drop. This strategic approach can significantly enhance trading performance.
Remember, while support and resistance levels are powerful tools, they are not foolproof. Market conditions can change rapidly, and external factors can influence price movements. Therefore, it’s crucial to combine these levels with other technical analysis tools and risk management strategies for optimal results.
1. What is the difference between support and resistance?
Support is a price level where buying interest is strong enough to overcome selling pressure, while resistance is where selling interest is strong enough to overcome buying pressure.
2. How can I identify support and resistance levels?
You can identify these levels by analyzing historical price data, using moving averages, or employing Fibonacci retracements.
3. Can support and resistance levels change?
Yes, support and resistance levels can change due to market dynamics and new price action, so it's essential to regularly update your analysis.
4. How do I use support and resistance in my trading strategy?
You can use these levels to determine entry and exit points for trades, as well as to set stop-loss and take-profit orders, enhancing your overall trading strategy.

Trend Lines
Trend lines are one of the most fundamental tools in technical analysis, acting as a visual representation of price movements over time. They help traders identify the direction of the market, whether it’s trending upwards, downwards, or moving sideways. Imagine you're driving a car; just as you need to know the road's direction to reach your destination, traders need to understand the market's trend to make informed decisions. Drawing a trend line is simple yet powerful: you connect two or more price points on a chart, and voilà! You have a trend line that indicates the prevailing direction of the market.
There are two main types of trend lines: uptrend lines and downtrend lines. An uptrend line is drawn by connecting the lows of the price action, indicating that the market is making higher lows and is generally moving upwards. Conversely, a downtrend line connects the highs, showing that the market is making lower highs and is moving downwards. Think of these lines as the market's heartbeat; they pulse with the rhythm of buying and selling, helping traders gauge whether to jump in or step back.
To make the most out of trend lines, it's essential to understand the concept of support and resistance. An uptrend line can act as a support level, where the price tends to bounce off, while a downtrend line can serve as a resistance level, where the price struggles to break through. This dynamic creates a fascinating dance between buyers and sellers, and recognizing these levels can significantly enhance your trading strategy.
Here’s a quick overview of how to effectively use trend lines:
- Identify the Trend: Start by determining whether the market is in an uptrend, downtrend, or ranging. This sets the stage for your analysis.
- Draw the Line: Connect the significant highs or lows on the chart. Ensure that the line touches at least two points for reliability.
- Confirm with Volume: Look for volume spikes at the trend line. Increased volume can indicate a stronger trend.
- Adjust as Needed: Markets are dynamic. Be ready to redraw your trend lines as new highs or lows form.
Trend lines are not foolproof; they can be broken. A break of a trend line often signals a potential reversal or a shift in market sentiment. Therefore, it’s crucial to combine trend lines with other technical indicators to confirm your analysis. For example, using trend lines alongside moving averages or momentum indicators can provide a more robust trading signal.
In summary, trend lines are invaluable for traders looking to navigate the complexities of the market. They offer clarity amidst chaos, helping traders make sense of price movements and potential entry or exit points. By mastering the art of drawing and interpreting trend lines, you can significantly enhance your trading strategy and improve your chances of success.

Technical Indicators
When it comes to trading, the right tools can make all the difference, and technical indicators are among the most essential instruments in a trader's toolkit. These indicators serve as a bridge between the raw data of price movements and actionable insights that can guide your trading decisions. Think of them as your trading compass, helping you navigate the often-turbulent waters of the financial markets. But what exactly are these indicators, and how do they work?
Technical indicators are mathematical calculations based on the price, volume, or open interest of a security. They can help traders identify trends, gauge momentum, and pinpoint potential reversal points. While there are countless indicators out there, some of the most popular ones include:
- Moving Averages (MA): This indicator smooths out price data to identify the direction of the trend. Traders often use the Simple Moving Average (SMA) and the Exponential Moving Average (EMA) to assess market conditions.
- Relative Strength Index (RSI): The RSI measures the speed and change of price movements. It ranges from 0 to 100 and is typically used to identify overbought or oversold conditions in a market.
- MACD (Moving Average Convergence Divergence): This indicator helps traders identify potential buy and sell signals by comparing two moving averages of a security’s price.
Each of these indicators has its strengths and weaknesses, and understanding them can significantly enhance your trading strategy. For instance, while moving averages can provide a clear picture of the trend, they may lag behind current price action. On the other hand, the RSI can give early signals of market reversals but may generate false signals in strong trending markets. So, how do you choose the right indicators for your strategy?
The key is to find a combination that complements your trading style. Some traders prefer to use a mix of trend-following indicators, like moving averages, alongside momentum indicators, like the RSI. This way, they can confirm signals and reduce the risk of false entries. However, it's crucial to avoid the trap of "analysis paralysis"—using too many indicators can lead to confusion and indecision. Instead, aim for a balanced approach that provides clarity and direction.
In summary, technical indicators are powerful tools that can enhance your trading performance when used correctly. They help you make informed decisions based on data rather than emotions, which is essential in a field where every second counts. As you dive deeper into the world of technical analysis, experimenting with different indicators and finding what works best for you will be key to developing a successful trading strategy.
1. What are technical indicators?
Technical indicators are mathematical calculations based on the price, volume, or open interest of a security that help traders analyze market trends and make informed decisions.
2. How do I choose the right technical indicators?
Select indicators that complement your trading style and strategy. A combination of trend-following and momentum indicators can provide a balanced approach.
3. Can I rely solely on technical indicators for trading?
While technical indicators are valuable tools, they should be used in conjunction with other analysis methods, such as fundamental analysis, to make well-rounded trading decisions.
4. How often should I adjust my indicators?
Regularly review your indicators based on market conditions and your trading performance. Adjust them as necessary to optimize your strategy.

Risk Management Strategies
When it comes to trading, one of the most crucial aspects that can make or break your success is risk management. Imagine sailing a ship through turbulent waters; without a sturdy vessel and a solid plan, you're bound to capsize. Similarly, in trading, having effective risk management strategies is like having a lifeboat ready when the waves get rough. It’s not just about making profits; it’s equally about protecting your capital from unexpected market movements.
One of the fundamental techniques in risk management is position sizing. This concept refers to determining how much of a particular asset you should buy or sell in a trade, based on your total capital and risk tolerance. Think of it as deciding how much of your pie you want to share with others. If you slice it too thin, you risk losing out on potential gains; slice it too thick, and you might end up with nothing on your plate. A good rule of thumb is to risk no more than 1-2% of your trading capital on a single trade. This way, even if you face a string of losses, your overall capital remains intact.
Another essential tool in your risk management arsenal is the use of stop-loss orders. These are like safety nets that catch you before you fall too hard. By setting a stop-loss order, you can automatically exit a trade at a predetermined price level, thus limiting your potential losses. It's akin to having a parachute while skydiving; it gives you peace of mind knowing that you have a backup plan in place. The key is to set your stop-loss at a level that makes sense based on your analysis, not just randomly. This ensures that you maintain discipline and avoid emotional trading decisions.
Incorporating both position sizing and stop-loss orders into your trading strategy can significantly enhance your risk management efforts. But remember, it’s not just about having these tools; it’s about using them wisely. For instance, you might want to consider the risk-to-reward ratio when entering a trade. This ratio compares the potential profit of a trade to the potential loss. A good risk-to-reward ratio is typically 1:2 or higher, meaning you stand to gain $2 for every $1 you risk. By focusing on trades with favorable ratios, you can ensure that even a lower win rate can still lead to overall profitability.
To visualize how these concepts work together, consider the following example:
| Trade | Entry Price | Stop-Loss Price | Target Price | Risk-to-Reward Ratio |
|---|---|---|---|---|
| Trade 1 | $100 | $95 | $110 | 1:2 |
| Trade 2 | $200 | $190 | $220 | 1:3 |
In this table, you can see how each trade is structured with a clear entry point, stop-loss, and target price. By maintaining a favorable risk-to-reward ratio, you’re setting yourself up for long-term success, even if individual trades don’t always go your way.
In conclusion, implementing effective risk management strategies is not just an option; it’s a necessity for any trader looking to thrive in the financial markets. By understanding the importance of position sizing, utilizing stop-loss orders, and maintaining a favorable risk-to-reward ratio, you can navigate the unpredictable waters of trading with confidence and poise. Remember, it’s not about avoiding risks altogether, but rather managing them wisely.
- What is the best way to manage risk in trading? The best way to manage risk is through position sizing, using stop-loss orders, and maintaining a favorable risk-to-reward ratio.
- How much of my capital should I risk on a single trade? It's generally advisable to risk no more than 1-2% of your total trading capital on any single trade.
- What is a stop-loss order? A stop-loss order is an instruction to sell a security when it reaches a certain price, helping to limit potential losses.
- Why is position sizing important? Position sizing is crucial because it helps to control how much you risk on each trade, thereby protecting your overall capital.

Position Sizing
When it comes to trading, one of the most critical yet often overlooked aspects is . Think of it as the foundation of your trading strategy; without a solid base, everything else can crumble. Position sizing refers to determining the amount of capital to allocate to each trade based on your overall trading strategy and risk tolerance. It’s like deciding how much of your favorite dish you want to serve on your plate—too much, and you risk feeling overwhelmed; too little, and you might leave the table unsatisfied.
So, why is position sizing so important? Well, it directly impacts your risk management. By carefully calculating your position size, you can control how much of your capital is at stake in any single trade. This is crucial because even the best traders experience losses; it’s part of the game. The key is to ensure that no single loss can significantly harm your trading account. For instance, if you risk 1% of your account on each trade, you can withstand a series of losses without jeopardizing your entire portfolio.
To determine your position size, you can use the following formula:
| Account Size | Risk Percentage | Trade Risk (in $) | Entry Price | Stop Loss Price | Position Size |
|---|---|---|---|---|---|
| $10,000 | 1% | $100 | $50 | $48 | 50 shares |
In the example above, if your account size is $10,000 and you decide to risk 1% on a trade, you would be risking $100. If you plan to buy a stock at $50 and set a stop-loss at $48, you’re risking $2 per share. Therefore, your position size would be 50 shares ($100 risk divided by $2 risk per share). This calculated approach helps you maintain discipline and prevents emotional decision-making, which can lead to disastrous outcomes.
It's also essential to adjust your position size based on market conditions. For example, in a volatile market, you might want to reduce your position size to mitigate risk. Conversely, in a stable market, you could consider increasing your position size, provided you’re still within your risk tolerance. This adaptability can be the difference between long-term success and failure in trading.
In conclusion, mastering position sizing is like learning to dance; it requires practice, patience, and the ability to adapt to the rhythm of the market. By implementing a sound position sizing strategy, you’re not just protecting your capital; you’re setting yourself up for sustainable success in your trading journey.
- What is the ideal position size for a trader? The ideal position size varies depending on your risk tolerance, trading strategy, and market conditions. Generally, risking 1% to 2% of your trading capital per trade is a good rule of thumb.
- How can I calculate my position size? You can calculate your position size using your account size, the percentage of risk you are willing to take, and the difference between your entry price and stop loss price. The formula is: Position Size (Account Size x Risk Percentage) / (Entry Price - Stop Loss Price).
- Can position sizing change based on market conditions? Yes, it’s advisable to adjust your position size based on market volatility. In more volatile markets, consider reducing your position size to manage risk effectively.
Stop-Loss Orders
When it comes to trading, one of the most crucial components of a successful strategy is the implementation of . These orders act as a safety net, automatically selling a security when it reaches a certain price, thereby preventing further losses. Imagine you're on a roller coaster, and just as you're about to plummet down a steep drop, there's a safety harness that locks you in place. That's exactly what stop-loss orders do for your trading portfolio. They help you avoid the heart-stopping moments of unexpected market downturns.
But how do stop-loss orders work? Essentially, you set a predetermined price at which you want to sell your asset. For example, if you purchase a stock at $50, you might set a stop-loss order at $45. If the stock price drops to $45, the order is triggered, and your shares are sold automatically. This means you can sleep soundly at night, knowing that you have a plan in place to protect your capital.
There are different types of stop-loss orders to consider, each with its unique advantages:
- Standard Stop-Loss: This is the most straightforward type, where the order is executed once the stock reaches the specified price.
- Trailing Stop-Loss: This dynamic order adjusts itself as the price of the asset moves in your favor. For instance, if you set a trailing stop-loss at $5 below the market price, it will follow the price up but remain fixed if the price drops.
- Guaranteed Stop-Loss: This type ensures that your order will be executed at the specified price, even in volatile market conditions. However, it often comes with a premium.
Implementing stop-loss orders not only helps in minimizing losses but also fosters discipline in trading. Many traders find it challenging to stick to their trading plans, especially during emotional moments when the market swings wildly. By setting a stop-loss, you remove the emotional aspect of decision-making, allowing you to focus on your strategy rather than reacting impulsively to market movements.
However, it's essential to set your stop-loss orders wisely. Placing them too close to the current price may lead to premature selling due to normal market fluctuations. On the other hand, setting them too far away might expose you to larger losses than necessary. The key is to find a balance that aligns with your overall trading strategy and risk tolerance.
In conclusion, stop-loss orders are an indispensable tool for traders looking to safeguard their investments. They not only provide a layer of protection but also help maintain discipline in the face of market volatility. Remember, the goal of trading is not just about making profits; it's also about preserving your capital. So, the next time you enter a trade, consider how a stop-loss order can be your safety harness, keeping you secure while you navigate the thrilling roller coaster of the market.
Q: What is a stop-loss order?
A stop-loss order is an instruction to sell a security when it reaches a certain price, helping to limit potential losses.
Q: How do I set a stop-loss order?
You can set a stop-loss order through your trading platform by specifying the price at which you want to sell your asset.
Q: What is the difference between a standard and a trailing stop-loss?
A standard stop-loss remains fixed at a specific price, while a trailing stop-loss adjusts as the market price moves in your favor.
Q: Can stop-loss orders guarantee profits?
No, stop-loss orders are designed to limit losses, not to guarantee profits. They can help protect your capital but cannot ensure a profit on a trade.

Backtesting and Optimization
When it comes to trading, having a strategy is just the beginning. To truly refine your approach and enhance your chances of success, backtesting is an essential step. But what exactly is backtesting? In simple terms, backtesting involves applying your trading strategy to historical data to see how it would have performed in the past. This process not only helps you understand the potential effectiveness of your strategy but also allows you to make necessary adjustments before risking real capital.
Imagine you're an architect designing a building. Before you break ground, you'd want to test your plans, right? Backtesting is akin to that, giving you a blueprint of how your trading strategy might perform under various market conditions. However, it’s crucial to remember that past performance doesn’t guarantee future results; it merely provides insights into how your strategy might behave.
To conduct effective backtesting, you’ll need to gather historical data. This data can include price movements, volume, and other relevant market metrics. The more comprehensive your dataset, the better your backtesting results will be. You can obtain this data from various sources, including trading platforms and financial websites. Once you have your data, it’s time to analyze it. This is where the magic happens!
| Data Type | Description |
|---|---|
| Price Data | Historical prices of the asset you're trading, including open, high, low, and close prices. |
| Volume Data | The amount of the asset traded over a specific period, providing insights into market activity. |
| Market Events | Historical events that may have influenced price movements, such as economic reports or geopolitical events. |
Once you’ve analyzed your historical data, you can begin to assess your trading strategy's performance. Look at key metrics such as win rate, risk-to-reward ratio, and maximum drawdown. These metrics will help you determine whether your strategy is robust enough to withstand market fluctuations. If you find that your strategy isn’t performing as expected, don’t be discouraged! This is where optimization comes into play.
Optimization involves tweaking various elements of your trading strategy to improve its performance. This could mean adjusting your entry and exit points, refining your risk management techniques, or even incorporating new indicators. The goal is to create a strategy that not only performs well in backtesting but is also adaptable to changing market conditions.
However, be cautious! Over-optimizing can lead to a phenomenon known as curve fitting, where your strategy performs exceptionally well on historical data but fails to deliver in real-time trading. It’s essential to strike a balance between optimization and realism. Always keep in mind that the market is dynamic, and a strategy that worked in the past may not necessarily work in the future.
In conclusion, backtesting and optimization are critical components of developing a successful trading strategy. By analyzing historical data and making informed adjustments, you can enhance your strategy’s performance and increase your confidence in your trading decisions. Remember, the road to trading success is paved with patience and persistence!
- What is backtesting? Backtesting is the process of applying a trading strategy to historical data to evaluate its effectiveness.
- Why is backtesting important? It helps traders assess how a strategy would have performed in the past, allowing for adjustments before risking real money.
- What should I look for in backtesting results? Key metrics include win rate, risk-to-reward ratio, and maximum drawdown.
- What is optimization? Optimization involves refining a trading strategy to improve its performance based on backtesting results.
- What is curve fitting? Curve fitting occurs when a strategy is overly optimized to historical data, leading to poor performance in real-time trading.

Using Historical Data
When it comes to trading, the past is not just a distant memory; it's a treasure trove of insights waiting to be uncovered. is akin to having a map that guides you through the unpredictable terrain of the financial markets. By analyzing past price movements, trading volumes, and market conditions, traders can gain invaluable knowledge that helps refine their strategies. Think of it like studying the weather patterns before planning a picnic—knowing what to expect can save you from getting drenched!
To effectively use historical data, traders often turn to various resources and tools. These can include financial news archives, trading platforms with built-in analytics, and specialized software designed for data analysis. The key is to focus on collecting data that is relevant to your trading style and the instruments you’re interested in. For instance, if you’re a day trader, you might want to look at minute-by-minute charts, while swing traders could benefit from daily or weekly data.
Here are some critical aspects to consider when utilizing historical data:
- Data Quality: Ensure that the data you are using is accurate and comprehensive. Inaccurate data can lead to misguided conclusions and poor trading decisions.
- Time Frame: Choose a time frame that aligns with your trading strategy. Longer time frames can provide a broader perspective, while shorter frames can help identify more immediate trends.
- Market Conditions: Always consider the market conditions during the period you are analyzing. Economic events, geopolitical situations, and market sentiment can all influence price movements.
Once you have gathered your historical data, it’s time to analyze it. This is where the magic happens! By applying various analytical techniques, such as moving averages or Fibonacci retracement levels, you can spot trends and patterns that may repeat themselves in the future. For example, if you notice that a particular stock tends to bounce back after hitting a specific price level, you might consider that level as a potential entry point for your trades.
Moreover, backtesting your trading strategies against historical data is crucial. This process involves simulating trades based on past market conditions to see how your strategy would have performed. It’s like rehearsing for a play; the more you practice, the more confident you become. By analyzing the results of your backtesting, you can make informed adjustments to your strategy, enhancing its effectiveness for future trades.
In conclusion, using historical data is not just about looking back; it's about leveraging the past to make smarter trading decisions today. By understanding how to collect, analyze, and apply this data, you can significantly improve your trading strategy and increase your chances of success in the markets.
- What is historical data in trading? Historical data refers to past price movements, trading volumes, and market conditions that traders analyze to inform their trading strategies.
- How do I collect historical data? You can collect historical data from trading platforms, financial news archives, and specialized data analysis software.
- Why is backtesting important? Backtesting allows traders to simulate their strategies against historical data to evaluate their effectiveness and make necessary adjustments.
- What time frame should I use for historical data analysis? The time frame depends on your trading style; day traders may prefer minute charts, while swing traders might look at daily or weekly charts.

Adjusting Strategies
Adjusting your trading strategies is not just a good practice; it's a necessity in the ever-changing landscape of the financial markets. Just like a seasoned chef tweaks a recipe based on the ingredients at hand, traders must be flexible and responsive to market conditions. The beauty of backtesting is that it provides a treasure trove of data, allowing you to see what worked in the past and what didn’t. But how do you translate that historical insight into actionable changes? Let’s dive into a few key ways to adjust your strategies effectively.
First and foremost, it’s crucial to analyze the results of your backtesting comprehensively. This means looking beyond just the profit and loss figures. You need to consider factors like the win/loss ratio, maximum drawdown, and the overall volatility of your strategy. By dissecting these metrics, you can identify patterns that may suggest necessary adjustments. For example, if your strategy shows a high win rate but also a significant drawdown, it might be time to tweak your stop-loss settings or refine your entry points.
Another important aspect of adjusting your strategies is to stay informed about market conditions. Economic factors, geopolitical events, and even seasonal trends can influence market behavior. For instance, if you notice that your strategy performs well during certain market conditions but poorly during others, you might want to consider implementing filters that only allow trades under favorable conditions. This could involve setting criteria based on volatility indicators or macroeconomic data releases.
Moreover, the psychological aspect of trading cannot be overlooked. Many traders struggle with emotional decision-making, which can lead to inconsistent performance. To combat this, consider incorporating a structured approach to your trading plan. This could mean setting predefined rules for entering and exiting trades, as well as guidelines for adjusting your strategy based on performance metrics. By creating a disciplined framework, you can reduce the impact of emotions and make more rational decisions.
Lastly, don't shy away from experimenting with new ideas and techniques. The financial markets are dynamic, and what works today may not work tomorrow. Keeping an open mind and being willing to test new strategies can lead to innovative approaches that enhance your trading performance. Utilize demo accounts to practice these adjustments without risking real capital. This way, you can fine-tune your approach in a risk-free environment before committing to live trades.
In summary, adjusting your trading strategies is an ongoing process that requires vigilance and adaptability. By analyzing your backtesting results, staying informed about market conditions, maintaining a disciplined approach, and being open to experimentation, you can continually refine your trading strategies for optimal performance. Remember, in trading, flexibility can be your best friend!
- What is the importance of adjusting trading strategies?
Adjusting trading strategies is crucial as it allows traders to adapt to changing market conditions, improve performance, and minimize losses. - How often should I adjust my trading strategy?
There’s no one-size-fits-all answer, but regular reviews—perhaps after significant market events or at the end of each trading month—can help ensure your strategies remain effective. - Can I use automated tools to adjust my trading strategies?
Yes! Many traders utilize automated trading systems that can help analyze market conditions and adjust strategies based on predefined parameters. - What metrics should I focus on when adjusting my strategy?
Key metrics include win/loss ratio, maximum drawdown, and overall profitability, as these provide insights into your strategy’s effectiveness.
Frequently Asked Questions
- What is technical analysis in trading?
Technical analysis is a method used to evaluate and forecast the price movements of financial assets by analyzing historical price data and trading volumes. Unlike fundamental analysis, which focuses on a company's financial health and market factors, technical analysis relies on chart patterns, indicators, and trends to make trading decisions.
- How do I identify support and resistance levels?
Support and resistance levels can be identified by looking at historical price charts. Support is typically found at price levels where an asset has previously bounced back up, while resistance is where the price has struggled to move higher. Drawing horizontal lines at these levels can help visualize potential entry and exit points for trades.
- What are some common chart patterns I should know?
Some common chart patterns include the head and shoulders, double tops and bottoms, and triangles. Each pattern suggests potential market movements and can indicate whether to buy or sell. Recognizing these patterns can enhance your ability to predict future price actions.
- Why is risk management important in trading?
Risk management is crucial because it helps protect your capital and minimize potential losses. By employing strategies like position sizing and stop-loss orders, traders can maintain discipline and ensure that no single trade can significantly impact their overall portfolio.
- What is backtesting and why is it necessary?
Backtesting is the process of testing a trading strategy using historical data to see how it would have performed in the past. It is necessary because it allows traders to validate their strategies, identify potential weaknesses, and make adjustments before risking real money in the market.
- How can I adjust my trading strategy based on backtesting results?
After backtesting, you can analyze the results to identify patterns in performance. For example, if a strategy consistently underperforms in certain market conditions, you can tweak your approach, such as adjusting entry and exit points or altering the indicators used to better align with market behavior.