How to Develop a Technical Trading Routine
In the fast-paced world of trading, having a solid technical trading routine is akin to having a well-oiled machine. Just like a chef relies on precise measurements and techniques to whip up a delicious dish, traders must develop a systematic approach to navigate the complexities of the market. This article will delve into the essential components of creating a successful technical trading routine, including strategies, tools, and best practices that can significantly enhance your trading performance and decision-making.
Technical analysis is the backbone of a robust trading routine. It involves evaluating securities by analyzing statistics generated by market activity, such as price movements and trading volumes. Think of it as reading a map before embarking on a journey; without it, you're likely to get lost in the wilderness of market fluctuations. By understanding patterns and trends, traders can make informed decisions about when to enter or exit trades. This section will cover the basics of technical analysis and its importance in developing a trading routine.
Selecting the appropriate software and tools is crucial for effective technical trading. Just as a carpenter needs the right tools to build a sturdy house, traders require specific instruments to analyze the market effectively. In this section, we'll discuss various tools that can streamline your trading process, ensuring that you have everything you need to make informed decisions.
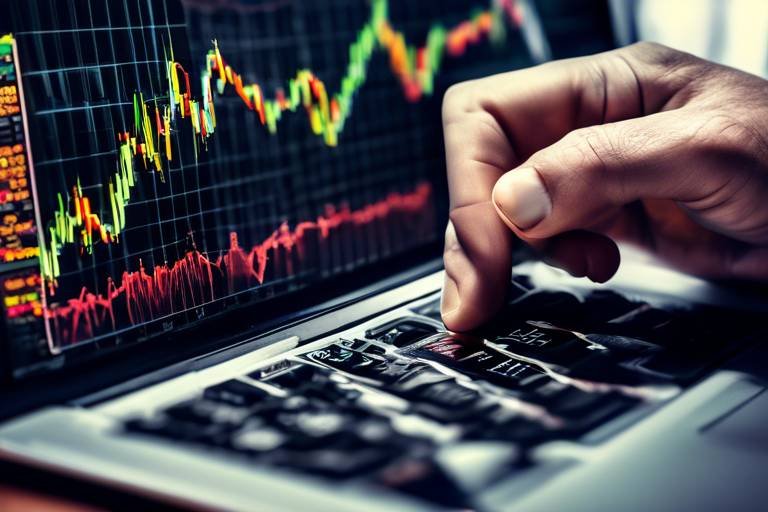
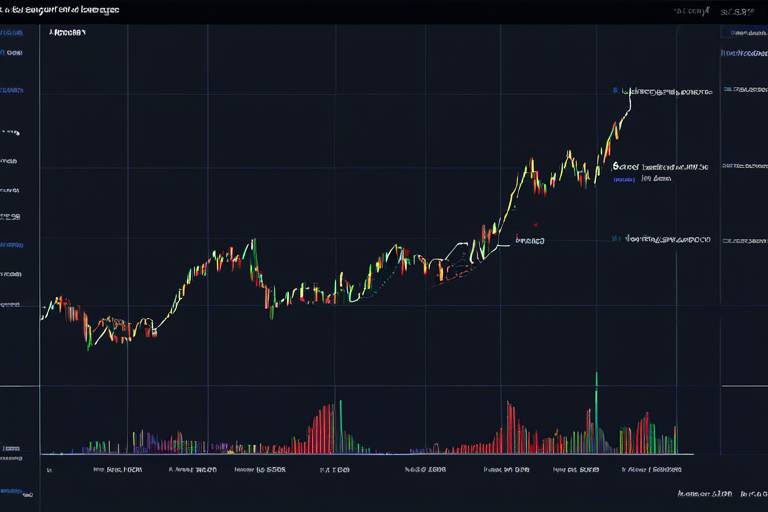
Charting software is vital for visualizing market data. Imagine trying to navigate a city without a map; that's how challenging trading can be without the right charts. When choosing charting software, look for features that suit your trading style, such as:
- Customizable chart types (candlestick, line, bar)
- Real-time data updates
- User-friendly interface
- Multiple time frame analysis
These features will help you dissect market movements and make more informed trading decisions.
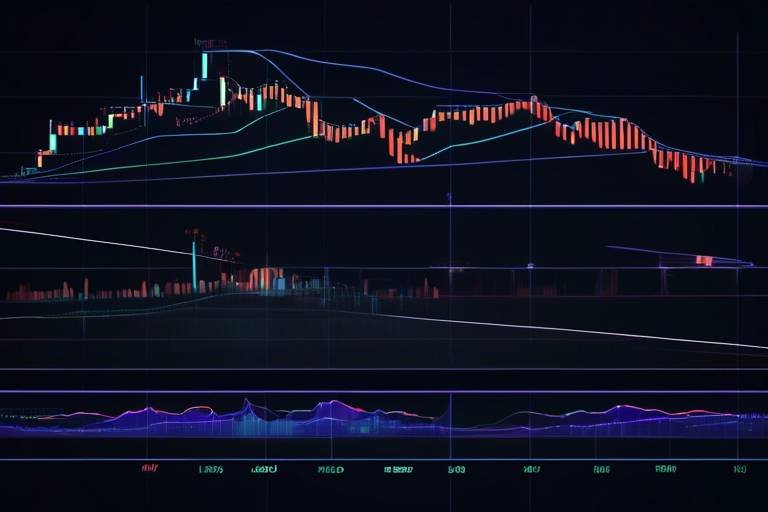
Indicators and overlays enhance chart analysis by providing additional data points that can signal potential market movements. Popular indicators include:
- Moving Averages: Helps smooth price data to identify trends.
- Relative Strength Index (RSI): Measures the speed and change of price movements to identify overbought or oversold conditions.
- Bollinger Bands: Indicates volatility and potential price reversals.
Incorporating these indicators into your technical analysis routine can provide deeper insights into market dynamics.
Backtesting tools allow traders to simulate trading strategies using historical data. They are essential for validating your trading approach before risking real capital. By analyzing how a strategy would have performed in the past, you can refine your techniques and build confidence. This section discusses their significance in refining trading techniques and ensuring that you are not just gambling on the market.
A well-defined trading plan is essential for consistency. Think of it as your trading blueprint; without it, you're likely to wander aimlessly. Key components of an effective trading plan include:
- Clear entry and exit criteria
- Risk management strategies
- Performance evaluation metrics
By having a structured plan in place, you can minimize emotional decision-making and stick to your strategy, even during turbulent market conditions.
Consistency in trading requires a structured schedule. Just like a sports team practices at specific times to hone their skills, traders must allocate time to analyze markets and execute trades. This section highlights how to create a daily or weekly routine that accommodates market hours and personal commitments. By setting a specific trading schedule, you can enhance your focus and discipline, which are crucial for success.
Effective time management is critical for traders, as it helps balance trading activities with other responsibilities. Consider using techniques such as:
- Prioritizing tasks based on their importance
- Setting specific time blocks for trading and analysis
- Utilizing tools like calendars and reminders to stay organized
These strategies can help you maintain a healthy work-life balance while still being an effective trader.
Regularly reviewing and adjusting your trading routine can lead to continuous improvement. Just as athletes analyze their performance to enhance their skills, traders must assess their strategies to identify areas for growth. This section discusses the importance of self-assessment in trading success, emphasizing that adaptation is key in the ever-changing market landscape.
1. What is the best time frame for trading?
The best time frame depends on your trading style. Day traders often prefer shorter time frames, while swing traders may focus on daily or weekly charts.
2. How much capital do I need to start trading?
It varies by strategy, but starting with at least a few hundred dollars is advisable to allow for effective risk management.
3. Can I trade part-time?
Absolutely! Many traders successfully manage part-time trading alongside their regular jobs by establishing a structured routine.
4. What is the importance of backtesting?
Backtesting helps validate your trading strategies using historical data, ensuring that you have a well-researched plan before risking real money.
Understanding Technical Analysis
When diving into the world of trading, one of the first concepts you'll encounter is technical analysis. But what exactly does that mean? In simple terms, technical analysis is the study of price movements and trading volumes in the financial markets. It’s like being a detective, piecing together clues from market data to forecast future price actions. Instead of focusing on the intrinsic value of a stock or asset, technical analysts look at historical price patterns, trends, and various market indicators to make educated trading decisions.
Imagine you're trying to predict the weather. Instead of just asking a meteorologist about the climate, you might analyze past weather patterns, check the temperature, humidity, and wind speed. Similarly, in technical analysis, traders examine charts and historical data to identify patterns that suggest where the market might head next. This method is particularly useful because it allows traders to make decisions based on market psychology rather than just fundamental factors.
So why is technical analysis important for developing a trading routine? Well, it provides a systematic approach to trading that can enhance your decision-making process. By understanding how to read charts and interpret indicators, you can identify potential entry and exit points, manage risk more effectively, and ultimately increase your chances of success in the market.
Here are a few key components of technical analysis that every trader should be aware of:
- Price Trends: Recognizing whether a market is trending upwards, downwards, or moving sideways is crucial. Trends can signal potential opportunities.
- Support and Resistance Levels: These are price levels where the asset tends to reverse direction. Understanding these can help you set your stop-loss and take-profit orders.
- Volume Analysis: Volume indicates the strength of a price movement. High volume during a price increase suggests strong buying interest, while low volume may indicate a lack of conviction.
To get started with technical analysis, traders often rely on charts. There are several types of charts, including line charts, bar charts, and candlestick charts, each providing different insights into price behavior. Among these, candlestick charts are particularly popular due to their ability to convey a wealth of information in a compact format. Each candlestick represents a specific time period and shows the opening, closing, high, and low prices, giving traders a clearer picture of market sentiment.
Ultimately, mastering technical analysis is about practice and patience. Like any skill, it takes time to learn how to interpret charts and indicators effectively. The more you familiarize yourself with different patterns and tools, the more intuitive your trading decisions will become. So, as you develop your trading routine, make sure to dedicate time to studying and practicing technical analysis—it’s a game-changer for traders!

Choosing the Right Tools
When it comes to technical trading, the tools you choose can make all the difference between success and failure. Imagine trying to build a house without a hammer or a saw; it would be nearly impossible, right? The same principle applies to trading. Without the right tools, you're essentially trading blind. So, what should you look for when selecting your trading arsenal? Let's dive into this essential aspect of developing your trading routine.
First off, you want to ensure that your tools can provide you with accurate and timely data. Real-time data is crucial for making informed trading decisions. If your software lags or fails to update, you could miss out on significant market movements. Therefore, look for platforms that offer real-time quotes and alerts. Additionally, consider the user interface. A clean, intuitive design can help you navigate the complexities of the market with ease. After all, you don’t want to waste precious time figuring out how to use your tools when you could be analyzing data and making trades.
Another vital component is the availability of various features. Here are some key features to consider:
- Customizable Charts: The ability to tailor your charts to fit your trading style can provide you with a clearer picture of market trends.
- Technical Indicators: Look for tools that offer a wide range of indicators, such as moving averages, Bollinger Bands, and RSI, to help you analyze price movements.
- Backtesting Capabilities: This feature allows you to test your strategies against historical data, giving you insights into what works and what doesn’t.
Don't overlook the importance of customer support. When you're in the heat of trading, having access to reliable customer service can save you a lot of headaches. Whether it's a technical glitch or a question about a feature, prompt assistance can keep you focused on your trading strategy rather than troubleshooting issues.
Lastly, consider the cost of the tools. Some platforms offer free trials, which can be a great way to test the waters without any financial commitment. However, be cautious of free tools that may compromise on features or data accuracy. In the long run, investing in reliable tools can pay off significantly.
In summary, the right tools can empower you to make informed decisions and execute trades effectively. By carefully evaluating your options and ensuring that your chosen tools align with your trading style and needs, you set yourself up for success in the ever-evolving world of technical trading.
Charting Software
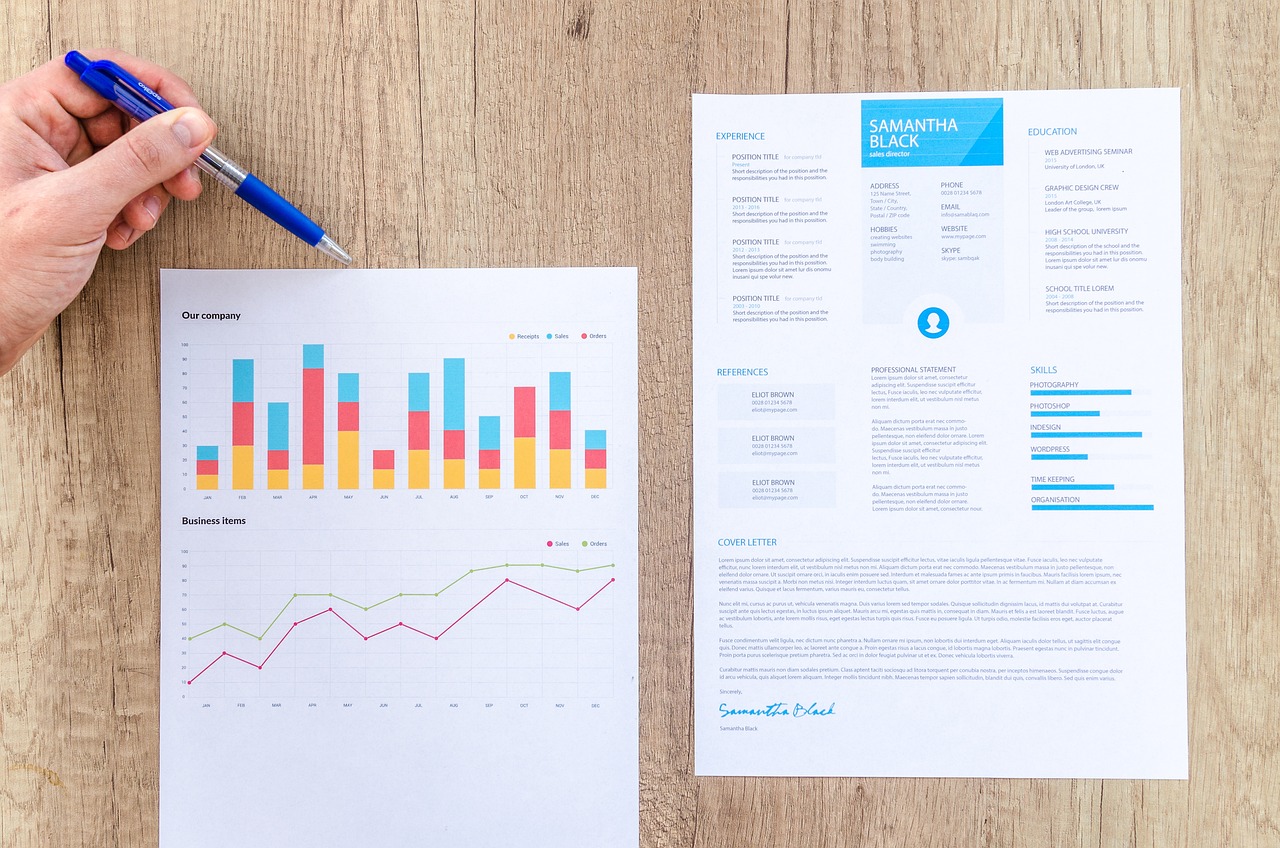
When it comes to technical trading, is your best friend. Think of it as your personal navigator in the vast ocean of market data. Just like a sailor relies on a compass and maps to steer their ship, traders depend on charting tools to visualize price movements and trends. But not all charting software is created equal, and choosing the right one can significantly impact your trading success. So, what should you look for?
First and foremost, the user interface is crucial. You want a platform that is intuitive and easy to navigate. If you’re spending more time trying to figure out how to use the software than actually analyzing the charts, it’s time to reconsider your choice. Look for features like drag-and-drop functionality, customizable layouts, and a clean design that allows you to focus on what matters most: the data.
Next, consider the type of charts available. Different traders have different preferences; some may favor candlestick charts for their detailed information, while others might prefer line charts for their simplicity. A good charting software should offer a variety of chart types and allow you to switch between them effortlessly. This flexibility is essential for adapting your analysis to different market conditions.
Another vital aspect is the availability of real-time data. In the fast-paced world of trading, having the most current information at your fingertips can make all the difference. Look for software that provides real-time quotes and updates, ensuring you’re always in the loop. Additionally, consider whether the software offers historical data, which is crucial for backtesting your strategies and understanding past market behavior.
Finally, let’s talk about indicators and overlays. These tools can enhance your analysis by providing insights into market trends and potential price movements. A robust charting software should come equipped with a variety of indicators such as moving averages, Bollinger Bands, and RSI (Relative Strength Index). Make sure you can easily add or remove these indicators to tailor your analysis according to your trading strategy.
In summary, the right charting software can be a game-changer in your trading routine. By focusing on user-friendliness, variety of chart types, real-time data, and comprehensive indicators, you can set yourself up for success. Remember, the goal is not just to analyze data but to make informed decisions that lead to profitable trades. So, invest some time in finding the charting software that best suits your needs, and watch your trading performance soar!
- What is charting software? Charting software is a tool that allows traders to visualize market data through various chart types, helping them analyze price movements and trends.
- Do I need to pay for charting software? While there are free options available, many traders find that paid software offers more features, better data, and enhanced usability.
- Can I use charting software on my mobile device? Many modern charting platforms offer mobile applications, allowing you to trade and analyze charts on the go.

Indicators and Overlays
When it comes to technical trading, are your best friends. They serve as essential tools that help traders make sense of the often chaotic market movements. Think of them as the GPS for your trading journey; without them, you might find yourself lost in a sea of numbers and charts. But what exactly are these indicators and overlays, and how can they enhance your trading routine?
Indicators are mathematical calculations based on the price, volume, or open interest of a security. They provide insights into market trends and potential price movements, allowing traders to make more informed decisions. Common indicators include:
- Moving Averages: These smooth out price data to help identify trends over a specific period. They can be simple (SMA) or exponential (EMA), each serving different purposes.
- Relative Strength Index (RSI): This momentum oscillator measures the speed and change of price movements, helping traders identify overbought or oversold conditions.
- Bollinger Bands: These consist of a middle band (a moving average) and two outer bands that indicate volatility. When the bands widen, it signals increased volatility; when they contract, it suggests a potential price squeeze.
On the other hand, overlays are indicators that are plotted directly on the price chart. They help traders visualize the price action in conjunction with the indicators, providing a clearer picture of market dynamics. Examples of popular overlays include:
- Trend Lines: These lines connect significant price points, helping traders identify the direction of the market.
- Fibonacci Retracement Levels: These horizontal lines indicate potential support and resistance levels based on the Fibonacci sequence, assisting traders in making entry and exit decisions.
Incorporating indicators and overlays into your technical analysis routine can significantly enhance your trading performance. However, it's crucial to remember that no single indicator is foolproof. The key is to use a combination of indicators that complement each other. For instance, you might use the RSI to gauge overbought or oversold conditions while simultaneously analyzing moving averages to confirm the trend direction.
Moreover, backtesting your strategies with these indicators can provide invaluable insights into their effectiveness. By applying historical data to your chosen indicators, you can assess how well they would have performed in the past, giving you the confidence to rely on them in real-time trading scenarios.
In summary, indicators and overlays are not just fancy tools; they are the backbone of a successful trading strategy. By understanding how to utilize them effectively, you can navigate the complexities of the market with greater ease and confidence. So, as you develop your technical trading routine, ensure that you dedicate time to learning and mastering these essential elements!

Backtesting Tools
Backtesting tools are the unsung heroes of the trading world, allowing traders to test their strategies against historical data before risking real money. Imagine trying to navigate a maze without knowing where the walls are—this is what trading without backtesting feels like! By simulating trades based on past market conditions, you can gain invaluable insights into how your strategy might perform in the future.
One of the primary advantages of backtesting is that it helps you identify the strengths and weaknesses of your trading strategy. For instance, if you discover that your strategy consistently loses money during certain market conditions, you can tweak it accordingly. This process not only saves you from potential losses but also builds your confidence as a trader. After all, who wouldn’t want to step into the trading arena armed with data-backed strategies?
When choosing backtesting tools, consider the following key features:
- User-Friendly Interface: Look for software that is easy to navigate, even if you’re not a tech whiz.
- Comprehensive Data: Ensure the tool provides access to a wide range of historical data, including different time frames and market conditions.
- Customization Options: The ability to customize your parameters is crucial for tailoring the backtest to your specific strategy.
- Performance Metrics: Check if the tool offers detailed reports on various performance metrics, such as win rate, drawdown, and profit factor.
There are several popular backtesting tools available on the market, each with its unique features. Here’s a quick overview:
| Tool Name | Key Features | Best For |
|---|---|---|
| MetaTrader 4/5 | Built-in strategy tester, extensive community support | Forex and CFD traders |
| TradingView | Custom scripts, social networking features | Stock and cryptocurrency traders |
| Amibroker | Powerful backtesting engine, advanced analytics | Advanced traders |
Utilizing backtesting tools can significantly improve your trading performance. However, it’s essential to remember that past performance does not guarantee future results. Always combine backtesting with a solid understanding of market dynamics and risk management. As you refine your trading strategies through backtesting, you’ll find yourself more prepared and confident to tackle the ever-changing market landscape.
Q: What is backtesting in trading?
A: Backtesting is the process of testing a trading strategy using historical data to see how it would have performed in the past.
Q: Why is backtesting important?
A: It helps traders identify the effectiveness of their strategies, allowing them to make data-driven decisions before risking real money.
Q: Can I rely solely on backtesting results?
A: No, while backtesting provides valuable insights, it should be used in conjunction with market analysis and risk management.

Setting Up a Trading Plan
Creating an effective trading plan is like drawing a roadmap for your financial journey. Without a clear direction, you might find yourself lost in the chaotic world of trading, where emotions can easily cloud your judgment. A solid trading plan not only outlines your trading strategies but also helps you maintain discipline and consistency in your approach. So, let's dive into the essential components that make up a successful trading plan!
The first step in setting up your trading plan is to define your trading goals. Are you looking to generate a steady income, or are you more focused on long-term wealth accumulation? Establishing clear objectives will provide you with a sense of purpose and direction. For instance, you might aim to achieve a specific percentage return on your investment over a certain period. This clarity will help you navigate your trades with confidence.
Next, you’ll want to determine your risk tolerance. This is crucial because it dictates how much capital you are willing to risk on each trade. Everyone has a different comfort level when it comes to risk, so take some time to assess your financial situation and emotional capacity. A good rule of thumb is to risk no more than 1-2% of your trading capital on a single trade. This way, even a series of losses won’t derail your entire trading journey.
Now that you have your goals and risk tolerance in place, it’s time to outline your trading strategies. This is where you can get creative! Your strategies should be based on technical analysis, market trends, and your personal trading style. For example, you might focus on day trading, swing trading, or even long-term investing. Whatever your choice, make sure to document your strategies in detail, including entry and exit points, as well as the indicators you will use to make trading decisions.
Another vital component of your trading plan is to establish entry and exit rules. These rules will help you make objective decisions rather than emotional ones. For instance, you could set a rule to enter a trade when a specific indicator signals a buy and exit when it shows a sell. Having these rules in place can prevent you from second-guessing yourself and keep you focused on your plan.
Additionally, don't forget to include a section on trade management. This involves setting stop-loss and take-profit levels for each trade. A stop-loss will protect you from excessive losses, while a take-profit level will ensure you lock in gains when the market moves in your favor. You can use a simple table to outline your trade management strategy:
| Trade Type | Entry Point | Stop-Loss | Take-Profit |
|---|---|---|---|
| Long Trade | $50 | $48 | $55 |
| Short Trade | $60 | $62 | $55 |
Once you have your trading plan drafted, it’s crucial to test and refine it. Consider using backtesting tools to simulate your strategies against historical data. This will give you invaluable insights into how your plan would have performed in different market conditions. Remember, a trading plan is not set in stone; it should evolve as you gain more experience and as market dynamics change.
Finally, make it a habit to review your trading plan regularly. Set aside time weekly or monthly to evaluate your performance, assess what’s working, and identify areas for improvement. This self-reflection will not only enhance your trading skills but also keep you accountable to your goals.
In summary, setting up a trading plan is a fundamental step in your trading journey. By defining your goals, understanding your risk tolerance, outlining your strategies, and committing to regular reviews, you’ll be well on your way to becoming a more disciplined and successful trader. So, grab your pen and paper, or open up that document, and start crafting your winning trading plan today!
- What is a trading plan? A trading plan is a comprehensive document that outlines your trading strategies, goals, risk tolerance, and rules for entering and exiting trades.
- Why is a trading plan important? A trading plan helps you stay disciplined, make informed decisions, and manage your risks effectively, leading to better trading outcomes.
- How often should I review my trading plan? It's advisable to review your trading plan regularly, ideally on a weekly or monthly basis, to ensure it remains aligned with your goals and market conditions.
- Can I change my trading plan? Absolutely! Your trading plan should evolve as you gain experience and as market dynamics change. Regular adjustments can help you stay on track and improve your trading performance.

Establishing a Trading Schedule
Establishing a trading schedule is like setting the rhythm for a dance; it creates a flow that can significantly enhance your trading performance. Just as dancers practice their routines to perfect their moves, traders must also develop a structured schedule that aligns with market hours and personal commitments. The financial markets operate on specific hours, and your trading schedule should reflect that, ensuring you're available to make informed decisions when opportunities arise.
One of the first steps in creating a trading schedule is to identify the markets you want to trade. Are you focusing on stocks, forex, or cryptocurrencies? Each market has its own trading hours, and understanding these can help you plan your day effectively. For example, if you're trading forex, you'll want to be aware of the major trading sessions—Asian, European, and North American—and how they overlap. This knowledge allows you to capitalize on increased volatility and liquidity during those periods.
Next, consider your personal commitments. Are you working a full-time job, or do you have family obligations? Balancing your trading activities with other responsibilities is crucial. It might be helpful to create a weekly planner that outlines your trading hours alongside your personal commitments. This can be as simple as a table that breaks down your week:
| Day | Trading Hours | Personal Commitments |
|---|---|---|
| Monday | 9 AM - 12 PM | Work |
| Tuesday | 1 PM - 3 PM | Gym |
| Wednesday | 10 AM - 1 PM | Work |
| Thursday | 2 PM - 4 PM | Family Time |
| Friday | 9 AM - 11 AM | Work |
| Saturday | 10 AM - 12 PM | Free Time |
| Sunday | 1 PM - 3 PM | Preparation for the Week |
This schedule not only helps you visualize your week but also ensures that you dedicate sufficient time to your trading activities. Remember, consistency is key. By sticking to your trading hours, you’ll develop a routine that reinforces your trading discipline.
Moreover, consider employing time management techniques to maximize your productivity during trading hours. Techniques such as the Pomodoro Technique, where you work in focused bursts followed by short breaks, can help maintain your concentration and prevent burnout. This approach allows you to stay sharp and make better trading decisions without feeling overwhelmed.
Lastly, don't forget the importance of flexibility in your trading schedule. The markets are dynamic, and sometimes unexpected events can impact your trading plans. Be prepared to adjust your schedule as needed while still maintaining your overall trading routine. This adaptability can be the difference between seizing an opportunity and missing out.
In conclusion, establishing a trading schedule is a vital step in your journey as a trader. By aligning your trading hours with market activity and personal commitments, you set the stage for better decision-making and improved trading performance. So, grab your planner, mark those trading hours, and get ready to dance with the markets!
- How do I determine the best trading hours for me?
Consider your personal commitments and the market hours of the assets you want to trade. Align them to create a schedule that works for you. - What if I miss my trading hours?
Don’t panic! Focus on the next trading opportunity and adjust your schedule as necessary to accommodate your commitments. - Can I trade part-time and still be successful?
Absolutely! Many successful traders operate part-time. The key is to be disciplined during your trading hours and make the most of the time you have.

Time Management Techniques
Time management is a crucial skill for traders seeking to maximize their efficiency and performance. Without a structured approach, it's easy to become overwhelmed by the fast-paced nature of trading. Imagine trying to navigate a bustling city without a map; you'd likely waste time and miss out on key opportunities. Similarly, effective time management can help you navigate the trading landscape with confidence and clarity.
One of the most effective techniques is the Pomodoro Technique, which involves breaking your work into intervals, typically 25 minutes long, followed by a short break. This method not only enhances focus but also prevents burnout. By concentrating on your trading tasks for a set period, you can improve your decision-making abilities and maintain a high level of engagement. After each Pomodoro, take a moment to stretch or grab a quick snack—this helps refresh your mind and keeps your energy levels up.
Another technique to consider is the Time Blocking method. This involves scheduling specific blocks of time for different activities throughout your day. For instance, you might dedicate the first hour of your trading day to analyzing charts and the next hour to executing trades. By assigning specific tasks to specific time slots, you create a structured routine that minimizes distractions and enhances productivity. Here’s a simple example of how you might structure your trading day:
| Time | Activity |
|---|---|
| 8:00 AM - 9:00 AM | Market Analysis |
| 9:00 AM - 10:00 AM | Executing Trades |
| 10:00 AM - 10:30 AM | Reviewing Performance |
| 10:30 AM - 11:00 AM | Break |
| 11:00 AM - 12:00 PM | Researching New Strategies |
Additionally, employing a Daily Review process can significantly enhance your time management. At the end of each trading day, take a few minutes to reflect on what went well and what could be improved. Ask yourself questions like, "Did I stick to my trading plan?" and "What distractions affected my focus?" This self-assessment not only helps you identify areas for improvement but also reinforces successful habits.
Lastly, don’t underestimate the power of setting priorities. Not all tasks hold the same weight in your trading routine. Use the Eisenhower Matrix to categorize tasks based on urgency and importance. This will help you focus on what truly matters, ensuring that your time is spent on activities that enhance your trading performance rather than on less impactful tasks.
In summary, mastering time management techniques is essential for any trader looking to improve their routine. By implementing methods like the Pomodoro Technique, Time Blocking, Daily Reviews, and prioritizing tasks, you can create a more structured and effective trading routine. Remember, the goal is not just to work harder but to work smarter, freeing up time for analysis, strategy development, and even personal relaxation.
- What is the Pomodoro Technique? The Pomodoro Technique is a time management method that breaks work into intervals, typically 25 minutes long, followed by short breaks to enhance focus and productivity.
- How can I prioritize my trading tasks? You can use the Eisenhower Matrix to categorize tasks based on their urgency and importance, helping you focus on what matters most in your trading routine.
- Why is a daily review important? A daily review allows you to reflect on your trading performance, identify areas for improvement, and reinforce successful habits, ultimately leading to better trading outcomes.

Review and Adjust Your Routine
In the fast-paced world of trading, the only constant is change. As market conditions fluctuate, so too should your trading routine. Regularly reviewing and adjusting your routine can be the key to unlocking greater success. Think of it like tuning a musical instrument; if you don’t regularly check the strings, the melody will fall flat. By taking the time to reflect on your trading practices, you can identify what's working and what isn’t.
Start by setting aside time each week to assess your performance. This could be as simple as jotting down your trades in a journal, noting the outcomes and the emotions you experienced during each trade. Ask yourself questions like:
- What strategies yielded the best results?
- Were there any trades that didn’t go as planned? Why?
- How did my emotional state affect my decision-making?
By systematically analyzing your trades, you’ll begin to see patterns emerge. Maybe you find that you consistently make poor decisions during high-stress periods, or perhaps certain market conditions lead to better outcomes for you. This insight is invaluable; it allows you to adapt your strategy to enhance your overall performance.
Moreover, consider leveraging technology to aid in this process. Many trading platforms offer built-in analytics that can help you visualize your performance over time. You can track metrics such as win-loss ratios, average profit per trade, and even the time of day when you are most successful. Data-driven decisions are often more effective than gut feelings, and this is where technology can be your best friend.
Additionally, don’t hesitate to seek feedback from fellow traders or mentors. Engaging in discussions about your routine can provide fresh perspectives and ideas that you might not have considered. It’s like having a coach who can spot your blind spots and guide you toward improvement.
Finally, be willing to make adjustments based on your findings. If certain strategies aren’t yielding results, don’t be afraid to pivot. Trading is not a one-size-fits-all endeavor; what works for one trader may not work for another. Embrace the notion of flexibility in your routine, and remember that the ultimate goal is to enhance your trading performance.
In summary, reviewing and adjusting your trading routine is not just beneficial; it’s essential. By regularly assessing your performance, utilizing technology, seeking feedback, and remaining adaptable, you can create a dynamic trading routine that evolves alongside the markets.
- How often should I review my trading routine?
It's recommended to review your routine at least once a week to stay aligned with market changes and your personal performance. - What should I focus on during my review?
Focus on your trading outcomes, emotional responses, and any patterns that emerge from your trades. - Can technology really help improve my trading?
Absolutely! Utilizing analytics tools can provide valuable insights that help you make informed decisions. - Is it normal to feel emotional during trading?
Yes, trading can be emotionally taxing. Acknowledging these feelings and understanding their impact on your decisions is crucial for improvement.
Frequently Asked Questions
- What is technical analysis and why is it important?
Technical analysis is the study of past market data, primarily price and volume, to forecast future price movements. It’s crucial because it helps traders make informed decisions based on statistical trends rather than emotions. Think of it as using a compass; it guides you through the chaotic seas of the market!
- How do I choose the right trading tools?
Choosing the right trading tools involves identifying your trading style and the features you need. Look for software that offers robust charting capabilities, user-friendly interfaces, and essential indicators. It’s like picking the best tools for a DIY project; the right ones make all the difference!
- What should I include in my trading plan?
Your trading plan should outline your trading goals, risk tolerance, entry and exit strategies, and rules for managing trades. It’s your roadmap in the trading world, ensuring you stay on course and avoid getting lost in the noise!
- How often should I review my trading routine?
Regular reviews, ideally weekly or monthly, are essential to assess what’s working and what isn’t. This self-assessment helps you refine your strategies and adapt to changing market conditions, much like a coach reviewing game footage to improve performance.
- What are some effective time management techniques for traders?
Effective time management techniques include setting specific trading hours, using timers for focused trading sessions, and prioritizing tasks. Organizing your schedule can help you balance trading with other responsibilities, ensuring you don’t feel overwhelmed.
- How can backtesting improve my trading strategies?
Backtesting allows you to simulate your trading strategies against historical data, giving you insights into their potential effectiveness. It’s like a dress rehearsal before the big show, helping you tweak your performance for optimal results!
- What indicators should I focus on for technical trading?
Popular indicators include Moving Averages, Relative Strength Index (RSI), and Bollinger Bands. Each serves a unique purpose, so it’s important to understand them and how they fit into your overall strategy, just like having a versatile toolkit for various tasks!


