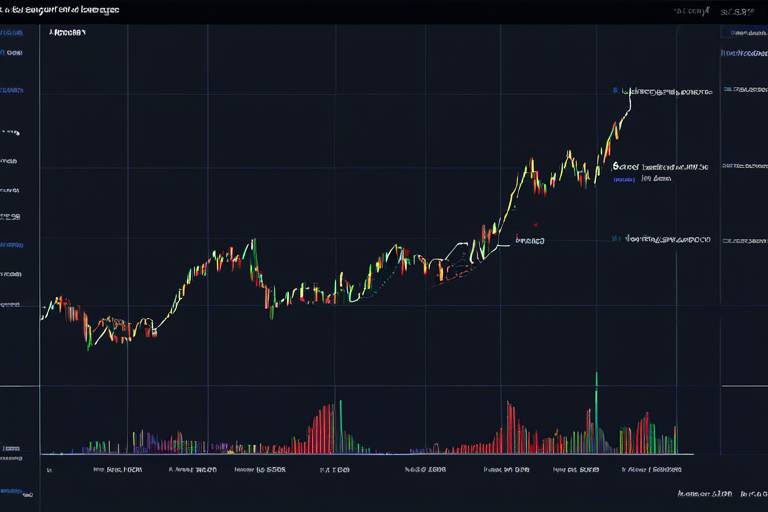
How to Use Moving Averages for Crypto Market Predictions
In the ever-evolving world of cryptocurrency, predicting market trends can feel like trying to catch smoke with your bare hands. The volatility is wild, and the stakes are high. However, one of the most reliable tools at a trader's disposal is the moving average. By utilizing moving averages, you can smooth out the chaotic price data and gain a clearer picture of where the market might be headed. This article will guide you through the ins and outs of moving averages, their types, and how you can leverage them to enhance your trading strategies.
So, what exactly are moving averages? At their core, moving averages are statistical calculations used to analyze data points by creating averages of different subsets of the complete data set. In the context of cryptocurrency trading, they help traders identify trends over specific periods by filtering out the noise from random price fluctuations. This is crucial because, let’s face it, the crypto market can be a rollercoaster ride of emotions and erratic price movements. By applying moving averages, traders can focus on the bigger picture and make more informed decisions.
When it comes to moving averages, there are a couple of main types that traders commonly use: the Simple Moving Average (SMA) and the Exponential Moving Average (EMA). Each type has its unique characteristics, making them suitable for different trading strategies. Understanding these differences is key to effectively applying them in your trading approach.
The Simple Moving Average is calculated by taking the average price of a cryptocurrency over a specific number of periods. For instance, if you wanted to calculate the 10-day SMA, you would add up the closing prices of the last 10 days and divide that sum by 10. While this method is straightforward and easy to understand, it does come with its own set of pros and cons.
One of the primary advantages of the SMA is its simplicity. It provides a clear view of the overall trend and is particularly effective in identifying long-term trends. Traders often use it to determine support and resistance levels. For example, if the price consistently bounces off the SMA, it may indicate a strong support level. Additionally, the SMA is easy to calculate and interpret, making it a go-to for many traders, especially beginners.
However, it’s not all sunshine and rainbows with the SMA. One of its significant limitations is its lagging nature. Since it averages out past prices, it can be slow to react to sudden price changes, especially in volatile markets like cryptocurrency. This lag can lead to missed opportunities or late entries and exits. Thus, while SMA is a valuable tool, relying solely on it can be risky.
On the other hand, the Exponential Moving Average gives more weight to recent prices, making it more responsive to new information. This characteristic is particularly beneficial in the fast-paced crypto market, where prices can change in the blink of an eye. The EMA is calculated using a more complex formula that factors in the most recent price changes, allowing traders to react more swiftly to market movements.
Now that we have a grasp on the different types of moving averages, let’s dive into how you can use them to develop effective trading strategies. Integrating moving averages into your trading plan can significantly enhance your decision-making process.
One of the most popular strategies involving moving averages is the crossover method. This occurs when a shorter-term moving average crosses above or below a longer-term moving average. For example, if the 50-day EMA crosses above the 200-day EMA, it generates a bullish signal, suggesting that it might be a good time to buy. Conversely, if the 50-day EMA crosses below the 200-day EMA, it can signal a potential sell opportunity. These crossovers serve as significant trading signals and can help you capitalize on market trends.
To maximize your trading success, consider combining moving averages with other technical indicators. For example, using the Relative Strength Index (RSI) alongside moving averages can provide deeper insights into market conditions. When the RSI indicates that an asset is overbought or oversold, and this aligns with moving average signals, it can strengthen your trading decisions. The synergy between these tools can lead to a more robust trading strategy.
- What is the best moving average to use for crypto trading? While there’s no one-size-fits-all answer, many traders find that the 50-day and 200-day moving averages are effective for identifying trends.
- How can I avoid false signals with moving averages? To minimize false signals, consider using moving averages in conjunction with other indicators, such as volume or momentum indicators.
- Can moving averages predict market crashes? Moving averages are not foolproof and cannot predict crashes, but they can help identify trends that may precede significant market movements.

Understanding Moving Averages
Moving averages are essential tools in the world of technical analysis, particularly when it comes to predicting trends in the volatile cryptocurrency market. But what exactly are they? In simple terms, a moving average smooths out price data by creating a constantly updated average price over a specified time frame. This process helps traders identify trends more clearly and make informed decisions. Imagine trying to read a map in a storm; moving averages act like a clear window, allowing you to see the path ahead without the distractions of fluctuating prices.
The purpose of moving averages is twofold. Firstly, they help in identifying the direction of the trend—whether the market is moving upwards, downwards, or sideways. Secondly, they serve as dynamic support and resistance levels. When prices are above a moving average, it often indicates an upward trend, while prices below the average suggest a downward trend. This dual function is why moving averages are considered a staple in any trader's toolkit.
Understanding the importance of moving averages in crypto trading is crucial for anyone looking to navigate this unpredictable market. They provide a clear visual representation of price movements, which can be particularly beneficial for beginners. By relying on moving averages, traders can filter out the noise caused by short-term price fluctuations and focus on the bigger picture. This can lead to more strategic trading decisions and ultimately, a better chance of success.
Moreover, moving averages can be customized according to individual trading styles. For instance, a day trader might prefer shorter moving averages to capture quick price changes, while a long-term investor might opt for longer averages to identify sustained trends. This flexibility makes moving averages a versatile tool that can be adapted to various trading strategies.
In summary, moving averages are not just numbers on a chart; they are powerful indicators that can help traders make sense of the chaotic world of cryptocurrency. By smoothing out price data and highlighting trends, moving averages empower traders to make more informed decisions and enhance their overall trading strategies.
Types of Moving Averages
When diving into the world of cryptocurrency trading, understanding the different types of moving averages is crucial for making informed decisions. Moving averages are not just simple calculations; they are powerful tools that help traders smooth out price data and identify trends over time. Among the various types, the two most commonly used are the Simple Moving Average (SMA) and the Exponential Moving Average (EMA). Each of these moving averages has its own unique characteristics and applications in the crypto market.
The Simple Moving Average (SMA) is essentially the arithmetic mean of a selected price over a specific number of periods. For example, if you wanted to calculate a 10-day SMA, you would take the closing prices of the last 10 days, add them up, and then divide by 10. This method is straightforward and easy to understand, making it a popular choice for traders. However, it’s important to note that while SMA provides a clear picture of the overall trend, it can lag behind the current market conditions due to its reliance on historical data.
On the other hand, the Exponential Moving Average (EMA) gives more weight to recent prices, making it more responsive to new information. This is particularly useful in the fast-paced world of cryptocurrency, where prices can change dramatically in a short period. The calculation of EMA is a bit more complex than SMA, as it involves a smoothing factor that prioritizes the most recent price data. This characteristic allows traders to react more swiftly to market changes, potentially leading to better trading decisions.
Both SMA and EMA have their respective advantages and disadvantages. For instance, while SMA is great for identifying long-term trends, it may not react quickly enough during periods of high volatility. Conversely, EMA’s responsiveness can lead to false signals in a choppy market. Therefore, it’s essential for traders to understand the context in which they are using these moving averages.
In summary, the choice between SMA and EMA often comes down to individual trading strategies and market conditions. Some traders prefer to use both in conjunction to gain a more comprehensive view of market trends. By combining these moving averages, traders can potentially identify more reliable signals for entering or exiting trades. As you venture deeper into the world of crypto trading, mastering these moving averages will undoubtedly enhance your analytical skills and decision-making process.

Simple Moving Average (SMA)
The is one of the most fundamental tools in the world of technical analysis, especially when it comes to cryptocurrency trading. At its core, the SMA calculates the average price of a cryptocurrency over a specified number of periods, which can range from days to months. This straightforward approach allows traders to smooth out price fluctuations and gain a clearer picture of the overall trend. Imagine trying to navigate through a dense fog; the SMA acts like a lighthouse, guiding traders through the murky waters of price volatility.
To calculate the SMA, you simply add up the closing prices of a cryptocurrency over a defined period and then divide that sum by the number of periods. For example, if you were calculating a 5-day SMA, you would add the closing prices of the last five days and divide by five. This method effectively provides a single value that represents the average price over that time frame, which can help traders identify whether the market is trending upwards or downwards.
| Period | Closing Prices | SMA Calculation |
|---|---|---|
| 1 | $100 | ($100 + $105 + $110 + $95 + $90) / 5 $100 |
| 2 | $105 | |
| 3 | $110 | |
| 4 | $95 | |
| 5 | $90 |
One of the main advantages of using the SMA is its ability to highlight long-term trends. This can be particularly beneficial for traders looking to make strategic decisions based on broader market movements rather than short-term price fluctuations. However, like any tool, the SMA is not without its drawbacks. While it provides a clear view of the trend, it can lag behind current prices, especially in fast-moving markets like cryptocurrency. This lag can sometimes lead to missed opportunities or delayed reactions to market changes.
Furthermore, the SMA can be influenced by extreme price movements, which may distort the average and lead to misleading signals. For instance, if a cryptocurrency experiences a sudden spike or drop, the SMA may take several periods to adjust, potentially causing traders to react too late. Therefore, while the SMA is a powerful tool, it is crucial to use it in conjunction with other indicators to form a comprehensive trading strategy.
In summary, the Simple Moving Average is a vital component of technical analysis that provides traders with a simplified view of price trends. By understanding its calculation, advantages, and limitations, traders can better navigate the complex world of cryptocurrency trading. As with any strategy, the key lies in combining the SMA with other analytical tools to enhance decision-making and improve trading outcomes.

Advantages of SMA
The Simple Moving Average (SMA) is a widely utilized tool in the realm of cryptocurrency trading, and its advantages are numerous. One of the most significant benefits of SMA lies in its simplicity. By calculating the average price over a specified number of periods, traders can easily grasp the overall direction of a cryptocurrency's price movement. This straightforward approach makes it accessible for both novice and experienced traders who may not have a deep technical background.
Another key advantage of SMA is its effectiveness in identifying long-term trends. Unlike more complex indicators, SMA provides a clear visual representation of price movements, allowing traders to discern whether a cryptocurrency is in an uptrend or downtrend. When the SMA line is sloping upwards, it indicates a bullish market sentiment, while a downward slope suggests bearish conditions. This clarity is invaluable for traders looking to make informed decisions based on market trends.
Additionally, the SMA is less susceptible to market noise. In the volatile world of cryptocurrencies, prices can fluctuate wildly within short time frames. The SMA smooths out these fluctuations, providing a more stable view of price movements over time. This characteristic can help traders avoid making impulsive decisions based on temporary price spikes or drops, leading to more strategic trading actions.
Moreover, the SMA is often used in conjunction with other technical indicators, enhancing its effectiveness. For instance, when combined with momentum indicators, traders can gain deeper insights into market conditions. This integration allows for more comprehensive analysis, ultimately improving trading strategies. For example, if the SMA aligns with a momentum indicator suggesting strong buying pressure, it could signal an optimal entry point for a trade.
In summary, the advantages of using SMA in cryptocurrency trading include:
- Simplicity: Easy to understand and implement, making it suitable for all traders.
- Long-term trend identification: Helps in recognizing the overall market direction.
- Reduced market noise: Offers a clearer picture of price movements by smoothing out fluctuations.
- Compatibility with other indicators: Enhances analysis when used alongside other technical tools.
By leveraging these advantages, traders can make more informed decisions, potentially increasing their chances of success in the ever-evolving cryptocurrency market.

Limitations of SMA
While the Simple Moving Average (SMA) is a popular tool among traders, it isn't without its drawbacks, especially in the highly volatile world of cryptocurrency. One of the primary limitations of SMA is its tendency to lag behind current price movements. This lag occurs because the SMA calculates the average price over a specified period, which means it can take time for the average to respond to sudden price changes. For instance, if a cryptocurrency experiences a sharp spike or drop, the SMA will only reflect that change after several periods have passed, potentially leading traders to make decisions based on outdated information.
Another significant limitation is that the SMA can produce false signals in a choppy or sideways market. In such conditions, the average may fluctuate frequently, which can mislead traders into thinking there is a trend when, in fact, the market is simply oscillating without a clear direction. This situation can result in unnecessary trades, increasing transaction costs and risking capital without a solid basis for the decision.
Additionally, the SMA does not account for the volatility inherent in cryptocurrencies. Unlike traditional assets that may have more stable price movements, cryptocurrencies can experience rapid price swings. As a result, relying solely on the SMA may cause traders to overlook critical market signals that could indicate more significant potential shifts. For example, a trader might miss out on an opportunity to capitalize on a bullish trend if they are waiting for the SMA to confirm the movement.
Moreover, the choice of the period for the SMA can significantly impact its effectiveness. A shorter time frame might react quickly to price changes but can also produce more noise, while a longer time frame smooths out fluctuations but may delay signals. Finding the right balance is crucial, yet it can be challenging, especially for novice traders. Here’s a brief overview of how different periods can affect SMA performance:
| Time Frame | Characteristics | Implications for Trading |
|---|---|---|
| Short-Term (e.g., 5-10 days) | Responsive to price changes but may generate false signals | Good for quick trades but risky in volatile markets |
| Medium-Term (e.g., 20-50 days) | Balances responsiveness and stability | Suitable for swing trading |
| Long-Term (e.g., 100+ days) | Smooths out noise but lags significantly | Useful for identifying long-term trends but may miss short-term opportunities |
In summary, while the SMA can be a valuable tool for identifying trends, traders should be aware of its limitations. Relying solely on SMA can lead to missed opportunities and potential losses, especially in the dynamic crypto market. It’s essential to combine SMA with other indicators and analysis methods to create a more robust trading strategy.
- What is the best time frame for using SMA in crypto trading? The best time frame depends on your trading strategy. Short-term traders might prefer a 5-10 day SMA, while long-term traders may opt for 100 days or more.
- Can SMA be used for all cryptocurrencies? Yes, SMA can be applied to any cryptocurrency, but its effectiveness may vary based on the asset's volatility and trading volume.
- How can I improve my trading strategy using SMA? Combine SMA with other indicators, such as RSI or MACD, to enhance your signals and reduce the likelihood of false positives.

Exponential Moving Average (EMA)
The is a powerful tool in the arsenal of crypto traders, offering a more nuanced view of price trends compared to its simpler counterpart, the Simple Moving Average (SMA). While the SMA calculates the average price over a specified number of periods, the EMA places greater emphasis on the most recent prices, making it exceptionally responsive to new information. This characteristic is particularly beneficial in the fast-paced world of cryptocurrency trading, where market conditions can change in the blink of an eye.
To understand the significance of the EMA, consider this: imagine you're trying to predict the weather. If you only look at the average temperature over the last month, you might miss sudden changes due to a heatwave or cold front. The EMA, however, acts like a weather app that updates every hour, giving you a clearer, more immediate picture of the current conditions. This is crucial in crypto trading, where timing can be everything.
Calculating the EMA involves a bit more math than the SMA. The formula for the EMA is as follows:
EMA  (Current Price x K) + (Previous EMA x (1 - K))
K  2 / (N + 1)
In this formula, N represents the number of periods you want to consider, and K is the smoothing factor. The EMA reacts more quickly to price fluctuations, allowing traders to spot trends sooner. This can be incredibly advantageous when making decisions about buying or selling cryptocurrencies.
One of the standout features of the EMA is its ability to help traders identify potential reversals in the market. For instance, when the price of a cryptocurrency crosses above the EMA line, it can signal a bullish trend, prompting traders to consider entering a position. Conversely, if the price dips below the EMA, it may indicate a bearish trend, suggesting it’s time to sell or short the asset.
However, it’s important to note that while the EMA is a fantastic tool, it’s not foolproof. Like any indicator, it has its limitations. In highly volatile markets, the EMA can sometimes produce false signals, leading traders to make hasty decisions. Therefore, it’s essential to use the EMA in conjunction with other indicators and analysis techniques for a more comprehensive view of the market.
In summary, the Exponential Moving Average is a vital component of technical analysis in the crypto space. Its ability to prioritize recent price data makes it an invaluable resource for traders looking to navigate the ever-changing landscape of cryptocurrency markets. By incorporating the EMA into your trading strategy, you can enhance your decision-making process and potentially increase your trading success.

Using Moving Averages for Trading Strategies
When it comes to navigating the unpredictable waters of the cryptocurrency market, traders are always on the lookout for tools that can help them make informed decisions. One of the most effective tools at their disposal is the moving average. Not only do moving averages help smooth out price fluctuations, but they also provide critical insights into potential future price movements. By incorporating moving averages into your trading strategies, you can enhance your ability to predict market trends and make better trading decisions.
So, how exactly can you use moving averages for trading strategies? First and foremost, understanding the concept of crossovers is essential. A moving average crossover occurs when a shorter-term moving average crosses above or below a longer-term moving average. This event can serve as a powerful signal for traders. For example, when the Short-Term Moving Average (STMA) crosses above the Long-Term Moving Average (LTMA), it can signal a potential buying opportunity. Conversely, if the STMA crosses below the LTMA, it may indicate a selling opportunity. These crossover points can act as pivotal moments in your trading strategy, helping you decide when to enter or exit a position.
Moreover, combining moving averages with other technical indicators can significantly enhance your trading strategy. For instance, consider integrating the Relative Strength Index (RSI) with moving averages. The RSI can provide insights into whether a cryptocurrency is overbought or oversold, while moving averages help identify the overall trend. By using these two indicators together, you can make more informed decisions. For example, if the RSI indicates that a cryptocurrency is oversold and the moving average crossover suggests a bullish trend, this could be a strong signal to buy.
Another effective strategy is to use multiple moving averages. By employing both short-term and long-term moving averages, traders can gain a clearer picture of market trends. For instance, using a 50-day moving average in conjunction with a 200-day moving average can help identify long-term trends while still allowing for short-term trading opportunities. This dual approach enables traders to capitalize on both immediate market movements and broader trends.
To illustrate the effectiveness of moving averages in trading strategies, consider the following table that outlines potential signals generated by moving average crossovers:
| Signal Type | Description | Action |
|---|---|---|
| Golden Cross | Short-term moving average crosses above long-term moving average | Buy |
| Death Cross | Short-term moving average crosses below long-term moving average | Sell |
| Support Level | Price bounces off moving average | Buy |
| Resistance Level | Price hits moving average and reverses | Sell |
In summary, using moving averages in your trading strategies can provide a significant edge in the highly volatile crypto market. By understanding crossovers, combining moving averages with other indicators, and employing multiple moving averages, you can develop a robust trading strategy that adapts to changing market conditions. Remember, the key to successful trading lies in continuous learning and adapting your strategies based on market behavior.
Q: What is the best moving average to use for trading?
A: The best moving average depends on your trading style. Short-term traders often prefer the 10 or 20-day moving averages, while long-term traders may opt for the 50 or 200-day moving averages.
Q: Can moving averages predict price movements?
A: While moving averages can indicate trends and potential reversals, they are not foolproof. They should be used in conjunction with other indicators for more accurate predictions.
Q: How often should I adjust my moving averages?
A: It’s essential to regularly review your moving averages to ensure they align with current market conditions. Adjusting them based on your trading strategy and timeframe is advisable.
Crossovers and Signals
When it comes to trading in the volatile world of cryptocurrencies, understanding crossovers can be a game-changer. Crossovers occur when two moving averages intersect, providing traders with critical signals that can indicate potential market shifts. Imagine you’re driving a car: the moment you see a traffic light change from green to red, you know it’s time to stop. Similarly, moving average crossovers can signal when to enter or exit a trade.
There are two primary types of crossovers that traders often watch closely: the bullish crossover and the bearsih crossover. A bullish crossover happens when a shorter-term moving average crosses above a longer-term moving average. This is generally seen as a strong buy signal, suggesting that upward momentum is gaining strength. Conversely, a bearish crossover occurs when the shorter-term moving average dips below the longer-term moving average. This is typically interpreted as a sell signal, indicating that the market might be turning down.
To illustrate, let’s break down a hypothetical example using a 50-day SMA and a 200-day SMA. When the 50-day SMA crosses above the 200-day SMA, traders might interpret this as an opportunity to buy, expecting a bullish trend to follow. On the flip side, if the 50-day SMA crosses below the 200-day SMA, this could trigger a sell-off as traders react to the potential for a downturn.
| Type of Crossover | Signal | Potential Action |
|---|---|---|
| Bullish Crossover | Shorter-term MA crosses above longer-term MA | Buy |
| Bearish Crossover | Shorter-term MA crosses below longer-term MA | Sell |
However, it’s essential to remember that no indicator is foolproof. Crossovers can produce false signals, especially in choppy or sideways markets. Just like a weather forecast, while it can give you a good idea of what to expect, it’s not always accurate. Therefore, it’s wise to use crossovers in conjunction with other indicators to confirm signals. For instance, combining moving averages with Relative Strength Index (RSI) or MACD can provide a more comprehensive view of market conditions.
Ultimately, mastering the art of interpreting moving average crossovers can enhance your trading strategy significantly. By recognizing these signals and understanding their implications, you can navigate the crypto market with greater confidence. So, the next time you analyze price charts, pay attention to those moving averages—they might just guide you to your next big trading opportunity!
Combining Moving Averages with Other Indicators
When it comes to trading cryptocurrencies, relying solely on moving averages can sometimes lead to incomplete analyses. That's where the magic of combining moving averages with other technical indicators comes into play! By integrating various tools, traders can create a more robust trading strategy that enhances decision-making and minimizes risks. Imagine moving averages as the backbone of your trading plan, while other indicators add the muscle and agility needed to navigate the volatile crypto landscape.
One of the most effective ways to combine moving averages is with momentum indicators like the Relative Strength Index (RSI) or the Moving Average Convergence Divergence (MACD). These indicators can provide insights into whether a cryptocurrency is overbought or oversold, adding an extra layer of confirmation to your moving average signals. For instance, if a cryptocurrency's price is above its moving average and the RSI is showing that it's overbought, it might be a good time to consider selling. Conversely, if the price is below the moving average and the RSI indicates oversold conditions, it could be a prime buying opportunity.
Another popular strategy involves using multiple moving averages to identify trends more effectively. For example, traders often use a combination of a short-term moving average (like the 10-day SMA) and a long-term moving average (like the 50-day SMA). This approach can reveal crossovers, which are powerful signals. When the short-term average crosses above the long-term average, it can indicate a bullish trend, while the opposite crossover can signal a bearish trend. These crossovers, when combined with volume indicators, can provide even greater insight into the strength of a trend.
Let’s not forget about volume indicators! High trading volume can confirm that a price movement is legitimate. When a moving average crossover occurs alongside a spike in volume, it’s like a green light for traders, indicating that the trend is likely to continue. On the flip side, if a crossover happens with low volume, it might be a sign to proceed with caution.
To illustrate how these combinations work, consider the following table:
| Indicator Combination | Signal Type | Action |
|---|---|---|
| 10-day SMA crosses above 50-day SMA + RSI < 30 | Buy Signal | Consider entering a long position |
| 10-day SMA crosses below 50-day SMA + RSI > 70 | Sell Signal | Consider exiting or shorting |
| MACD line crosses above signal line + Volume spike | Strong Buy Signal | Enter a long position |
| MACD line crosses below signal line + Low Volume | Weak Signal | Proceed with caution |
In summary, combining moving averages with other indicators not only enhances your analysis but also increases your chances of making profitable trades. It’s like having a toolkit where each tool has its unique purpose, but together, they create a powerful strategy that can adapt to the ever-changing crypto market. So, don’t just rely on one tool; mix and match to find the perfect combination that works for you!
- What are moving averages? Moving averages are statistical calculations used to analyze data points by creating averages over a specified number of periods, helping to identify trends in price movements.
- How can I use moving averages in my trading strategy? You can use moving averages to identify trends, generate buy and sell signals through crossovers, and confirm price movements with other technical indicators.
- What is the difference between SMA and EMA? The Simple Moving Average (SMA) gives equal weight to all prices in the period, while the Exponential Moving Average (EMA) gives more weight to recent prices, making it more responsive to new information.
- Can I rely solely on moving averages for trading? While moving averages are useful, it’s best to combine them with other indicators for a more comprehensive analysis and to reduce the risk of false signals.
Frequently Asked Questions
- What are moving averages in cryptocurrency trading?
Moving averages are statistical calculations used to analyze price data by creating a constantly updated average price. They help traders identify trends and potential reversal points in the crypto market, making them essential for informed decision-making.
- What is the difference between Simple Moving Average (SMA) and Exponential Moving Average (EMA)?
The main difference lies in how they calculate the average. SMA gives equal weight to all prices over a specified period, while EMA gives more weight to recent prices, making it more sensitive to new information. This responsiveness can be crucial in the fast-paced world of cryptocurrency trading.
- How can I use moving averages to predict market trends?
Traders use moving averages to smooth out price fluctuations and identify underlying trends. By observing how the price interacts with the moving averages, traders can make predictions about potential future movements, especially when looking for crossovers or changes in direction.
- What are moving average crossovers and why are they important?
Moving average crossovers occur when a short-term moving average crosses above or below a long-term moving average. This event can signal a potential trend change, making it a key indicator for traders to consider entering or exiting positions in the market.
- Can moving averages be used with other indicators?
Absolutely! Combining moving averages with other technical indicators, like the Relative Strength Index (RSI) or MACD, can enhance your trading strategy. This multi-faceted approach allows for more robust analysis and better decision-making in the volatile crypto market.
- What are the limitations of using moving averages?
While moving averages are powerful tools, they do have limitations. They can lag behind the price action, especially in volatile markets, which may lead to delayed signals. Additionally, relying solely on moving averages without considering other factors can result in missed opportunities or losses.
- How often should I adjust my moving average settings?
The frequency of adjustments depends on your trading strategy. Short-term traders might prefer quicker moving averages (like a 5 or 10-day), while long-term investors might opt for slower ones (like a 50 or 200-day). It’s essential to find a balance that aligns with your trading goals.
- Is it possible to use moving averages for day trading?
Yes, moving averages can be effectively used in day trading. Many day traders rely on short-term moving averages to identify quick entry and exit points. However, it's crucial to combine them with other indicators and market analysis to ensure successful trades.

