Understanding Candlestick Patterns in Crypto Trading
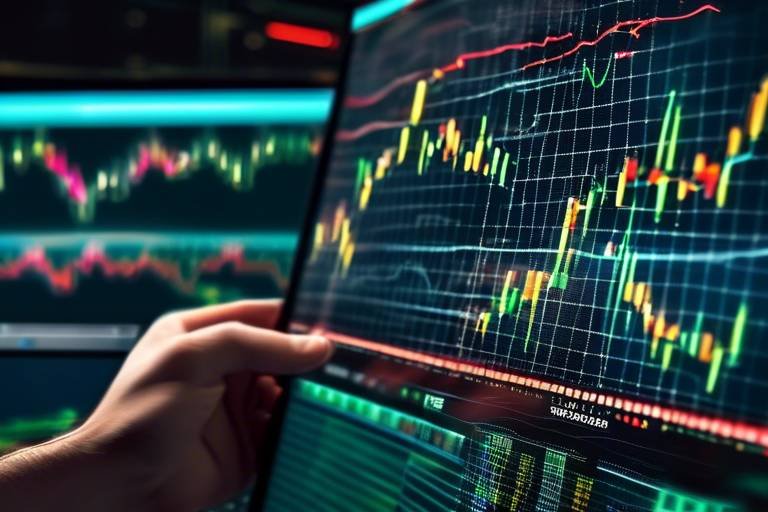
In the fast-paced world of cryptocurrency trading, understanding the significance of candlestick patterns is crucial. These patterns serve as visual cues that can help traders decipher the often chaotic price movements of various cryptocurrencies. Whether you're a seasoned trader or just starting out, grasping these patterns can provide invaluable insights into market sentiment and potential price reversals. Imagine you're trying to read a map in a foreign land; candlestick patterns are like the signs that guide you to your destination. They tell you where the market has been and hint at where it might be headed next.
Candlestick patterns are visual representations of price movements over a specific time frame. Each candlestick provides a snapshot of the market's behavior during that period, encapsulating the opening price, closing price, and the highest and lowest prices reached. Think of candlestick patterns as the heartbeat of the market; they pulse with the emotions of traders—fear, greed, and anticipation. By learning to interpret these patterns, traders can gain a deeper understanding of market dynamics, allowing them to make more informed trading decisions.
Understanding candlestick patterns is crucial for traders as they help identify market trends, potential entry and exit points, and the overall market sentiment. Imagine walking into a crowded room; the atmosphere can tell you a lot about how people are feeling. Similarly, candlestick patterns can reveal the mood of the market. Recognizing these patterns can enhance your trading strategies by providing a clearer picture of when to buy or sell. The ability to read these signals can mean the difference between a profitable trade and a costly mistake.
Each candlestick consists of a body and wicks, representing the opening and closing prices along with the high and low prices. Recognizing these components is essential for interpreting patterns accurately. The body of the candlestick reflects the price range between the opening and closing prices, while the wicks indicate the price extremes during the time frame. Understanding these elements is akin to knowing the ingredients of a recipe; without them, you can't create a successful dish.
The body indicates the price range between the opening and closing prices. A filled body suggests a bearish trend, while an empty body indicates a bullish trend. This distinction is vital as it provides immediate clarity on the market's direction. When you see a filled body, it’s like a warning sign saying, "Hey, the sellers are in control!" On the other hand, an empty body is like a green light for buyers, signaling that the bulls are taking charge.
Wicks, or shadows, represent the price extremes during the time frame. They provide additional context to the candlestick, indicating volatility and potential reversals in market sentiment. Think of wicks as the emotional highs and lows of traders. A long wick might indicate that the market tried to push in one direction but ultimately failed, suggesting indecision. Traders can use this information to anticipate future movements and adjust their strategies accordingly.
Several well-known candlestick patterns, such as doji, hammer, and engulfing patterns, signal potential market movements. Recognizing these patterns can be advantageous for traders seeking profitable opportunities. For instance, a doji pattern might indicate market indecision, while a hammer suggests a potential reversal. These patterns act as signals, much like traffic lights guiding traders on when to proceed with caution or accelerate their trades.
Traders can leverage candlestick patterns to make informed decisions, combining them with other technical indicators to enhance their trading strategies and minimize risks. By integrating these patterns into your trading arsenal, you can develop a more nuanced understanding of market behavior. Just as a skilled chef combines flavors to create a delicious dish, successful traders blend candlestick patterns with other technical tools for optimal results.
Integrating candlestick patterns with other technical analysis tools, such as moving averages and RSI, can provide a more comprehensive view of market conditions and improve trading outcomes. This combination allows traders to confirm signals and reduce the chances of false positives. Just like a detective gathers multiple pieces of evidence to solve a case, traders should use various indicators to validate their trading decisions.
Implementing risk management strategies alongside candlestick analysis is essential for protecting investments and ensuring long-term trading success in the volatile crypto market. Setting stop-loss orders and defining risk-reward ratios can help traders navigate the unpredictable nature of cryptocurrency trading. Remember, even the most skilled traders can face losses; it’s how you manage those risks that will determine your success in the long run.
- What are the most common candlestick patterns?
Some of the most common patterns include the doji, hammer, engulfing, and shooting star. Each of these patterns can signal different market conditions.
- How can I improve my candlestick reading skills?
Practice is key! Use demo accounts to observe candlestick patterns in real-time and study their implications on price movements.
- Can candlestick patterns guarantee profits?
No trading strategy is foolproof. While candlestick patterns can provide valuable insights, they should be used in conjunction with other analysis techniques for best results.

What are Candlestick Patterns?
Candlestick patterns are powerful visual tools that provide traders with a glimpse into the market's emotional landscape. Think of them as a storyteller, narrating the price movements of a cryptocurrency over a specific time frame. Each candlestick encapsulates crucial information about the opening, closing, high, and low prices, enabling traders to interpret market sentiment effectively. By analyzing these patterns, traders can glean insights into potential price reversals or continuations, making them indispensable in the world of crypto trading.
At their core, candlestick patterns are formed by individual candlesticks that represent a specific period—be it seconds, minutes, hours, or days. Each candlestick is composed of a body and wicks (or shadows) that illustrate the price action during that time frame. The body shows the range between the opening and closing prices, while the wicks depict the highest and lowest prices reached. This duality provides a comprehensive picture of market dynamics, allowing traders to make informed decisions.
To better understand candlestick patterns, let’s break down their essential components:
- Body: The thick part of the candlestick that shows the price movement between open and close.
- Wicks: The thin lines extending from the body, indicating the highest and lowest prices during the period.
Recognizing these components is crucial for interpreting patterns accurately. For instance, a long body with little to no wick indicates strong market momentum, while a small body with long wicks suggests indecision among traders. This understanding can help traders gauge whether the market is leaning towards bullish or bearish sentiment.
In the ever-evolving world of cryptocurrency, where emotions run high and market conditions can change in an instant, candlestick patterns serve as a beacon of clarity. They allow traders to navigate the volatile waters of crypto trading with greater confidence. By mastering the art of reading these patterns, traders can enhance their strategies, identify potential entry and exit points, and ultimately improve their chances of success.

Importance of Candlestick Patterns in Trading
Understanding candlestick patterns is crucial for traders navigating the often turbulent waters of the cryptocurrency market. These patterns serve as a visual guide, helping traders to decipher the market's emotional landscape. By interpreting these patterns, traders can gain insights into potential price movements, ensuring they’re not just reacting to market changes, but proactively planning their next moves.
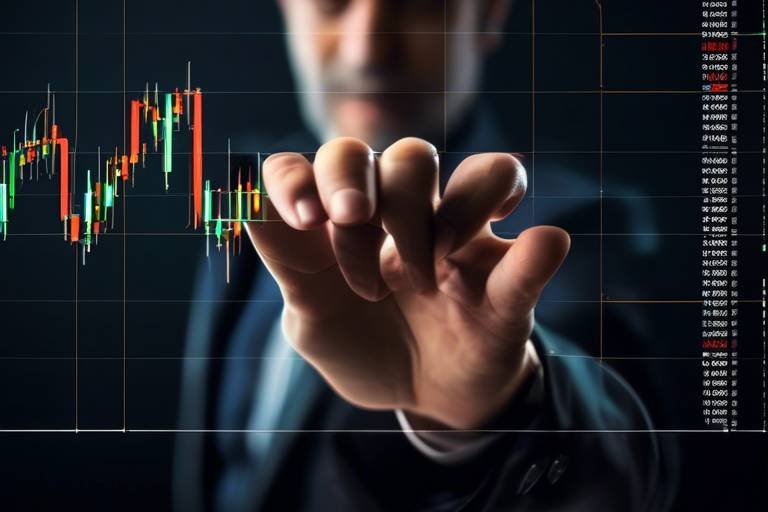
One of the primary reasons candlestick patterns are so important is their ability to highlight market trends. When traders can identify whether the market is in a bullish or bearish phase, they can make more informed decisions. For instance, recognizing a series of bullish candlesticks can indicate a strong upward trend, prompting traders to consider entering a position. Conversely, a succession of bearish candlesticks might signal a time to exit or short the market.
Additionally, candlestick patterns help traders pinpoint potential entry and exit points. Each candlestick tells a story, revealing the struggle between buyers and sellers. For example, a hammer pattern often appears at the bottom of a downtrend and can signal a potential reversal. This insight allows traders to set their buy orders just above the high of the hammer, maximizing their chances of capitalizing on the upcoming price increase.
Moreover, the psychological factors behind candlestick patterns cannot be overlooked. The market is driven by human emotions—fear, greed, and uncertainty. When traders see a doji candlestick, for instance, it indicates indecision in the market, which can lead to significant price movements in either direction. Understanding these psychological triggers can give traders an edge, allowing them to anticipate market reactions before they occur.
To further illustrate the significance of candlestick patterns, consider the following table that outlines some popular patterns and their implications:
| Pattern | Indication | Potential Action |
|---|---|---|
| Doji | Market indecision | Watch for potential reversal |
| Hammer | Potential bullish reversal | Consider buying |
| Engulfing | Strong reversal signal | Enter position in direction of engulfing candle |
In summary, the importance of candlestick patterns in trading cannot be overstated. They provide a visual representation of market sentiment, reveal potential trends, and highlight critical decision points for traders. By mastering these patterns, traders can enhance their strategies, increasing their chances of success in the fast-paced world of cryptocurrency trading.
As we delve deeper into the world of trading, it’s essential to remember that while candlestick patterns are powerful tools, they should be complemented with other analysis methods and sound risk management strategies. This holistic approach will not only improve your trading performance but also help you navigate the unpredictable nature of the crypto market with greater confidence.
- What are candlestick patterns?
Candlestick patterns are visual representations of price movements that help traders interpret market sentiment and potential price reversals. - Why are candlestick patterns important?
They help traders identify market trends, potential entry and exit points, and understand the psychological factors driving price movements. - Can candlestick patterns be used alone for trading?
While they are valuable, it’s best to combine them with other technical indicators and risk management strategies for optimal results.

Basic Candlestick Components
Candlestick patterns are fundamental to understanding market movements, and to truly grasp their significance, one must first delve into their basic components. Each candlestick is composed of two main parts: the body and the wicks. These elements not only provide critical information about price action but also help traders decode market sentiment and potential future movements.
The body of the candlestick represents the price range between the opening and closing prices over a specific time frame. When the closing price is higher than the opening price, the body is typically displayed as an empty or hollow shape, indicating a bullish sentiment. Conversely, if the closing price is lower than the opening price, the body appears filled or colored, signaling a bearish trend. This visual cue is essential for traders as it immediately communicates the market's direction.
Now, let's talk about the wicks or shadows. These are the thin lines extending from the top and bottom of the body, showcasing the highest and lowest prices traded during the time frame. The wicks can tell a story of their own; for instance, a long wick at the top of a candlestick suggests that buyers pushed the price up but ultimately lost control, leading to a close lower than the high. This could indicate potential resistance levels. In contrast, a long wick at the bottom signifies that sellers tried to push the price down but were overpowered by buyers, hinting at possible support levels. Understanding these nuances can significantly enhance a trader's ability to predict future price movements.
To summarize, the basic components of a candlestick can be outlined as follows:
| Component | Description |
|---|---|
| Body | Indicates the range between opening and closing prices; filled body signifies bearishness, while an empty body indicates bullishness. |
| Wicks/Shadows | Represent the highest and lowest prices during the time frame; long wicks can indicate potential reversals or support/resistance levels. |
In conclusion, recognizing and understanding these basic components of candlesticks is crucial for traders looking to interpret market sentiment accurately. By analyzing the body and wicks, traders can gain insights into price trends and potential reversals, ultimately enhancing their trading strategies.
- What is a candlestick pattern? A candlestick pattern is a visual representation of price movements in a specific time frame, used to analyze market sentiment.
- Why are candlestick patterns important in trading? They help identify market trends, potential entry and exit points, and overall market sentiment, enhancing trading strategies.
- What do the body and wicks of a candlestick represent? The body represents the price range between opening and closing prices, while the wicks show the highest and lowest prices during that time frame.

Body of the Candlestick
The is arguably the most critical component when analyzing price movements in the cryptocurrency market. It represents the range between the opening and closing prices over a specific time period, giving traders a clear visual cue about market sentiment during that timeframe. When you see a filled body, it typically indicates a bearish trend, meaning that the closing price is lower than the opening price. Conversely, an empty body suggests a bullish trend, where the closing price is higher than the opening price. This simple yet powerful visual distinction can help traders quickly assess whether the market is leaning towards buying or selling.
Understanding the body’s color can also provide insights into market psychology. For instance, a long filled body reflects strong selling pressure, while a long empty body indicates robust buying pressure. This leads us to consider the concept of market momentum. Momentum can be thought of as the force that drives prices in a particular direction, and the body of the candlestick serves as a key indicator of that force. The longer the body, the more significant the momentum, which can signal potential continuation of the trend.
Additionally, the size of the body can convey important information about volatility. A small body suggests that price movements were relatively calm during that period, while a larger body indicates greater volatility and price fluctuations. This is crucial for traders who need to gauge the risk associated with their positions. For example, if a trader sees a series of large-bodied candlesticks, it might prompt them to consider tightening their stop-loss orders or reevaluating their entry points.
In summary, the body of the candlestick is not just a simple representation of price; it encapsulates the emotions and actions of traders within that timeframe. By paying close attention to the body’s color, size, and context within the overall market trend, traders can gain valuable insights that enhance their trading strategies. Remember, the body is where the real story lies in each candlestick, and understanding it can be the key to unlocking profitable trading opportunities.
- What does a filled candlestick body indicate? A filled body typically indicates a bearish trend, where the closing price is lower than the opening price.
- What does an empty candlestick body signify? An empty body suggests a bullish trend, where the closing price is higher than the opening price.
- How can I use candlestick bodies to assess market volatility? The size of the body can indicate volatility; larger bodies suggest greater price fluctuations, while smaller bodies indicate calmer market conditions.
- Why is understanding the body of the candlestick important? The body provides insights into market sentiment, momentum, and volatility, which can help traders make informed decisions.

Wicks and Shadows
The wicks, also known as shadows, of a candlestick are crucial elements that provide deeper insights into the market's behavior during a specific time frame. Imagine a candle burning brightly; the body represents the core of the flame, while the wicks illustrate the flickering movements that occur around it. These shadows indicate the highest and lowest prices reached within that period, acting as a barometer for market volatility. When traders analyze these wicks, they can gauge the strength or weakness of a price movement, which is essential for making informed trading decisions.
For instance, a long upper wick suggests that buyers pushed the price up significantly, but sellers stepped in and drove it back down before the close. This could indicate a potential reversal or a weakening bullish trend. Conversely, a long lower wick shows that sellers pushed the price down, but buyers entered the market and pushed the price back up, hinting at possible bullish momentum. Understanding these dynamics can enhance a trader's ability to predict future price movements.
To further illustrate the significance of wicks and shadows, consider the following key points:
- Market Sentiment: Long wicks often reflect indecision among traders, while short wicks indicate a stronger consensus on price direction.
- Volatility Indicator: The length of the wicks can signal market volatility; longer wicks suggest higher volatility, while shorter wicks indicate more stable price action.
- Potential Reversals: Patterns formed by wicks can be powerful indicators of potential market reversals, especially when combined with other technical analysis tools.
In summary, the wicks and shadows of candlesticks are not just decorative features; they are vital components that reveal the underlying market psychology. By paying close attention to these elements, traders can gain a clearer understanding of market dynamics, making them better equipped to navigate the often turbulent waters of cryptocurrency trading.

Popular Candlestick Patterns
Candlestick patterns are like the secret language of the market, whispering hints about potential price movements. Among the myriad of patterns, a few stand out as particularly powerful signals for traders. Understanding these patterns can feel like having a cheat sheet in a game where the stakes are high. Let’s dive into some of the most recognized candlestick patterns that every trader should have in their arsenal.
One of the most famous patterns is the Doji. This pattern occurs when the opening and closing prices are virtually identical, creating a candlestick that looks like a cross. It signifies indecision in the market, suggesting that buyers and sellers are in a tug-of-war. When spotted after a strong trend, a Doji can indicate a potential reversal. It’s as if the market is saying, “Hey, something’s about to change!”
Another essential pattern is the Hammer. This pattern has a small body at the top and a long lower wick, resembling a hammer. It typically forms after a downtrend and signals that buyers are starting to step in. The long wick shows that sellers tried to push the price down, but buyers fought back, pushing the price back up. It’s like seeing a boxer get knocked down but then rise to their feet, ready to fight back!
On the flip side, we have the Inverted Hammer, which has a small body at the bottom and a long upper wick. This pattern appears after a downtrend and suggests that buyers are gaining strength, but it’s essential to confirm it with the following candlestick. Think of it as a flicker of light in a dark room; it indicates hope, but you need to see if it leads to a full-blown illumination.
Then there’s the Engulfing Pattern, which comes in two varieties: bullish and bearish. A bullish engulfing pattern occurs when a small bearish candle is followed by a larger bullish candle that completely engulfs it. This is a strong signal that buyers are taking control. Conversely, a bearish engulfing pattern is when a small bullish candle is followed by a larger bearish candle, indicating that sellers are overpowering the buyers. It’s like a wave crashing over a sandcastle, sweeping away all in its path.
In addition to these, patterns like the Morning Star and Evening Star are also noteworthy. The Morning Star is a three-candle pattern that signals a potential bullish reversal after a downtrend, while the Evening Star indicates a bearish reversal after an uptrend. These patterns can be likened to the sun rising and setting, marking the transitions of market sentiment.
Understanding these patterns is crucial for traders looking to make informed decisions. They serve as vital indicators of market psychology, helping traders anticipate potential price movements. By mastering these popular candlestick patterns, you can enhance your trading strategies and navigate the volatile waters of cryptocurrency trading with greater confidence.
- What is a candlestick pattern?
A candlestick pattern is a visual representation of price movements in a specific time frame, indicating potential market trends and reversals. - How can I use candlestick patterns in trading?
Traders use candlestick patterns to identify market sentiment, potential entry and exit points, and to enhance their overall trading strategies. - Are candlestick patterns reliable?
While candlestick patterns can provide valuable insights, they should be used in conjunction with other technical analysis tools for better accuracy.

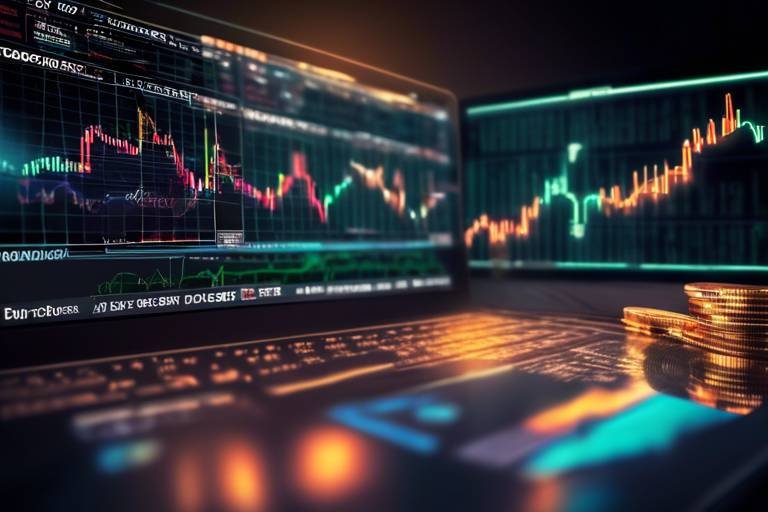
Using Candlestick Patterns in Crypto Trading
In the ever-evolving world of cryptocurrency trading, candlestick patterns serve as a powerful tool for traders looking to navigate the unpredictable waters of the market. These patterns not only illuminate the past price movements but also offer a glimpse into potential future trends. By effectively interpreting these signals, traders can make more informed decisions, increasing their chances of success.
When utilizing candlestick patterns, it's essential to remember that they should not be viewed in isolation. Instead, they should be combined with other technical indicators to create a more robust trading strategy. For instance, integrating candlestick analysis with tools like moving averages or the Relative Strength Index (RSI) can provide a comprehensive view of market conditions. This synergy allows traders to confirm signals and reduce the likelihood of false positives, which is crucial in the volatile crypto market.
Imagine you're a sailor navigating through a stormy sea. The candlestick patterns act as your compass, guiding you through turbulent waters, while technical indicators serve as your map, providing a broader context of the terrain ahead. Together, they enhance your ability to make wise trading decisions, helping you to avoid treacherous waves and capitalize on favorable winds.
Moreover, a crucial aspect of trading is risk management. While candlestick patterns can indicate potential price movements, they are not foolproof. Therefore, implementing risk management strategies alongside candlestick analysis is paramount. Here are some essential risk management techniques that traders can employ:
- Setting Stop-Loss Orders: Protect your investments by automatically selling a cryptocurrency when it reaches a certain price.
- Diversifying Your Portfolio: Spread your investments across various cryptocurrencies to minimize risk.
- Position Sizing: Determine how much of your capital to risk on each trade based on your overall portfolio size.
By incorporating these strategies, traders can safeguard their investments and ensure long-term success in the unpredictable landscape of cryptocurrency trading. Remember, the goal is not just to chase profits but to protect your capital while maximizing potential gains.
In summary, using candlestick patterns in crypto trading is about more than just recognizing shapes on a chart. It's about understanding the psychological factors that drive market movements and leveraging this knowledge to make informed decisions. As you dive deeper into the world of trading, keep honing your skills in interpreting these patterns and integrating them with robust risk management strategies. With patience and practice, you'll find yourself becoming more adept at reading the market and seizing opportunities as they arise.
1. What are candlestick patterns?
Candlestick patterns are visual representations of price movements in the market, showing the open, close, high, and low prices over a specific time frame.
2. How can I use candlestick patterns in my trading strategy?
You can use candlestick patterns to identify potential market trends and reversals, combining them with other technical indicators for a more comprehensive analysis.
3. Are candlestick patterns reliable?
While candlestick patterns can provide valuable insights, they are not foolproof. It's crucial to use them in conjunction with other analysis methods and risk management strategies.
4. What are some popular candlestick patterns?
Some well-known candlestick patterns include the doji, hammer, engulfing patterns, and shooting star, each signaling different market sentiments.

Combining Patterns with Technical Analysis
When it comes to navigating the tumultuous waters of crypto trading, relying solely on candlestick patterns can feel like sailing a ship without a compass. That’s where the magic of **technical analysis** comes in! By integrating candlestick patterns with various technical indicators, traders can gain a more nuanced understanding of market dynamics and make more informed decisions.
Imagine you’re a detective piecing together clues. Each candlestick pattern offers a hint about what might happen next, but when you combine these clues with other tools, like moving averages or the Relative Strength Index (RSI), you create a clearer picture of the market's behavior. For instance, if you spot a bullish engulfing pattern but also notice that the RSI is nearing overbought territory, it might be wise to approach the situation with caution. This synergy between candlestick patterns and technical indicators can significantly enhance your trading strategy.
Technical indicators serve as the supplementary tools that help validate the signals generated by candlestick patterns. Here are a few key indicators that work well in tandem with candlestick analysis:
- Moving Averages: These smooth out price data to identify trends over a specific period. When a short-term moving average crosses above a long-term moving average, it can signal a bullish trend, reinforcing a bullish candlestick pattern.
- Relative Strength Index (RSI): This momentum oscillator measures the speed and change of price movements. An RSI above 70 indicates overbought conditions, while below 30 suggests oversold conditions. This context can help you assess the validity of a candlestick pattern.
- Volume Analysis: Volume is a critical factor in confirming the strength of a candlestick pattern. A pattern accompanied by high trading volume is typically more reliable than one with low volume.
By melding these indicators with candlestick patterns, traders can achieve a more robust trading strategy. For example, if you identify a doji candlestick at a resistance level, and simultaneously see that the volume is decreasing, it may suggest that a reversal is imminent. This combination of insights can empower you to make more strategic entries and exits.
Moreover, it’s crucial to remain adaptable. The crypto market is notoriously volatile, and what works today may not work tomorrow. Regularly revisiting and refining your approach based on current market conditions can lead to better outcomes. Just like a skilled chef adjusts their recipe based on the ingredients available, a successful trader adapts their strategies to the ever-changing market landscape.
In conclusion, combining candlestick patterns with technical analysis is not just a good idea; it’s essential for anyone serious about trading in the crypto space. This powerful combination allows traders to see beyond the surface of price movements, uncovering deeper insights that can lead to more profitable trades. So, the next time you analyze a candlestick, remember to look around—there's a whole world of technical indicators waiting to help you make sense of the market!
Q1: What are candlestick patterns?
Candlestick patterns are visual representations of price movements in a specific time frame, helping traders interpret market sentiment and potential price movements.
Q2: How do I use candlestick patterns in trading?
To use candlestick patterns effectively, identify recognizable patterns and combine them with technical indicators to confirm trends and potential reversals.
Q3: What technical indicators should I use with candlestick patterns?
Common indicators include moving averages, RSI, and volume analysis, all of which can provide additional context and validation to candlestick signals.
Q4: Can candlestick patterns predict future price movements?
While candlestick patterns can indicate potential price movements, they are not foolproof. Always consider additional analysis and market conditions before making trading decisions.

Risk Management Strategies
When it comes to trading in the highly volatile world of cryptocurrencies, risk management is not just an option; it’s a necessity. Imagine sailing a ship through turbulent waters without a compass or life raft—risky, right? That's precisely how trading without a solid risk management strategy feels. By implementing effective strategies, traders can protect their investments, minimize losses, and increase their chances of long-term success.
One of the foundational principles of risk management is the concept of position sizing. This refers to determining how much capital to allocate to a single trade. A common rule of thumb is to risk only 1-2% of your total trading capital on any given trade. This way, even a series of losses won’t significantly impact your overall portfolio. For instance, if your trading capital is $10,000, risking 1% means you would only lose $100 on a single trade. This approach allows traders to stay in the game longer, even during rough patches.
Another essential strategy is the use of stop-loss orders. A stop-loss order automatically sells your asset when it reaches a certain price, preventing further losses. Think of it as a safety net that catches you before you fall too far. Setting a stop-loss order at a level where you’re comfortable with the potential loss can help you maintain emotional control during trading. For example, if you purchase Bitcoin at $50,000, you might set a stop-loss at $48,000. This way, if the market turns against you, your position will automatically close, limiting your loss.
In addition to position sizing and stop-loss orders, diversification is a powerful risk management strategy. By spreading your investments across various cryptocurrencies, you can reduce the impact of a poor-performing asset on your overall portfolio. Just like a balanced diet is crucial for good health, a diversified portfolio is essential for a healthy trading strategy. For instance, instead of putting all your money into Bitcoin, consider allocating funds to Ethereum, Litecoin, and other altcoins. This way, if one asset underperforms, the others can help cushion the blow.
Finally, it’s vital to regularly review and adjust your risk management strategies. The crypto market is dynamic and can change rapidly. What worked yesterday may not work tomorrow. Keeping an eye on market trends, your trading performance, and adjusting your strategies accordingly can help you stay ahead. Consider maintaining a trading journal where you document your trades, the rationale behind them, and the outcomes. This practice not only helps in learning from past mistakes but also allows you to refine your strategies over time.
In conclusion, risk management in crypto trading is all about being prepared for the unexpected. By employing strategies like position sizing, stop-loss orders, diversification, and regular reviews, you can navigate the turbulent waters of the crypto market with greater confidence. Remember, it’s not just about winning trades; it’s about protecting your capital and ensuring longevity in your trading journey.
- What is the best risk management strategy for crypto trading? The best strategy often includes a combination of position sizing, stop-loss orders, and diversification tailored to your individual trading style and risk tolerance.
- How much should I risk on a single trade? A common recommendation is to risk no more than 1-2% of your total trading capital on any single trade.
- Why is diversification important in crypto trading? Diversification helps reduce the risk of significant losses by spreading investments across various assets, which can perform differently under various market conditions.
- How can I track my trading performance? Keeping a trading journal is an effective way to document your trades, analyze your performance, and make informed adjustments to your strategies.
Frequently Asked Questions
- What are candlestick patterns?
Candlestick patterns are visual representations of price movements in the market over a specific time frame. They help traders understand market sentiment and can indicate potential price reversals or continuations.
- Why are candlestick patterns important in crypto trading?
Understanding candlestick patterns is crucial because they assist traders in identifying market trends, entry and exit points, and the overall sentiment. This knowledge can significantly enhance trading strategies and improve decision-making.
- What are the basic components of a candlestick?
Each candlestick consists of a body and wicks. The body shows the price range between the opening and closing prices, while the wicks represent the high and low prices during that time frame.
- What does the body of a candlestick indicate?
The body of a candlestick indicates the price range between the opening and closing prices. A filled body suggests a bearish trend, whereas an empty body indicates a bullish trend.
- What are wicks and how do they affect candlestick interpretation?
Wicks, also known as shadows, represent the price extremes during the candlestick's time frame. They provide context about market volatility and can indicate potential reversals in sentiment.
- What are some popular candlestick patterns?
Some well-known candlestick patterns include the doji, hammer, and engulfing patterns. Recognizing these patterns can help traders identify potential market movements and capitalize on profitable opportunities.
- How can I use candlestick patterns in my trading strategy?
Traders can leverage candlestick patterns by combining them with other technical indicators, such as moving averages and RSI, to make informed decisions and enhance their trading strategies.
- What role does risk management play in candlestick analysis?
Implementing risk management strategies alongside candlestick analysis is essential for protecting investments and ensuring long-term success in the volatile crypto market. It helps traders minimize losses and manage their exposure effectively.