Using Fibonacci Retracement in Crypto Trading Strategies
In the ever-evolving world of cryptocurrency trading, making informed decisions can feel like navigating a labyrinth. One tool that has gained traction among traders is Fibonacci retracement. This technique not only helps in identifying potential reversal levels but also enhances risk management strategies. Imagine having a map that guides you through the twists and turns of the market, helping you spot opportunities and avoid pitfalls. That's what Fibonacci retracement does for traders. By understanding and applying this tool, you can significantly improve your trading outcomes.
Fibonacci retracement levels are derived from the famous Fibonacci sequence, a series of numbers where each number is the sum of the two preceding ones. This sequence reveals natural patterns that occur in various aspects of life, including financial markets. When applied to trading, these levels help traders identify potential support and resistance zones. The beauty of Fibonacci retracement lies in its simplicity and effectiveness. It’s like having a secret weapon in your trading arsenal, ready to assist you in making better decisions.
As we delve deeper into the world of Fibonacci retracement, you'll discover how to calculate these levels, identify key price points, and integrate them with other trading indicators. Each step is crucial in crafting a robust trading strategy that can adapt to the volatile nature of cryptocurrencies. So, buckle up as we explore the ins and outs of using Fibonacci retracement in your trading journey!
Fibonacci retracement is a technical analysis tool used to identify potential reversal levels in asset prices. The concept is rooted in the Fibonacci sequence, which has fascinated mathematicians and traders alike. The key Fibonacci ratios—23.6%, 38.2%, 50%, 61.8%, and 100%—are derived from this sequence and are used to predict where a market might reverse after a significant price movement. This is particularly useful in the cryptocurrency markets, which are notorious for their volatility.
By plotting these levels on a price chart, traders can visualize potential support and resistance zones. For instance, if a cryptocurrency has experienced a significant price surge, traders will look for retracement levels to identify where the price might pull back before continuing its upward momentum. This insight allows traders to make more informed decisions, whether they are looking to enter a position or secure profits.
Calculating Fibonacci levels involves identifying significant price movements and applying Fibonacci ratios. To accurately determine these levels, follow these steps:
- Identify the most recent swing high and swing low on the price chart.
- Measure the distance between these two points.
- Apply the key Fibonacci ratios to this distance to find potential retracement levels.
For example, if a cryptocurrency’s price surged from $100 to $200, you would identify $100 as the swing low and $200 as the swing high. By applying the Fibonacci ratios to this range, you can calculate potential retracement levels at $176.40 (23.6%), $161.80 (38.2%), $150 (50%), and $138.20 (61.8%). These levels can serve as critical points for traders to watch for potential reversals.
To calculate Fibonacci levels, traders must first identify key price points, such as swing highs and lows. This can be done through several methods, including:
- Analyzing historical price movements to spot significant highs and lows.
- Using technical indicators like moving averages to confirm trends.
- Monitoring market news and events that may influence price action.
Understanding where these key points lie can greatly enhance the effectiveness of Fibonacci retracement levels in your trading strategy.
Historical price data plays a vital role in identifying significant price points. By analyzing past price movements, traders can gain valuable insights into how the market has reacted to certain levels in the past. This analysis can help validate the Fibonacci levels you calculate, making them more reliable for future trading decisions. Think of it as studying the footprints left behind in the sand—each step tells a story that can guide your next move.
Real-time market analysis is essential for adjusting Fibonacci levels dynamically. As market conditions change, so too should your Fibonacci levels. Techniques such as monitoring live price charts and using trading platforms that provide real-time data can help you stay ahead of the curve. This proactive approach allows you to refine your trading strategies based on the latest market trends, ensuring that you are always making decisions based on the most current information available.
Combining Fibonacci retracement with other technical indicators can improve trading accuracy. For example, using Fibonacci levels alongside moving averages or the Relative Strength Index (RSI) can provide a more comprehensive view of the market. This multi-faceted approach allows traders to confirm signals and make more informed decisions. It’s like having a Swiss Army knife for trading—each tool has its purpose, and together, they create a powerful strategy.
Many traders make errors when using Fibonacci retracement. Recognizing and avoiding these common pitfalls can lead to more successful trading outcomes. Here are a few mistakes to watch out for:
While Fibonacci levels are useful, over-reliance on them can lead to poor decision-making. It’s essential to maintain a balanced approach when using Fibonacci retracement in trading. Consider other indicators and market conditions to avoid falling into the trap of relying solely on one tool.
Market context is crucial when applying Fibonacci retracement. Always consider broader market trends and conditions to enhance the effectiveness of your trading strategies. Understanding the bigger picture can help you make more informed decisions and avoid unnecessary losses.
Q: What is Fibonacci retracement in crypto trading?
A: Fibonacci retracement is a technical analysis tool used to identify potential reversal levels in asset prices based on the Fibonacci sequence.
Q: How do I calculate Fibonacci levels?
A: To calculate Fibonacci levels, identify the swing high and swing low on a price chart, measure the distance between them, and apply the key Fibonacci ratios.
Q: Can I use Fibonacci retracement with other indicators?
A: Yes! Combining Fibonacci retracement with other technical indicators like moving averages or RSI can improve trading accuracy.
Q: What are common mistakes to avoid when using Fibonacci retracement?
A: Common mistakes include over-reliance on Fibonacci levels and ignoring broader market context.

Understanding Fibonacci Retracement
Fibonacci retracement is more than just a fancy term thrown around in the world of trading; it’s a powerful technical analysis tool that can help traders identify potential reversal levels in asset prices. But what exactly are Fibonacci numbers, and why do they matter in trading? Let's break it down. The Fibonacci sequence is a series of numbers where each number is the sum of the two preceding ones, typically starting with 0 and 1. This sequence leads to the ratios that traders often use, such as 23.6%, 38.2%, 61.8%, and 100%. These numbers aren't just random; they appear in nature, art, and even architecture, which makes them feel almost mystical when applied to trading.
So, how do these ratios come into play in the volatile world of cryptocurrency? When traders apply Fibonacci retracement levels to a price chart, they essentially create a framework for understanding where the price might bounce back or reverse after a significant move. Imagine you're on a rollercoaster; as you ascend, you can anticipate the drops. Fibonacci levels serve a similar purpose—they help you predict potential drops or rises in price after a significant movement.
To put it simply, Fibonacci retracement levels act as psychological barriers. Traders often place buy or sell orders around these levels, which can create self-fulfilling prophecies. If enough traders believe that a price will bounce off a Fibonacci level, their collective actions can lead to that very outcome. It's like a crowd at a concert; if everyone starts cheering at the same moment, the energy amplifies, and the atmosphere shifts. In trading, this collective behavior can lead to significant price movements.
Now, it’s important to note that while Fibonacci retracement can be incredibly useful, it’s not an infallible method. Market conditions, news events, and broader economic factors can easily influence price movements, sometimes overriding the patterns suggested by Fibonacci levels. Therefore, it’s crucial to use this tool in conjunction with other forms of analysis and indicators. Understanding the market context is key—like knowing when to jump into a conversation at a party; timing is everything.
In summary, Fibonacci retracement is a valuable tool that can help traders make informed decisions by predicting potential price reversals. By understanding the underlying principles of Fibonacci numbers and their application in trading, you can enhance your market strategies and improve your risk management. Just remember, while Fibonacci can guide you, it’s your own judgment and analysis that will ultimately lead you to success.

How to Calculate Fibonacci Levels
Calculating Fibonacci levels is a fundamental skill for any trader looking to harness the power of this technical analysis tool. To get started, you need to identify significant price movements in the market. This means pinpointing swing highs and swing lows, which are the peaks and troughs of price action. Once you have these key points, the next step is to apply the Fibonacci ratios, which are derived from the Fibonacci sequence. These ratios include 23.6%, 38.2%, 50%, 61.8%, and 100%, and they play a crucial role in identifying potential support and resistance levels.
To illustrate the calculation process, let’s break it down into manageable steps. First, you’ll want to determine the range of the price movement by subtracting the low from the high. For example, if the price of a cryptocurrency surged from $100 to $200, the range would be:
| Price Movement | Calculation |
|---|---|
| High | $200 |
| Low | $100 |
| Range | $200 - $100 $100 |
Once you have the range, you can apply the Fibonacci ratios to determine the retracement levels. For instance, to find the 61.8% retracement level, you would multiply the range by 0.618 and then subtract that value from the high price. Using our previous example:
| Fibonacci Level | Calculation | Result |
|---|---|---|
| 61.8% | Range * 0.618 | $100 * 0.618 $61.8 |
| Retracement Level | High - Result | $200 - $61.8 $138.2 |
Thus, the 61.8% Fibonacci retracement level would be at approximately $138.2. This level can serve as a potential support point during a price pullback. Keep in mind that while Fibonacci levels can provide valuable insights, they should not be used in isolation. It’s essential to combine them with other indicators and market analysis for a more comprehensive trading strategy.
Moreover, the accuracy of your Fibonacci levels can greatly improve by utilizing historical data. Analyzing past price movements helps you recognize how the asset has reacted to various Fibonacci levels in the past. This historical context can inform your trading decisions and enhance your ability to predict future price action.
In addition to historical data, real-time market analysis is vital for dynamically adjusting your Fibonacci levels. As the market fluctuates, you’ll want to keep an eye on price trends and adjust your calculations accordingly. This adaptability can be the difference between a successful trade and a missed opportunity.
In summary, calculating Fibonacci levels involves:
- Identifying significant price movements.
- Determining the range by subtracting the low from the high.
- Applying Fibonacci ratios to find potential support and resistance levels.
- Utilizing both historical data and real-time analysis to enhance accuracy.
By mastering these steps, you can effectively leverage Fibonacci retracement levels in your trading strategy, improving your decision-making and risk management capabilities.

Identifying Key Price Points
When it comes to trading, identifying key price points is like finding the treasure map that leads you to success. These points, often referred to as swing highs and lows, are crucial for calculating Fibonacci retracement levels. But how do you pinpoint these pivotal moments in the chaotic world of crypto trading? First off, it’s essential to understand that key price points represent areas where the price has reversed direction or stalled, indicating potential support or resistance levels.
One effective method to identify these key price points is by analyzing historical price charts. Look for peaks and troughs in the price movement. These are your swing highs and lows. For instance, if Bitcoin recently surged to $60,000 before dropping to $50,000, those two prices are your critical levels. The swing high at $60,000 and the swing low at $50,000 provide a framework for applying Fibonacci retracement. But don’t just take a glance—dive deep! Use candlestick patterns and volume analysis to get a clearer picture.
Moreover, consider the time frame you’re trading in. Different time frames can yield different key price points. For example, a daily chart might show a swing high at $65,000, while an hourly chart could reveal a different swing low at $58,000. By analyzing multiple time frames, you can create a more comprehensive view of the market, enhancing your ability to make informed decisions.
Another important aspect is to stay updated on market news and events. Major announcements or shifts in market sentiment can create new key price points almost overnight. For instance, if a major exchange announces that it will list a new cryptocurrency, this could lead to sudden price spikes or drops, altering the landscape of key price points. Therefore, always keep an eye on the news and be ready to adjust your analysis accordingly.
In summary, identifying key price points is a blend of art and science. By combining historical data analysis, real-time market observations, and staying attuned to news events, you can effectively pinpoint those crucial swing highs and lows. This will not only enhance your Fibonacci retracement calculations but also empower you to make more strategic trading decisions. Remember, in the world of crypto, timing is everything, and knowing where to look for these key price points can make all the difference.
- What are swing highs and lows?
Swing highs are the peaks in price movements, while swing lows are the troughs. They are essential for identifying key price points in trading.
- How can I find key price points quickly?
Utilize charting tools and indicators to analyze price movements over different time frames, and keep an eye on news events that may impact prices.
- Do I need to analyze multiple time frames?
Yes! Analyzing multiple time frames can provide a more comprehensive view of the market and help you identify significant swing points.

Using Historical Data
When it comes to trading cryptocurrencies, leveraging historical data is not just a good practice; it's essential. Think of historical data as your personal time machine, allowing you to glance back at past price movements and trends to make informed decisions about future trades. This data provides context and helps you identify significant price points, which are crucial for calculating Fibonacci retracement levels.
To effectively use historical data, you should start by analyzing charts over different time frames. For instance, daily, weekly, and monthly charts can reveal varying trends and price behaviors. By examining these time frames, you can spot patterns that may repeat, giving you insights into potential future movements. This is akin to looking at the weather patterns before planning a picnic; understanding the past can help you prepare for what's ahead.
Moreover, when analyzing historical data, focus on key price points such as swing highs and swing lows. These points are where the price has reversed direction in the past and are critical for Fibonacci calculations. To illustrate, consider the following table that summarizes how to identify these key price points:
| Price Movement | Description |
|---|---|
| Swing High | A peak where the price reaches a maximum before declining. |
| Swing Low | A trough where the price reaches a minimum before rising. |
Additionally, historical data can help you recognize support and resistance levels. These levels are often where prices have bounced back or faced rejection in the past, making them vital for setting your Fibonacci retracement levels. By combining these historical insights with Fibonacci ratios, you can create a more robust trading strategy.
It's important to remember that while historical data provides valuable insights, it should not be the sole basis for your trading decisions. Market conditions can change rapidly, and what worked in the past may not necessarily apply in the future. Thus, always complement your analysis with real-time data and market news to ensure you’re making well-rounded trading decisions.
In summary, utilizing historical data in your trading strategy is like having a map in uncharted territory. It guides you, helps you avoid pitfalls, and enhances your ability to predict potential price movements. By understanding where the price has been, you can make better guesses about where it might go next, especially when combined with Fibonacci retracement levels.

Real-time Market Analysis
In the fast-paced world of cryptocurrency trading, is not just an option; it’s a necessity. Imagine trying to catch a wave without knowing when it’s coming—frustrating, right? That’s precisely what trading without real-time insights feels like. By closely monitoring live price movements and market sentiment, traders can dynamically adjust their Fibonacci retracement levels to align with current market conditions.
To effectively conduct real-time market analysis, traders should utilize various tools and platforms that provide instant data feeds. Here are a few essential elements to consider:
- Price Charts: Utilize candlestick charts to visualize price movements and identify trends quickly.
- Volume Indicators: Pay attention to trading volume, which can indicate the strength of a price movement.
- Market News: Stay updated with the latest news and events in the crypto space, as they can significantly impact price action.
By integrating these elements into your trading routine, you can create a more responsive strategy that adapts to the ever-changing market landscape. For instance, if you notice a sudden spike in trading volume at a Fibonacci level, it could signal a potential reversal or breakout. This kind of insight allows you to make informed decisions rather than relying solely on static levels derived from historical data.
Moreover, using advanced trading platforms that offer real-time alerts can be a game-changer. Imagine receiving a notification when the price approaches a critical Fibonacci level—this gives you the edge to act swiftly before the market shifts. Tools like TradingView or Coinigy provide customizable alerts that can help you stay one step ahead.
In summary, real-time market analysis transforms the way traders interact with Fibonacci retracement levels. By remaining vigilant and responsive to live market conditions, you can refine your strategies, mitigate risks, and enhance your overall trading performance. Remember, in cryptocurrency trading, timing is everything, and the ability to react promptly to market changes can make all the difference.
- What is Fibonacci retracement? Fibonacci retracement is a tool used in technical analysis to identify potential reversal levels in asset prices based on Fibonacci ratios.
- How do I calculate Fibonacci levels? To calculate Fibonacci levels, identify significant price points (swing highs and lows) and apply Fibonacci ratios (23.6%, 38.2%, 50%, 61.8%, and 100%).
- Can I use Fibonacci retracement in crypto trading? Absolutely! Many crypto traders use Fibonacci retracement to make informed decisions and manage risks effectively.
- What are common mistakes when using Fibonacci retracement? Common mistakes include over-relying on Fibonacci levels and ignoring the broader market context.
Integrating Fibonacci with Other Indicators
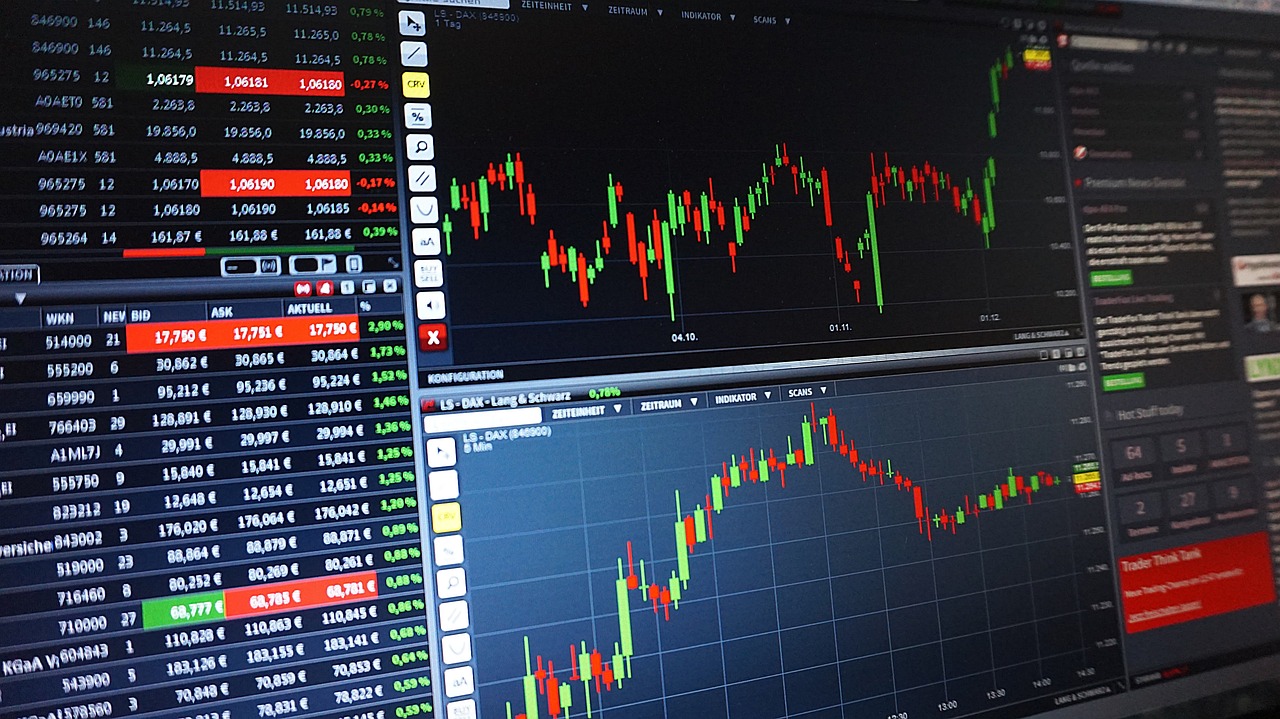
Integrating Fibonacci retracement levels with other technical indicators can significantly enhance your trading strategy. Think of Fibonacci as a compass that guides you through the vast ocean of cryptocurrency trading. Alone, it can point you in the right direction, but when combined with other tools, it can lead you to treasure troves of opportunities. The synergy created by using multiple indicators can provide a clearer picture of market trends and potential price reversals.
One popular method is to use Fibonacci retracement in conjunction with moving averages. Moving averages smooth out price data to identify the direction of the trend over a specific period. By overlaying Fibonacci levels on a moving average chart, traders can pinpoint areas where the price may experience support or resistance. For example, if a Fibonacci level coincides with a moving average, this could signal a strong support or resistance zone, making it a prime entry or exit point.
Another effective integration is with the Relative Strength Index (RSI). The RSI helps traders determine whether an asset is overbought or oversold, providing insights into potential price reversals. When the RSI indicates an overbought condition at a Fibonacci resistance level, this could reinforce the idea of a price reversal. Conversely, if the RSI shows an oversold condition at a Fibonacci support level, it may signal a buying opportunity. This combination not only validates your analysis but also boosts your confidence in making trading decisions.
Moreover, candlestick patterns can also be integrated with Fibonacci retracement. By observing candlestick formations near Fibonacci levels, traders can gain insights into market sentiment. For instance, if a bullish engulfing pattern occurs at a Fibonacci support level, it could suggest a strong buying opportunity. Similarly, a bearish engulfing pattern at a resistance level might indicate a potential sell-off. Thus, combining these elements can provide a more comprehensive view of market dynamics.
Incorporating Fibonacci retracement with volume analysis can further refine your trading strategy. Volume often precedes price movements; therefore, if you notice increased trading volume at a Fibonacci level, it could signify that a significant price action is about to occur. For instance, if the price approaches a Fibonacci retracement level with high volume, it may indicate a strong commitment from traders, reinforcing the significance of that level.
In summary, integrating Fibonacci retracement with other indicators not only enhances the accuracy of your trading signals but also provides a multi-faceted view of the market. By using a combination of tools like moving averages, RSI, candlestick patterns, and volume analysis, you can navigate the complexities of cryptocurrency trading with greater confidence and precision. Remember, the key is to maintain a balanced approach, allowing each indicator to complement the others, thereby creating a robust trading strategy.
- What is Fibonacci retracement?
Fibonacci retracement is a technical analysis tool that helps traders identify potential reversal levels in asset prices based on the Fibonacci sequence.
- How do I calculate Fibonacci levels?
To calculate Fibonacci levels, identify significant price movements and apply Fibonacci ratios (23.6%, 38.2%, 50%, 61.8%, and 100%) to determine potential support and resistance levels.
- Can Fibonacci retracement be used in all markets?
Yes, Fibonacci retracement can be applied in various markets, including stocks, forex, and cryptocurrencies, making it a versatile tool for traders.
- What are common mistakes to avoid when using Fibonacci retracement?
Common mistakes include over-reliance on Fibonacci levels, ignoring market context, and failing to combine them with other indicators for a comprehensive analysis.

Common Mistakes to Avoid
When it comes to using Fibonacci retracement in crypto trading, many traders, both novice and experienced, often stumble into a few common pitfalls. These mistakes can lead to poor decision-making and missed opportunities. So, let's dive into some of the most frequent errors and how to sidestep them for a more effective trading experience.
One major mistake is the over-reliance on Fibonacci levels. While these levels are indeed powerful tools for identifying potential reversal points, they are not infallible. It's crucial to remember that the market is influenced by a myriad of factors, including news events, market sentiment, and overall economic conditions. Relying solely on Fibonacci levels can lead to a false sense of security. Instead, consider them as part of a broader toolbox of technical analysis. Just like a chef wouldn’t rely on just one ingredient to create a sumptuous dish, you shouldn’t depend solely on Fibonacci retracement.
Another common error is ignoring market context. It's essential to understand that Fibonacci levels do not exist in a vacuum. For instance, if the overall market trend is bearish, a Fibonacci retracement might signal a potential reversal, but if the broader market sentiment is negative, the chances of that reversal holding are significantly reduced. Always take a step back and assess the larger market dynamics. This context can be the difference between a successful trade and a costly mistake.
Additionally, many traders fail to adjust their Fibonacci levels as the market evolves. Real-time market analysis is vital. As new price data comes in, it's important to revisit and possibly recalibrate your Fibonacci levels. Sticking to outdated levels can lead to misinterpretation of the market's current state. Think of it like navigating a ship; if you don’t adjust your course based on the winds and tides, you might end up far from your intended destination.
Finally, one common mistake is neglecting to combine Fibonacci retracement with other indicators. While Fibonacci levels provide valuable insight, they should not be used in isolation. Integrating them with other technical indicators such as moving averages, RSI, or MACD can enhance your trading strategy significantly. This holistic approach allows for a more comprehensive understanding of market conditions, helping you make informed decisions that could lead to better outcomes.
In summary, avoiding these common mistakes can greatly enhance your trading effectiveness. By maintaining a balanced approach, considering market context, adjusting your levels dynamically, and integrating other tools, you'll be well on your way to leveraging Fibonacci retracement for successful trades in the ever-changing world of cryptocurrency.
- What is Fibonacci retracement?
Fibonacci retracement is a technical analysis tool that uses horizontal lines to indicate areas of support or resistance at the key Fibonacci levels before the price continues in the original direction.
- How do I use Fibonacci retracement in my trading strategy?
To use Fibonacci retracement, identify a significant price movement, apply the Fibonacci levels, and combine them with other indicators to make informed trading decisions.
- What are the key Fibonacci levels to watch for?
The most commonly used Fibonacci levels are 23.6%, 38.2%, 50%, 61.8%, and 100%. These levels can indicate potential reversal points in the market.
Over-reliance on Fibonacci Levels
When diving into the world of cryptocurrency trading, it’s easy to get swept up in the allure of technical indicators, and Fibonacci retracement levels are no exception. These levels are often viewed as golden tickets to pinpointing potential reversal areas, but here’s the kicker: over-reliance on them can lead to disastrous outcomes. Imagine setting sail on a vast ocean, trusting only one navigation tool while ignoring the changing tides and weather conditions. That’s what it feels like to depend solely on Fibonacci levels.
Fibonacci retracement levels are derived from a mathematical sequence, which many traders believe can predict price movements. However, it’s crucial to remember that these levels are not infallible. They serve as a guide, not a guarantee. Relying too heavily on them can cloud your judgment and lead to poor trading decisions. For instance, a trader might see a price approaching a Fibonacci level and jump into a position without considering other factors, such as market sentiment or broader economic indicators.
Here are a few reasons why over-reliance on Fibonacci levels can be detrimental:
- Market Volatility: The crypto market is notoriously volatile. What worked yesterday may not hold today. If traders ignore the overall market conditions and only focus on Fibonacci levels, they may find themselves on the wrong side of a trade.
- False Signals: Fibonacci levels can sometimes produce false signals, leading traders to believe a reversal is imminent when it’s not. This can result in entering a position at the wrong time, ultimately leading to losses.
- Neglecting Other Indicators: Relying solely on Fibonacci retracement can cause traders to overlook other valuable technical indicators. Combining multiple tools can provide a more comprehensive view of the market and enhance decision-making.
To avoid falling into the trap of over-reliance, it’s essential to take a balanced approach. Use Fibonacci levels as part of a broader strategy that incorporates various technical indicators, market analysis, and even fundamental factors. For instance, consider integrating tools like moving averages, RSI (Relative Strength Index), or MACD (Moving Average Convergence Divergence) to validate your trading decisions.
In conclusion, while Fibonacci retracement levels can be a useful part of your trading toolkit, they should never be the sole basis for your decisions. By maintaining a well-rounded approach to trading, you can enhance your chances of success and navigate the unpredictable waters of the crypto market with greater confidence.
1. Can Fibonacci retracement levels guarantee successful trades?
No, they can indicate potential reversal points but should not be solely relied upon for making trading decisions.
2. What other indicators should I use with Fibonacci retracement?
Consider using moving averages, RSI, MACD, and volume analysis to create a more comprehensive trading strategy.
3. How often should I adjust my Fibonacci levels?
Adjust your Fibonacci levels regularly based on significant price movements and market conditions to maintain accuracy.

Ignoring Market Context
When diving into the world of cryptocurrency trading, it’s easy to get lost in the numbers and technical indicators. However, one of the most common mistakes traders make is . Just like a painter needs to understand the canvas before splashing colors, traders must grasp the broader market dynamics before relying solely on Fibonacci retracement levels.
Market context refers to the overall environment in which trading occurs, including economic indicators, market sentiment, and geopolitical factors. Without this context, Fibonacci levels can appear as mere numbers on a chart, disconnected from the reality of the market. For instance, if a trader sees a Fibonacci level indicating a potential support point but ignores a significant negative news event affecting the cryptocurrency market, they might make a poor trading decision. It’s like trying to sail a ship without checking the weather; you might end up in turbulent waters!
To truly leverage Fibonacci retracement effectively, traders should consider the following elements of market context:
- Market Sentiment: Understanding whether the market is bullish or bearish can greatly influence the effectiveness of Fibonacci levels. For example, in a strong uptrend, Fibonacci levels might serve as temporary pullbacks, while in a downtrend, they could indicate potential resistance levels.
- Economic Indicators: Factors such as inflation rates, employment data, and overall economic health can sway market movements. A trader who neglects these indicators may misinterpret Fibonacci levels, leading to misguided trades.
- Geopolitical Events: Political instability or regulatory changes can have immediate impacts on cryptocurrency prices. Traders must stay informed about these events to avoid falling into traps set by misleading Fibonacci signals.
Moreover, integrating news analysis into your trading strategy can provide a more holistic view. For instance, if a trader notices that a major exchange has announced a new partnership that could enhance the utility of a specific cryptocurrency, this could shift the market sentiment dramatically, rendering previous Fibonacci levels less relevant. It’s essential to adapt and reassess your trading strategy based on such developments.
In conclusion, while Fibonacci retracement levels are powerful tools in a trader's arsenal, they should never be used in isolation. By acknowledging and incorporating market context into your analysis, you can make more informed decisions that align with the realities of the market. Remember, trading is not just about numbers; it’s about understanding the story behind those numbers.
Q1: Why is market context important in cryptocurrency trading?
A1: Market context helps traders understand the broader environment affecting price movements, allowing for more informed trading decisions.
Q2: How can I stay updated on market sentiment?
A2: You can follow financial news outlets, social media channels, and cryptocurrency forums to gauge market sentiment effectively.
Q3: What are some key economic indicators to watch?
A3: Important indicators include inflation rates, employment data, and overall economic growth metrics, which can influence market trends.
Q4: How can geopolitical events impact cryptocurrency prices?
A4: Geopolitical events can lead to regulatory changes or market uncertainty, causing significant price volatility in cryptocurrencies.
Frequently Asked Questions
- What is Fibonacci retracement in crypto trading?
Fibonacci retracement is a technical analysis tool that helps traders identify potential reversal levels in cryptocurrency prices. By using Fibonacci ratios derived from the Fibonacci sequence, traders can spot areas where the price may bounce back or reverse direction, making it a valuable tool for decision-making and risk management.
- How do I calculate Fibonacci levels for trading?
To calculate Fibonacci levels, you first need to identify significant price movements, such as swing highs and lows. From there, you apply the Fibonacci ratios (23.6%, 38.2%, 50%, 61.8%, and 100%) to these price points. This process helps you establish potential support and resistance levels that can guide your trading strategy.
- Why is historical data important for Fibonacci retracement?
Historical price data is crucial because it allows traders to identify significant price points accurately. By analyzing past price movements, traders can enhance the reliability of their Fibonacci retracement levels, which in turn increases the likelihood of making informed trading decisions.
- Can I use Fibonacci retracement with other indicators?
Absolutely! Integrating Fibonacci retracement with other technical indicators, such as moving averages or RSI (Relative Strength Index), can significantly improve your trading accuracy. This combination helps create a more comprehensive trading strategy, allowing you to make better-informed decisions.
- What are common mistakes to avoid when using Fibonacci retracement?
One common mistake is over-reliance on Fibonacci levels without considering the broader market context. It's essential to maintain a balanced approach and not solely depend on Fibonacci retracement for decision-making. Additionally, ignoring market trends and conditions can lead to poor trading outcomes.
- How can I adjust my Fibonacci levels in real-time?
Real-time market analysis is key for dynamically adjusting your Fibonacci levels. By continuously monitoring live market conditions and price movements, you can refine your trading strategy and ensure that your Fibonacci retracement levels remain relevant and effective.


