Understanding the Use of Historical Price Data in Technical Analysis
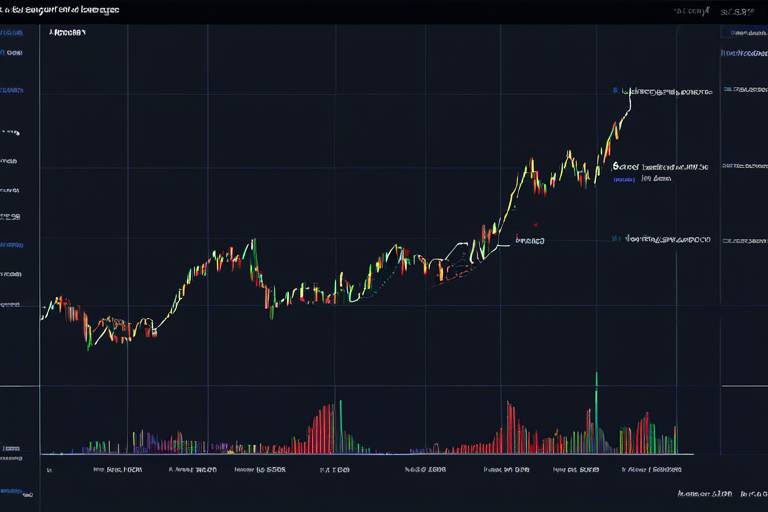
In the fast-paced world of trading, understanding the past can be the key to unlocking future profits. Historical price data serves as a treasure trove of information for traders, offering insights into market behavior and trends that can significantly impact trading decisions. By analyzing past price movements, traders can identify patterns that may suggest where prices are headed next. This article delves into the significance of historical price data in technical analysis, highlighting its benefits, limitations, and how traders can effectively utilize this information to make informed decisions in financial markets.
Historical price data is crucial for traders as it provides insights into market trends, patterns, and potential future movements. Think of it as a roadmap; it shows where the market has been and can hint at where it might go next. By examining how prices have reacted to various events over time, traders can make educated guesses about future price movements. For instance, if a stock consistently rebounds after hitting a certain price point, that level may act as a support level in the future. This historical perspective helps traders avoid blind spots and enhances their ability to make informed trading decisions based on past performance.
To effectively analyze historical price data, traders must grasp key concepts such as support and resistance, trends, and chart patterns. These concepts serve as the building blocks of technical analysis, guiding traders in their decision-making processes. Understanding how to identify these elements can be the difference between a successful trade and a costly mistake.
Support and resistance levels are critical indicators derived from historical price data. They help traders identify potential reversal points, which can be invaluable for making informed entry and exit decisions.
Support levels indicate price points where buying interest is strong enough to overcome selling pressure. When prices approach these levels, traders often anticipate a rebound, as historical data analysis shows that these points have previously attracted buyers. For example, if a stock has bounced back multiple times after hitting $50, that price becomes a significant support level. Knowing this allows traders to plan their entries around these levels, potentially increasing their chances of success.
Conversely, resistance levels highlight price points where selling interest outweighs buying pressure. When prices near these levels, traders can expect potential declines, as historical price movements often reveal that sellers become more active. If a stock consistently struggles to break through the $70 mark, that level acts as resistance. Recognizing these patterns enables traders to make strategic decisions regarding when to exit a position or set stop-loss orders.
Trend analysis involves examining historical price data to determine the direction of market movements. This is akin to reading the wind before setting sail; understanding whether the market is trending upwards, downwards, or sideways helps traders align their strategies with prevailing market trends. By identifying whether a stock is in a bullish or bearish trend, traders can make more informed decisions about when to enter or exit trades, optimizing their potential for profit.
While historical price data is invaluable, it does have its limitations. One significant drawback is its inability to predict sudden market changes or external factors that can influence price movements unpredictably. Just because a stock has behaved a certain way in the past doesn’t guarantee it will do so in the future.
Market volatility can significantly impact the reliability of historical price data. Events such as economic reports, earnings announcements, or geopolitical tensions can lead to abrupt price swings that historical data cannot account for. Therefore, it’s essential for traders to incorporate risk management strategies alongside their analyses to safeguard against unexpected market movements.
External factors such as economic news, geopolitical events, and market sentiment can affect price movements unpredictably. This unpredictability highlights the need for a holistic approach to technical analysis. Traders should not rely solely on historical data; they must also consider current events and market conditions when making trading decisions. By blending historical analysis with real-time data, traders can develop a more comprehensive view of the market.
Combining historical price data with other analysis tools, such as indicators and oscillators, enhances the accuracy of trading signals. For instance, using moving averages alongside historical data can help traders identify trends more effectively. This integration allows traders to develop a more robust trading strategy, improving their chances of success in the ever-changing financial markets.
- What is historical price data? Historical price data refers to the past prices of a financial instrument, including stocks, commodities, or currencies, over a specific period.
- How can I use historical price data in trading? Traders use historical price data to identify trends, support and resistance levels, and potential reversal points, which can inform their trading decisions.
- What are the limitations of using historical price data? Historical price data cannot predict sudden market changes or account for external influences, making it essential to use it in conjunction with other analysis tools.

The Importance of Historical Price Data
Historical price data is like a treasure map for traders navigating the often turbulent waters of financial markets. It provides a rich tapestry of insights into market trends, patterns, and potential future movements. By analyzing this data, traders can make informed decisions based on past performance, which is crucial for successful trading. Imagine trying to find your way in a dense fog without a map; that's what trading without historical data feels like. The past can reveal critical information that helps traders anticipate what might happen next.
One of the primary benefits of using historical price data is its ability to highlight trends. By examining how prices have moved over time, traders can identify whether a market is in an uptrend, downtrend, or sideways trend. This understanding is essential because it allows traders to align their strategies with the prevailing market conditions. For instance, if a trader identifies a consistent upward trend in a stock's price, they might choose to buy and hold, anticipating further gains. Conversely, recognizing a downward trend could prompt a trader to sell or short the asset to mitigate losses.
Additionally, historical price data aids in the identification of key support and resistance levels. These levels are crucial indicators that can signal potential reversal points in the market. Support levels are where buying interest is strong enough to overcome selling pressure, often leading to price rebounds. On the other hand, resistance levels indicate where selling interest outweighs buying pressure, typically resulting in price declines. Understanding these levels allows traders to make more informed entry and exit decisions, maximizing their potential for profit.
Furthermore, historical price data can be used to conduct statistical analysis, enabling traders to quantify risks and rewards. By analyzing historical volatility and price movements, traders can develop models that project potential future price behavior. This statistical approach can help in setting realistic profit targets and stop-loss orders, which are vital for effective risk management. For example, a trader might look at the historical volatility of a stock to determine how much the price fluctuates on average, helping them set appropriate stop-loss levels.
However, it's essential to remember that while historical price data is a powerful tool, it is not infallible. Markets are influenced by a multitude of factors, and past performance does not guarantee future results. Traders must remain vigilant and consider other variables that could impact market conditions. Nevertheless, the insights gained from historical data can significantly enhance a trader's ability to make informed decisions, ultimately leading to a more strategic approach in the financial markets.

Key Concepts in Technical Analysis
When diving into the world of technical analysis, it’s like embarking on a thrilling treasure hunt where the treasure is hidden within the charts. Understanding key concepts is your map, guiding you through the often chaotic landscape of financial markets. Among these concepts, support and resistance, trends, and chart patterns stand out as essential tools for traders. They help decode the historical price data, allowing traders to make educated guesses about future movements.
Support and resistance levels are fundamental ideas that every trader should grasp. Imagine you’re playing a game of tug-of-war. Support is like the ground that holds the rope steady when buyers pull it, while resistance is the point where sellers push back hard enough to prevent the price from rising any further. These levels are derived from past price movements and can be identified through various methods, such as horizontal lines on a chart or trend lines that slope upwards or downwards.
Identifying these levels is akin to spotting a lighthouse in a stormy sea. They provide crucial signals about potential reversal points in the market. For instance, when a price approaches a support level, it often bounces back up, like a basketball hitting the ground and rebounding. Conversely, when it nears a resistance level, it tends to decline, much like a wave crashing against a rocky shore.
Support levels are typically identified at price points where buying interest is robust enough to overcome selling pressure. Traders often look for historical price data where the price has previously bounced off a certain level multiple times. This repetition reinforces the strength of the support level. For example, if a stock has consistently bounced back from $50, traders might view this price as a strong support level, indicating that buyers are willing to step in at that price.
On the flip side, resistance levels are where selling interest prevails. These are price points where the stock has historically struggled to rise above. Think of it as a ceiling that the price keeps hitting but can’t seem to break through. For example, if a stock has repeatedly failed to rise above $100, traders will mark this level as resistance, suggesting that sellers are stepping in at that price to push the stock back down.
Next, let’s talk about trend analysis. This concept is all about understanding the direction in which the market is moving. Are we in a bullish (upward) trend, or are we stuck in a bearish (downward) trend? Analyzing historical price data allows traders to spot these trends and align their strategies accordingly. Picture a river flowing in a certain direction; if you swim with the current, you’ll likely get to your destination faster. Similarly, aligning your trades with the prevailing market trend can enhance your chances of success.
Traders can identify trends by looking at the highs and lows in the price data. An upward trend is characterized by higher highs and higher lows, while a downward trend shows lower highs and lower lows. This analysis can be visually represented in a
| Trend Type | Characteristics |
|---|---|
| Uptrend | Higher highs and higher lows |
| Downtrend | Lower highs and lower lows |
| Sideways Trend | Price moves within a range |
In conclusion, grasping these key concepts in technical analysis is like learning the rules of a game. They provide a framework that helps traders navigate the complexities of the market. By understanding support and resistance levels and analyzing trends, traders can make more informed decisions, ultimately leading to better trading outcomes.
- What is the purpose of technical analysis? Technical analysis aims to evaluate securities by analyzing statistics generated by market activity, like past prices and volume.
- How reliable is historical price data? While historical price data is a valuable tool, it is not foolproof. Traders should use it in conjunction with other analysis methods.
- Can trends change quickly? Yes, market trends can change rapidly due to various factors, including economic news and market sentiment.

Support and Resistance Levels
Support and resistance levels are like the invisible lines drawn on the battlefield of trading, guiding traders through the chaotic landscape of price movements. Think of support as a safety net that catches falling prices, while resistance acts as a ceiling that prevents them from rising too high. Traders often rely on these levels derived from historical price data to make crucial decisions about when to enter or exit the market. But how do these levels come into play?
Identifying support levels is essential for traders looking to capitalize on price rebounds. When the price of an asset approaches a support level, it often encounters strong buying interest. This is akin to a basketball player finding their footing before taking a shot; they need a solid base to push off from. In technical analysis, a support level is typically marked by previous lows where the price has bounced back multiple times. For example, if a stock has consistently rebounded at $50, that price point becomes a significant support level.
On the flip side, resistance levels serve as barriers that prices struggle to break through. Imagine trying to lift a heavy weight above your head; if it feels too heavy, you might give up. Similarly, when prices approach a resistance level, sellers often step in, causing a decline in price. Resistance levels are identified by previous highs where the price has faced downward pressure. If a stock repeatedly hits $70 and drops back down, that $70 mark becomes a critical resistance level.
To put this into perspective, let’s take a look at a simple table that summarizes the characteristics of support and resistance levels:
| Aspect | Support Level | Resistance Level |
|---|---|---|
| Definition | Price level where buying interest exceeds selling pressure | Price level where selling interest exceeds buying pressure |
| Market Behavior | Price tends to bounce back up | Price tends to fall back down |
| Trading Strategy | Consider buying near support | Consider selling near resistance |
Understanding these levels is crucial for developing a comprehensive trading strategy. Traders can utilize historical price data to plot these levels on charts, allowing them to visualize potential entry and exit points. However, it's important to remember that these levels are not foolproof. Just like a sturdy dam can break under extreme pressure, support and resistance levels can be breached due to significant market events or shifts in sentiment. Therefore, combining this analysis with other indicators can provide a more rounded view of market conditions.
In conclusion, mastering support and resistance levels is a fundamental skill for traders. By recognizing these critical points, traders can navigate the financial markets with greater confidence, making informed decisions that align with historical price movements. So, the next time you analyze a chart, remember these invisible lines—they might just be the key to unlocking your trading potential!
- What are support and resistance levels? Support levels are price points where buying interest is strong enough to overcome selling pressure, while resistance levels are where selling interest exceeds buying pressure.
- How can I identify support and resistance levels? You can identify these levels by looking at historical price charts and noting where prices have bounced back or faced declines in the past.
- Are support and resistance levels always accurate? No, they are not foolproof and can be breached during significant market events or shifts in sentiment.

Identifying Support Levels
Identifying support levels is a fundamental aspect of technical analysis that can significantly enhance a trader's decision-making process. Support levels represent price points where buying interest is strong enough to overcome selling pressure, often leading to price rebounds. Think of it as a safety net for prices; when the market dips to this level, buyers step in, preventing further declines. This phenomenon is not just a random occurrence but a reflection of collective market psychology, where traders recognize these price points from historical data.
To effectively identify support levels, traders often analyze historical price charts and look for areas where the price has previously bounced back. These levels can be determined visually or through various technical tools. For instance, consider a price chart where the asset has touched a specific price point multiple times without falling below it. This repeated interaction suggests that many traders view this price as a good buying opportunity, thus creating a support level.
Here are some common methods used to identify support levels:
- Historical Price Points: Look for past lows in the price chart that have held firm over time.
- Moving Averages: Traders often use moving averages as dynamic support levels. For example, a 50-day moving average can act as a support level during an uptrend.
- Trend Lines: Drawing trend lines along the lows of price movements can reveal potential support levels. When the price approaches this line, it may bounce back.
It's important to note that support levels are not set in stone. Market conditions can change rapidly due to various factors, including economic news or shifts in trader sentiment. Therefore, while historical price data provides a valuable framework, traders should remain vigilant and adaptable. For instance, if a support level is breached, it could indicate a shift in market dynamics, and traders may need to reassess their strategies accordingly.
In summary, identifying support levels is a critical skill for traders. By recognizing these price points through historical analysis and employing various techniques, traders can make informed decisions about their entry and exit points. Always remember, though, that while support levels can guide trading strategies, they should be used in conjunction with other analytical tools for the best results.
Q: What is a support level in trading?
A: A support level is a price point where buying interest is strong enough to prevent the price from falling further. It often leads to price rebounds.
Q: How can I identify support levels on a price chart?
A: You can identify support levels by looking for previous lows on the chart, using moving averages, or drawing trend lines along the lows of price movements.
Q: Are support levels always reliable?
A: No, support levels are not guaranteed. Market conditions can change, and a support level can be breached if selling pressure increases significantly.
Q: Should I use support levels alone for trading decisions?
A: It's best to use support levels in conjunction with other technical analysis tools and indicators to develop a comprehensive trading strategy.

Identifying Resistance Levels
Resistance levels are like the ceiling in a room; they represent price points where the upward momentum of an asset encounters significant selling pressure. When the price of a security approaches these levels, it often struggles to break through, leading to a reversal or a pullback. Understanding how to identify these resistance levels can be a game-changer for traders looking to optimize their entry and exit strategies.
To identify resistance levels, traders typically analyze historical price data and look for areas where the price has previously peaked. These peaks indicate that sellers were able to overpower buyers at those specific price points, creating a psychological barrier. But how do you pinpoint these levels accurately? Here are some effective methods:
- Chart Patterns: Look for recognizable patterns such as double tops or head and shoulders, which often indicate potential resistance points.
- Moving Averages: Traders often use moving averages, like the 50-day or 200-day moving average, as dynamic resistance levels. When the price approaches these averages, it may face selling pressure.
- Fibonacci Retracement Levels: Applying Fibonacci retracement levels can help identify potential resistance areas based on the mathematical relationships within the price movements.
Moreover, it’s important to consider the volume of trades at these resistance levels. A significant increase in trading volume as the price approaches a resistance level can indicate strong selling interest, further validating the resistance point. Conversely, if the price breaks through a resistance level with high volume, it may signal a shift in market sentiment, leading to a new trend.
In summary, identifying resistance levels is a crucial aspect of technical analysis. By recognizing these key price points, traders can make more informed decisions about when to enter or exit trades. Remember, just like a tightrope walker needs to know when to step back from the edge, traders must be aware of these resistance levels to navigate the market safely.
1. What is a resistance level?
Resistance levels are price points where selling pressure is strong enough to prevent the price from rising further. They act as barriers that traders monitor closely.
2. How can I identify resistance levels?
Resistance levels can be identified through various methods, including chart patterns, moving averages, and Fibonacci retracement levels. Analyzing historical price data is key to spotting these points.
3. Why are resistance levels important?
Resistance levels help traders make informed decisions about entry and exit points, allowing them to optimize their trading strategies and manage risk effectively.
4. Can resistance levels change?
Yes, resistance levels can change based on market dynamics. If a resistance level is broken, it may become a new support level, reflecting a shift in market sentiment.

Trend Analysis
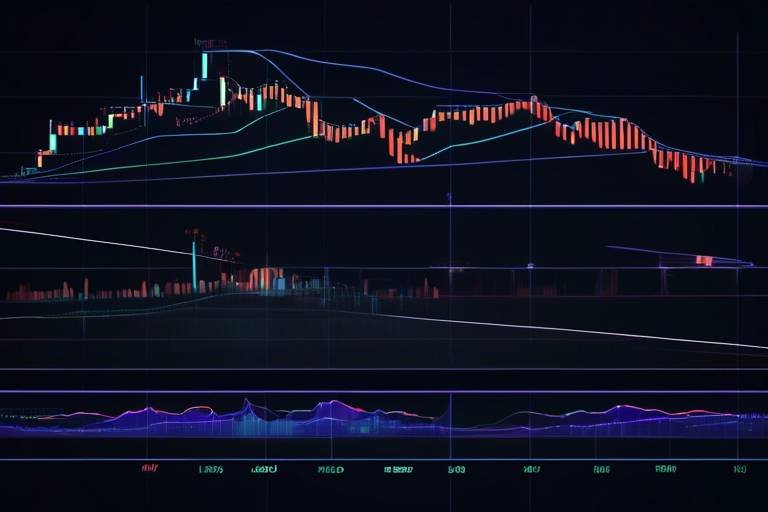
Trend analysis is a powerful tool that traders utilize to gauge the direction of market movements. Imagine standing on the shore and watching the waves; some are small, while others are massive, but over time, you can see a pattern in how they roll in. Similarly, by examining historical price data, traders can identify whether the market is in an uptrend, downtrend, or sideways movement. This analysis is not just about looking at past prices; it's about understanding the psychology of the market and the collective behavior of traders.
To effectively conduct trend analysis, traders often rely on various methods and tools. For instance, they might use moving averages, trend lines, and price action to determine the prevailing direction. A moving average smooths out price fluctuations, allowing traders to see the overall trend without the noise of daily price movements. On the other hand, trend lines act as visual guides, connecting significant price points to illustrate the market's trajectory. When traders see that prices consistently bounce off a trend line, it reinforces their belief in the trend's strength.
Moreover, recognizing the duration of a trend is crucial. Trends can be categorized into three primary types:
- Uptrend: Characterized by higher highs and higher lows, indicating that buyers are in control.
- Downtrend: Marked by lower highs and lower lows, suggesting that sellers dominate the market.
- Sideways Trend: When prices move within a range, indicating indecision among traders.
By understanding these trends, traders can align their strategies accordingly. For example, in an uptrend, they might look for buying opportunities, while in a downtrend, they may consider short-selling. The beauty of trend analysis lies in its ability to help traders make informed decisions based on historical price movements, allowing them to ride the waves of the market effectively.
However, it’s essential to remember that trends are not set in stone. They can change rapidly due to various factors, including economic news or unexpected events. Therefore, traders must remain vigilant and adaptable, ready to adjust their strategies as new information becomes available. In this way, trend analysis becomes not just a mechanical process but an art form that combines data interpretation with market intuition.
- What is the best time frame for trend analysis?
The best time frame depends on your trading style. Day traders may prefer shorter time frames like 5 or 15 minutes, while swing traders often look at daily or weekly charts.
- Can trend analysis guarantee profits?
No analysis can guarantee profits. Trend analysis helps in making informed decisions, but market conditions can change unexpectedly.
- How do I know if a trend is reversing?
Look for signs such as a break of key support or resistance levels, changes in volume, or specific chart patterns like head and shoulders.

Limitations of Historical Price Data
While historical price data serves as a fundamental tool in technical analysis, it’s essential to recognize its limitations. One of the most significant drawbacks is its inability to predict sudden market changes. Markets are dynamic, and while past performance can give insights into potential trends, it cannot account for unforeseen events that can drastically alter price movements. For instance, a sudden geopolitical crisis or a surprise economic report can lead to sharp market fluctuations that historical data simply cannot anticipate.
Moreover, the reliability of historical price data can be compromised by market volatility. During periods of high volatility, price movements can be erratic and unpredictable, making it challenging for traders to rely solely on past data to guide their decisions. This is particularly important for day traders or those looking to make quick trades, as the rapid changes can render historical patterns obsolete. Traders must remember that what worked yesterday may not work today, especially in a fast-paced market environment.
Another critical factor to consider is the influence of external factors. Economic news releases, such as interest rate changes or employment figures, can have an immediate impact on market sentiment and, consequently, on price movements. In addition, geopolitical events, like elections or international conflicts, can create market instability, further complicating the analysis of historical price data. Thus, it’s vital for traders to adopt a holistic approach that considers these external influences alongside their technical analysis.
To illustrate the impact of these limitations, consider the following table that highlights some common external factors and their potential effects on market prices:
| External Factor | Potential Effect on Price |
|---|---|
| Economic Reports | Can lead to significant price movements based on perceived economic health. |
| Geopolitical Events | May cause sudden volatility, leading to rapid price changes. |
| Market Sentiment | Shifts in trader sentiment can result in unexpected price trends. |
In summary, while historical price data is a valuable resource, traders should remain aware of its limitations. The unpredictable nature of financial markets necessitates the incorporation of risk management strategies and the consideration of external factors. By doing so, traders can enhance their decision-making process and improve their chances of success in the ever-changing landscape of financial trading.
- What is historical price data? Historical price data refers to past prices of financial instruments, used to analyze market trends and make predictions.
- How can I use historical price data effectively? To use historical price data effectively, combine it with other analysis tools and consider external factors that may influence market movements.
- What are some limitations of relying solely on historical price data? Limitations include the inability to predict sudden market changes, the impact of market volatility, and external influences that can affect price movements unpredictably.

Market Volatility
Market volatility is like the wild rollercoaster ride of the financial world—thrilling, unpredictable, and sometimes a little scary. When we talk about volatility, we refer to the degree of variation in trading prices over time. High volatility means prices can swing dramatically in a short period, while low volatility suggests a more stable price environment. For traders relying on historical price data, understanding and navigating market volatility is essential.
Why should traders care about volatility? Well, it can significantly impact the reliability of their analyses and strategies. A sudden spike in volatility can turn a seemingly straightforward trade into a chaotic scenario. Think of it this way: if you're driving down a smooth highway and suddenly hit a pothole, you need to react quickly to maintain control. Similarly, traders must be prepared for sudden shifts in the market that can disrupt their plans.
To grasp the concept of market volatility better, let’s break it down into a few key points:
- Volatility and Risk: Higher volatility often equates to higher risk. Traders must assess their risk tolerance and adjust their strategies accordingly.
- Using Historical Data: While historical price data can provide insights into past volatility, it's crucial to remember that past performance doesn’t guarantee future results. Traders should be cautious and not solely rely on historical data to predict future price movements.
- Risk Management Strategies: Implementing risk management techniques, such as stop-loss orders and position sizing, can help mitigate the impact of volatility on trading decisions.
Moreover, the unpredictability of market volatility often stems from external influences, such as economic reports, geopolitical tensions, or even sudden shifts in market sentiment. These factors can lead to price fluctuations that historical price data alone cannot predict. Just like weather forecasts, which can sometimes be off, traders must remain vigilant and adaptable.
In conclusion, while historical price data is a valuable tool for traders, it’s essential to consider the role of market volatility in their analyses. By understanding and preparing for volatility, traders can better navigate the unpredictable waters of the financial markets and make more informed decisions.
Q: What is market volatility?
A: Market volatility refers to the degree of variation in trading prices over time. High volatility indicates significant price fluctuations, while low volatility suggests more stable prices.
Q: How does volatility affect trading strategies?
A: Volatility can impact the reliability of trading strategies. High volatility may increase risk, prompting traders to adjust their approaches, such as incorporating risk management techniques.
Q: Can historical price data predict future volatility?
A: While historical price data can provide insights into past volatility, it cannot guarantee future price movements. Traders should use it as one of many tools in their analysis.
Q: What are some risk management strategies to handle volatility?
A: Common risk management strategies include setting stop-loss orders, diversifying investments, and adjusting position sizes based on market conditions.

External Influences
When diving into the world of trading, it's essential to recognize that historical price data, while valuable, does not exist in a vacuum. Numerous can dramatically shift market dynamics, making it crucial for traders to stay informed. Think of the financial markets as a living organism, constantly reacting to stimuli from its environment. Just as a sudden storm can change the course of a river, unexpected news or events can redirect market trends in the blink of an eye.
One of the most significant external influences comes from economic news. Reports on employment rates, inflation, and GDP growth can send ripples through the market. For instance, if a country releases a surprisingly high unemployment rate, traders might react by selling off stocks, leading to a decline in prices. Conversely, positive news can lead to a surge in buying activity. Therefore, keeping an eye on economic calendars and news releases is essential for any trader looking to navigate the tumultuous waters of the market.
Moreover, geopolitical events play a pivotal role in shaping market sentiment. Events such as elections, international conflicts, or trade agreements can create uncertainty or optimism among investors. For example, if tensions rise between two countries, it could lead to market volatility as traders react to the perceived risks. This unpredictability highlights the importance of a holistic approach to technical analysis, where historical data is just one piece of the puzzle.
Another factor to consider is market sentiment, which can often be gauged through social media trends, investor surveys, or even the buzz in financial news outlets. The collective mood of investors can lead to herd behavior, where traders follow the crowd rather than relying solely on historical data. This phenomenon can create significant price swings that historical data alone might not predict. To illustrate this, consider the impact of a viral tweet from a prominent figure in finance; it can lead to rapid buying or selling, often based on sentiment rather than fundamentals.
In summary, while historical price data serves as a valuable tool for traders, it is vital to remain aware of the external influences that can impact market behavior. By integrating this understanding with technical analysis, traders can develop a more comprehensive strategy that accounts for both past trends and potential future disruptions.
- What are some common external influences on the market?
Common external influences include economic news, geopolitical events, and overall market sentiment.
- How can I stay updated on external influences?
Utilizing economic calendars, following reputable financial news sources, and engaging with market analysis can help you stay informed.
- Why is it important to consider external influences when using historical price data?
External influences can lead to unexpected market movements that historical data alone may not predict, making a comprehensive approach essential.

Integrating Historical Data with Other Analysis Tools
When it comes to trading, relying solely on historical price data can be like navigating a ship without a compass. Sure, you can see where you've been, but without additional tools, you're at the mercy of the waves. By integrating historical data with other analysis tools, traders can significantly enhance their decision-making capabilities. This combination allows for a more nuanced understanding of market movements and can lead to more informed trading strategies.
One of the most effective ways to integrate historical price data is through the use of technical indicators. These indicators, such as moving averages, Relative Strength Index (RSI), and Bollinger Bands, provide additional layers of insight that can help traders decipher the noise in the market. For instance, a trader might notice a bullish trend in historical price data, but by applying a moving average, they can confirm whether that trend is likely to continue or if it's just a temporary spike.
Moreover, oscillators can be incredibly useful for identifying potential reversal points. By using tools like the Stochastic Oscillator or the MACD (Moving Average Convergence Divergence), traders can compare historical price data against momentum indicators to spot divergences. This can be a game-changer; imagine being able to see that while prices are rising, the momentum is actually weakening. That’s a signal that it might be time to reevaluate your position.
To illustrate how these tools work together, consider the following table that summarizes popular technical indicators and their purposes:
| Indicator | Purpose |
|---|---|
| Moving Averages | Smooth out price data to identify the direction of the trend. |
| Relative Strength Index (RSI) | Measure the speed and change of price movements to identify overbought or oversold conditions. |
| Bollinger Bands | Indicate volatility and potential price reversals based on historical price data. |
| MACD | Show the relationship between two moving averages to identify momentum shifts. |
In addition to these indicators, combining historical data with chart patterns can also yield valuable insights. Patterns such as head and shoulders, double tops, and flags can often signal potential price movements. By analyzing how these patterns have played out in the past, traders can better anticipate future market behavior. For example, if a trader identifies a head and shoulders pattern forming, they might look back at similar historical patterns to gauge how the price reacted in those instances.
However, it's crucial to remember that while integrating these tools can enhance your analysis, it’s not a foolproof method. The market is influenced by a myriad of factors, and no single tool or combination of tools can predict movements with absolute certainty. Therefore, traders should always maintain a level of skepticism and be prepared to adapt their strategies as new information becomes available.
Ultimately, the integration of historical price data with various analysis tools creates a more holistic trading strategy. By combining the past with real-time indicators and patterns, traders can navigate the complexities of the market with greater confidence. So, the next time you sit down to analyze the charts, consider how you can enrich your historical data insights with these powerful tools.
- What is historical price data?
Historical price data refers to past prices of a financial asset, which traders use to identify trends and patterns that can inform future trading decisions. - How do technical indicators enhance trading strategies?
Technical indicators provide additional insights into market trends and potential price movements, allowing traders to make more informed decisions. - Can historical price data guarantee future performance?
No, while historical price data can provide valuable insights, it cannot guarantee future performance due to the unpredictable nature of the markets. - What are some common technical indicators?
Some common technical indicators include moving averages, RSI, Bollinger Bands, and MACD.
Frequently Asked Questions
- What is historical price data?
Historical price data refers to the past prices of a financial asset, including details such as open, high, low, and close prices over specific time periods. This data is essential for traders to analyze market trends and make informed decisions based on previous performance.
- How can I use historical price data in trading?
You can use historical price data to identify trends, support and resistance levels, and chart patterns. By analyzing this data, traders can forecast potential future price movements and enhance their trading strategies for better outcomes.
- What are support and resistance levels?
Support and resistance levels are critical price points identified through historical price data. Support levels indicate where buying interest is strong enough to prevent prices from falling further, while resistance levels show where selling interest is strong enough to prevent prices from rising.
- Are there limitations to using historical price data?
Yes, while historical price data is valuable, it has limitations. It cannot predict sudden market changes or account for external factors like economic news or geopolitical events that can significantly impact price movements.
- How does market volatility affect historical price data analysis?
Market volatility can greatly impact the reliability of historical price data. During volatile periods, prices may fluctuate wildly, making it essential for traders to incorporate risk management strategies alongside their analyses to safeguard against unexpected losses.
- Can I combine historical price data with other analysis tools?
Absolutely! Combining historical price data with other analysis tools, such as indicators and oscillators, can enhance the accuracy of your trading signals. This integrated approach helps traders develop a more robust and effective trading strategy.