Technical Analysis vs. Fundamental Analysis - Which is Better for Crypto?
In the fast-paced world of cryptocurrency, investors are often faced with the daunting task of choosing the right method to analyze their investments. With thousands of cryptocurrencies available and market conditions that can change on a dime, the choice between technical analysis and fundamental analysis can feel overwhelming. So, which method is better for crypto? The answer isn't straightforward, as both approaches have their unique strengths and weaknesses. Let's dive deep into each method to help you understand which one might suit your investment style better.
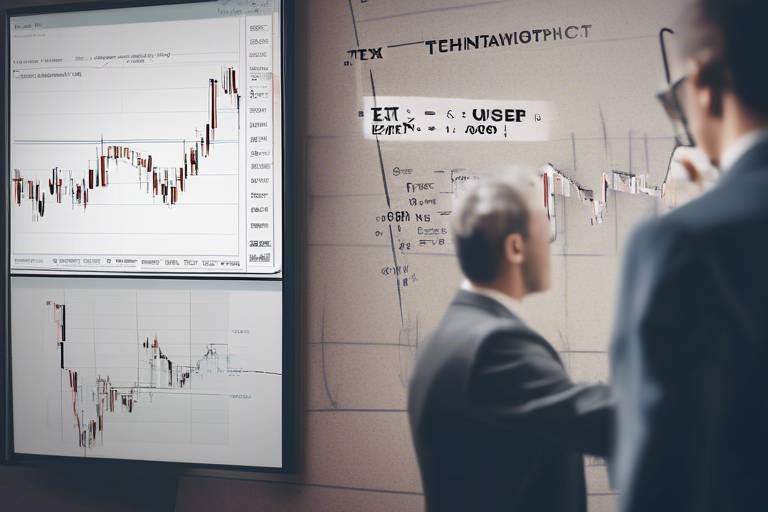
Technical analysis is like reading the pulse of the market. It focuses on price movements and trading volumes to forecast future price changes. Imagine you're a detective, piecing together clues from past market behavior to predict what might happen next. Traders use various tools and charts to analyze patterns and trends, helping them make informed decisions about when to buy or sell. By examining price charts, traders can identify support and resistance levels, which are crucial for determining entry and exit points in their trades.
On the flip side, fundamental analysis is more about understanding the essence of a cryptocurrency. It's akin to digging deep into the roots of a tree to see how strong it is. This method evaluates a cryptocurrency's underlying value by examining factors like its technology, the expertise of its team, and overall market demand. For instance, a cryptocurrency with a solid technological foundation and a strong development team is often seen as a more reliable investment than one without. Fundamental analysis helps investors gauge whether a cryptocurrency is undervalued or overvalued based on its intrinsic value.
When it comes to technical analysis, traders have a toolbox filled with various instruments to aid their decision-making. Tools like moving averages and the Relative Strength Index (RSI) are essential for analyzing price trends and market behavior. Moving averages smooth out price fluctuations, allowing traders to identify the overall direction of the trend. The RSI, on the other hand, helps traders determine whether a cryptocurrency is overbought or oversold, providing insights into potential price reversals.
Chart patterns are like the language of the market. Patterns such as head and shoulders or triangles are crucial for traders, as they can indicate potential future price movements. For example, a head and shoulders pattern often signals a reversal, while a triangle pattern may indicate a continuation of the current trend. Understanding these patterns can give traders an edge in predicting market sentiment and making timely trades.
Indicators and oscillators provide additional layers of insight into market conditions. Popular indicators like the Moving Average Convergence Divergence (MACD) and Bollinger Bands help traders analyze momentum and volatility. The MACD can signal potential buy or sell opportunities through crossovers, while Bollinger Bands help traders identify overbought or oversold conditions. Utilizing these tools can greatly enhance a trader's ability to navigate the unpredictable crypto market.
Fundamental analysis takes a broader view, considering various factors that impact a cryptocurrency's value. It's not just about numbers; it's about understanding the story behind the asset. Key elements include:
- Technology: The underlying technology of a cryptocurrency can determine its long-term viability.
- Team Expertise: A strong, experienced team can drive innovation and adoption.
- Market Trends: Understanding market demand and competition is crucial for assessing potential growth.
By evaluating these factors, investors can make more informed decisions about the cryptocurrencies they choose to invest in.
Now that we've explored both methods, it's time to compare their effectiveness in the crypto space. Technical analysis often shines in volatile markets where quick decisions are necessary. Traders can react to price movements in real-time, capitalizing on short-term opportunities. Conversely, fundamental analysis is essential for long-term investments, as it provides a deeper understanding of a cryptocurrency's potential for growth. In scenarios where market sentiment is driven by news events or technological advancements, fundamental analysis can lead to better investment decisions.
Technical analysis is particularly useful in volatile markets where prices fluctuate rapidly. For example, if a trader notices a sudden spike in trading volume or a breakout from a key resistance level, they may decide to enter a trade based on these signals. In such scenarios, technical analysis provides the tools needed to make quick, informed decisions.
On the other hand, fundamental analysis is ideal for those looking to invest for the long haul. If a cryptocurrency has a strong technological foundation and a dedicated development team, it may be worth holding onto even during market downturns. In these situations, understanding the fundamentals can lead to better investment choices, as it allows investors to see beyond short-term price fluctuations.
1. Can I use both technical and fundamental analysis?
Absolutely! Many successful traders and investors use a combination of both methods to enhance their decision-making process. By understanding market trends through technical analysis and evaluating the underlying value through fundamental analysis, you can create a more comprehensive investment strategy.
2. Which analysis is more suitable for beginners?
For beginners, fundamental analysis might be easier to grasp as it focuses on understanding the cryptocurrency itself rather than complex charts and indicators. However, learning technical analysis can be beneficial as you gain experience in trading.
3. How often should I analyze my investments?
This largely depends on your investment strategy. If you're a day trader, you may analyze your investments multiple times a day. However, if you're a long-term investor, periodic reviews based on fundamental changes in the cryptocurrency could suffice.

Understanding Technical Analysis
Technical analysis is like the art of reading the mood of a crowd at a concert. Just as a musician gauges the energy of the audience to decide whether to play a slow ballad or a high-energy anthem, traders use technical analysis to interpret price movements and trading volumes in the cryptocurrency market. This method primarily focuses on historical price data, assuming that past price movements can provide valuable insights into future trends. It’s all about patterns, charts, and indicators that help traders make informed decisions.
At its core, technical analysis relies on the principle that market psychology drives price movements. Traders believe that if they can understand the collective behavior of market participants, they can predict future price changes. This approach is particularly appealing in the highly volatile world of cryptocurrencies, where prices can swing dramatically in a matter of hours. By analyzing charts, traders can identify trends, support and resistance levels, and potential reversal points, allowing them to strategize their trades effectively.
One of the key elements of technical analysis is the use of various tools and indicators. These tools help traders dissect price movements and market behavior. For instance, moving averages smooth out price data to identify trends over time, while the Relative Strength Index (RSI) helps determine whether a cryptocurrency is overbought or oversold. Understanding these tools and how to apply them is essential for anyone looking to navigate the crypto market successfully.
As we dive deeper, let's explore some of the most popular tools used in technical analysis:
- Moving Averages: These are used to identify trends by averaging the price over a specific period. Traders often look at the 50-day and 200-day moving averages to gauge long-term trends.
- Relative Strength Index (RSI): This momentum oscillator measures the speed and change of price movements, providing insights into whether an asset is overbought or oversold.
- MACD (Moving Average Convergence Divergence): This indicator helps traders identify potential buy and sell signals by comparing two moving averages.
- Bollinger Bands: These bands provide a relative definition of high and low prices, helping traders identify volatility and potential price reversals.
In addition to these tools, chart patterns play a significant role in technical analysis. Patterns such as head and shoulders, triangles, and flags can indicate potential price movements. For example, a 'head and shoulders' pattern often signals a reversal from bullish to bearish, while triangles can indicate a continuation of the current trend. Recognizing these patterns can provide traders with a crucial edge in their decision-making process.
Chart patterns are the visual representation of market psychology. They reflect the collective behavior of traders and investors, showcasing their reactions to price changes. When a trader spots a familiar pattern, it's like seeing a road sign that indicates what's ahead. For instance, if a trader identifies a 'double bottom' pattern, they might anticipate an upward price movement, signaling a potential buying opportunity.
Indicators and oscillators are essential tools that enhance the predictive power of technical analysis. They provide insights into market conditions and help traders make data-driven decisions. For example, the MACD can indicate whether to buy or sell based on the relationship between two moving averages. Similarly, Bollinger Bands help traders understand when an asset is experiencing high volatility, which can be a signal for potential trading opportunities.
In conclusion, technical analysis is a powerful approach that allows traders to navigate the often tumultuous waters of the cryptocurrency market. By utilizing various tools, indicators, and chart patterns, traders can gain valuable insights into price movements and market sentiment. Whether you're a seasoned trader or just starting, understanding technical analysis can significantly enhance your trading strategy and decision-making process.

Understanding Fundamental Analysis
When diving into the world of cryptocurrency, one of the most important concepts to grasp is fundamental analysis. Unlike technical analysis, which focuses solely on price movements and trading volumes, fundamental analysis takes a broader approach by evaluating the inherent value of a cryptocurrency. This methodology involves examining various factors that can influence a cryptocurrency's long-term potential and market performance. Think of it as understanding the DNA of a crypto asset; it’s about looking beyond the charts and understanding what makes a coin tick.
At its core, fundamental analysis seeks to answer questions like: What technology underpins this cryptocurrency? Who is behind the project? Is there a real market demand for this coin? By answering these questions, investors can make more informed decisions about whether a cryptocurrency is a worthy investment. Fundamental analysis often involves a thorough investigation of the project's whitepaper, the team’s credentials, partnerships, community support, and overall market trends.
Let’s break down some of the key components that are typically evaluated in fundamental analysis:
- Technology: What unique technology does the cryptocurrency offer? Is it scalable? Secure? Understanding the tech can provide insights into its future viability.
- Team: Who are the people behind the project? A strong, experienced team can be a significant indicator of potential success.
- Market Demand: Is there a genuine need for the cryptocurrency? Evaluating the use case and market demand can help gauge its long-term value.
- Competition: How does this cryptocurrency stack up against its competitors? Knowing the landscape can help in assessing its potential market share.
- Regulatory Environment: What regulations are in place that could affect the cryptocurrency? Understanding the legal landscape is crucial for assessing risk.
Each of these factors plays a pivotal role in determining a cryptocurrency's potential for growth and stability. For instance, a project that boasts innovative technology and a strong team is likely to attract more investor interest, which can drive up its price. Conversely, a project lacking transparency or a viable use case may struggle to gain traction, no matter how much hype surrounds it.
Moreover, fundamental analysis is particularly valuable for long-term investors. While day traders might rely heavily on technical indicators and short-term price movements, those looking to hold assets for the long haul need to understand the foundational aspects of their investments. This approach can help investors avoid falling for "pump and dump" schemes that can plague the crypto market.
In conclusion, fundamental analysis is an essential tool for anyone serious about investing in cryptocurrencies. By grasping the underlying principles and evaluating key factors, investors can make more informed decisions that align with their financial goals. It’s like having a treasure map; while the journey may be volatile, understanding the terrain can lead to discovering hidden gems in the crypto world.

Key Tools for Technical Analysis
When diving into the world of technical analysis, it's essential to have the right tools at your disposal. Think of these tools as your navigational instruments on a vast ocean of price movements and trading volumes. Without them, you might find yourself lost amidst the waves of market fluctuations. So, what are these indispensable tools that traders rely on to make informed decisions? Let's explore some of the most popular ones!
One of the most fundamental tools in a trader's arsenal is the Moving Average (MA). This tool smooths out price data by creating a constantly updated average price. Traders often use two types: the Simple Moving Average (SMA) and the Exponential Moving Average (EMA). The SMA gives equal weight to all prices, while the EMA gives more weight to recent prices, making it more responsive to new information. Imagine trying to predict the weather; the moving average helps you see the trend over time rather than just focusing on the unpredictable day-to-day changes.
Another essential tool is the Relative Strength Index (RSI). This momentum oscillator measures the speed and change of price movements, helping traders identify overbought or oversold conditions. An RSI above 70 typically indicates that a cryptocurrency might be overbought, while an RSI below 30 suggests it could be oversold. Think of it as a temperature gauge for the market—when it’s too hot or too cold, it might be time to take action.
Moving beyond these basics, traders also rely heavily on chart patterns to forecast future price movements. Patterns such as head and shoulders, triangles, and flags provide visual cues about potential market behavior. Recognizing these patterns can feel like deciphering a secret code that reveals the market's next move. For instance, a head and shoulders pattern often signals a reversal, while a triangle pattern can indicate a continuation of the trend. Understanding these patterns can be the difference between riding the wave of success and getting caught in a storm of losses.
Additionally, indicators and oscillators play a crucial role in technical analysis. Tools like the Moving Average Convergence Divergence (MACD) and Bollinger Bands help traders gauge market momentum and volatility. The MACD, for instance, shows the relationship between two moving averages of a security’s price, providing insights into potential buy and sell signals. Bollinger Bands, on the other hand, consist of a middle band (the moving average) and two outer bands that indicate volatility. When prices touch the outer bands, it can signal that the asset is overbought or oversold, much like a rubber band stretched too far.
In essence, the tools of technical analysis are like a toolkit for a mechanic. Each tool has its specific purpose, and when used together, they can help traders diagnose market conditions and make informed decisions. However, it’s crucial to remember that while these tools can provide valuable insights, they should not be used in isolation. Combining various tools and methods can lead to a more comprehensive understanding of market dynamics, ultimately enhancing trading strategies.
- What is the best tool for beginners in technical analysis?
For beginners, starting with simple tools like Moving Averages and RSI is recommended. They are user-friendly and provide a good foundation for understanding market trends. - Can technical analysis guarantee profits?
No analysis method can guarantee profits. Technical analysis helps identify potential trends and reversals but should be used in conjunction with risk management strategies. - How often should I check my technical analysis tools?
It depends on your trading strategy. Day traders might check their tools multiple times a day, while swing traders may look at them weekly.

Chart Patterns
Chart patterns are like the secret language of the market. They tell traders a story about potential future price movements based on historical data. When you look at a price chart, you’re not just staring at random squiggles; you’re witnessing the collective psychology of all the traders who have come before you. It's a bit like reading a novel where each chapter reveals something new about the characters—only in this case, the characters are market participants reacting to news, trends, and emotions.
Some of the most popular chart patterns include head and shoulders, triangles, and double tops. Each of these patterns has its own narrative and implications for future price action. For instance, a head and shoulders pattern typically indicates a reversal in trend, suggesting that the price might be on the verge of falling after reaching a peak. On the flip side, a triangle pattern often signals indecision in the market, with traders waiting for a breakout in either direction. Understanding these patterns can significantly enhance a trader's ability to predict market movements.
To illustrate how these patterns work, let’s take a closer look at a couple of examples:
| Chart Pattern | Description | Implication |
|---|---|---|
| Head and Shoulders | Consists of three peaks: a higher peak (head) between two lower peaks (shoulders). | Indicates a potential reversal from bullish to bearish. |
| Triangles | Formed by converging trendlines, indicating a period of consolidation. | Signals possible breakout or breakdown depending on the direction of the breakout. |
But why should you care about these patterns? Well, they serve as vital signposts on the road to trading success. By recognizing these formations, traders can make informed decisions about when to enter or exit a position. It’s like having a map in a treasure hunt; without it, you might end up lost in the wilderness of market volatility.
Moreover, chart patterns are often combined with other technical indicators to confirm signals. For instance, if a head and shoulders pattern appears alongside a bearish divergence in the Relative Strength Index (RSI), it could strengthen the case for a potential price drop. This synergy between different tools can create a more robust trading strategy.
In conclusion, chart patterns are an essential component of technical analysis. They provide insights into market sentiment and potential price movements, enabling traders to navigate the often tumultuous waters of cryptocurrency trading. Just remember, while these patterns can be incredibly useful, they are not foolproof. Always combine your analysis with other tools and a healthy dose of market awareness.

Indicators and Oscillators
When it comes to technical analysis in the cryptocurrency market, play a pivotal role in helping traders make informed decisions. These tools are designed to provide insights into market conditions, enabling traders to gauge the momentum and potential reversals in price movements. But what exactly are they, and how do they work?
Indicators are mathematical calculations based on price, volume, or open interest of a security. They help traders identify trends and potential entry or exit points. Common indicators include the Moving Average Convergence Divergence (MACD), which helps traders understand the relationship between two moving averages of a security’s price. When the MACD line crosses above the signal line, it may indicate a bullish trend, while a cross below could signal a bearish trend.
On the other hand, oscillators are a type of indicator that fluctuates between a set range, typically between 0 and 100. They are particularly useful in identifying overbought or oversold conditions in a market. For example, the Relative Strength Index (RSI) is a popular oscillator that measures the speed and change of price movements. An RSI above 70 suggests that a cryptocurrency might be overbought, while an RSI below 30 indicates it may be oversold.
To give you a clearer picture, here’s a simple comparison of some popular indicators and oscillators:
| Type | Name | Purpose |
|---|---|---|
| Indicator | MACD | Identifies trend direction and momentum |
| Oscillator | RSI | Measures overbought and oversold conditions |
| Indicator | Bollinger Bands | Indicates volatility and potential price reversals |
| Oscillator | Stochastic Oscillator | Compares a particular closing price of a security to a range of its prices over a certain period of time |
Traders often combine these indicators and oscillators to enhance their analysis. For instance, using the RSI alongside MACD can provide a more comprehensive view of market conditions. If both indicators suggest a bullish trend, it could reinforce a trader's decision to enter a position. However, it's important to remember that no single indicator or oscillator is foolproof. They are best used in conjunction with other forms of analysis, such as chart patterns and fundamental analysis, to form a well-rounded trading strategy.
In summary, indicators and oscillators are essential tools in the arsenal of a crypto trader. They help decipher complex market movements and provide valuable insights into potential price trends. By mastering these tools, traders can improve their decision-making process and potentially enhance their trading outcomes.
- What is the best indicator for trading cryptocurrencies?
The best indicator often depends on the trader's strategy and market conditions. Popular choices include MACD, RSI, and Bollinger Bands. - Can I use indicators for long-term investing?
While indicators are primarily used for short-term trading, they can also provide insights for long-term investments when used in conjunction with fundamental analysis. - How do I know when to trust an indicator?
It's crucial to combine indicators with other analysis methods and to consider the overall market context before making trading decisions.

Key Factors in Fundamental Analysis
When diving into the world of cryptocurrency, understanding the key factors in fundamental analysis is crucial for making informed investment decisions. Unlike technical analysis, which focuses on price movements, fundamental analysis digs deeper into the underlying value of a cryptocurrency. This approach evaluates various elements that can influence a coin's long-term viability and potential for growth.
One of the most significant factors is the technology behind the cryptocurrency. Investors should look at the blockchain's architecture, its scalability, and the unique features that set it apart from competitors. For instance, cryptocurrencies like Ethereum are not just digital currencies; they offer a platform for decentralized applications, which adds to their value proposition.
Another critical aspect is the team behind the project. A strong, experienced team can significantly impact a cryptocurrency's success. Investors should consider the backgrounds of the founders and developers. Are they well-respected in the tech community? Have they successfully launched other projects? A robust team often indicates a higher likelihood of success.
The market demand for a cryptocurrency is also pivotal. This involves analyzing the target audience and the problems the cryptocurrency aims to solve. For example, if a coin is designed to facilitate faster transactions in a specific sector, understanding that sector's needs and growth potential can provide insights into the coin's future performance. Additionally, examining the total supply and circulating supply can help gauge scarcity, which often affects price.
Moreover, it's essential to consider the regulatory environment. Cryptocurrencies operate in a rapidly changing landscape, and regulations can significantly affect their value. Keeping an eye on government policies and potential legal challenges can provide foresight into a coin's stability and growth prospects.
Finally, market trends play a significant role in fundamental analysis. Understanding the broader market sentiment can help investors identify whether a cryptocurrency is gaining traction or losing interest. For instance, during a bull market, even lesser-known coins may see a surge in demand, while in a bear market, even strong projects may struggle.
In summary, fundamental analysis offers a comprehensive view of a cryptocurrency's potential by examining its technology, team, market demand, regulatory environment, and overall market trends. By taking these factors into account, investors can make more informed decisions that align with their investment goals.
- What is the main difference between technical and fundamental analysis? Technical analysis focuses on price movements and patterns, while fundamental analysis evaluates the underlying value of a cryptocurrency based on various factors.
- How can I determine a cryptocurrency's potential? Look at the technology, team, market demand, regulatory environment, and market trends to assess its potential.
- Is fundamental analysis better for long-term investments? Yes, fundamental analysis is often more suited for long-term investments as it focuses on the intrinsic value of a cryptocurrency.
- Can I use both analyses for trading? Absolutely! Many traders use a combination of both technical and fundamental analysis to enhance their trading strategies.

Comparing Both Approaches
When it comes to investing in cryptocurrencies, the debate between technical analysis and fundamental analysis is as heated as a summer day in the desert. Each approach has its own set of fans, and while both aim to help investors make informed decisions, they do so in drastically different ways. So, how do you decide which one is better for you? Let's break it down.
Technical analysis is like reading the pulse of the market. It relies on historical price data and trading volumes, using charts and patterns to predict future movements. Think of it as a weather forecast for crypto prices. If you see dark clouds forming, you might grab your umbrella—or in this case, sell your assets before a market downturn. Traders who prefer this method often thrive in volatile environments, where quick decisions can lead to significant gains—or losses. The beauty of technical analysis lies in its ability to provide immediate insights, allowing traders to react swiftly.
On the other hand, fundamental analysis digs deeper, examining the underlying value of a cryptocurrency. This approach is akin to evaluating a company before investing in its stock. You wouldn't just look at the stock price; you'd consider the company's technology, the expertise of its team, market demand, and even its future potential. For long-term investors, understanding these elements is crucial. They want to know if the crypto they’re investing in has a solid foundation to withstand the test of time and market fluctuations.
To make this comparison clearer, let’s look at a few scenarios where each method shines:
| Scenario | Best Approach |
|---|---|
| Short-term trading during market spikes | Technical Analysis |
| Evaluating a new cryptocurrency launch | Fundamental Analysis |
| Investing for retirement | Fundamental Analysis |
| Day trading in a highly volatile market | Technical Analysis |
While technical analysis can offer quick insights and is particularly useful in fast-moving markets, it can sometimes lead to false signals. Just because a chart shows a bullish trend doesn’t guarantee that prices will continue to rise. Similarly, fundamental analysis may take longer to yield results, as it requires a comprehensive understanding of various factors influencing a cryptocurrency's value. However, it can provide a more stable basis for long-term investment decisions.
Ultimately, the choice between technical and fundamental analysis isn't about which one is better overall; it's about what suits your investment strategy. Some traders find success by combining both approaches, using technical analysis for short-term trades while relying on fundamental analysis for long-term investments. The key is to remain adaptable and informed, understanding that both methods have their strengths and weaknesses.
- Can I use both technical and fundamental analysis? Absolutely! Many successful traders blend both methods to create a more comprehensive investment strategy.
- Which analysis is better for beginners? Beginners might find fundamental analysis easier to grasp, as it focuses on understanding the value of a cryptocurrency rather than complex chart patterns.
- How do I choose which analysis to use? Consider your investment goals. If you're looking for quick gains, technical analysis might be your go-to. For long-term investments, fundamental analysis could be more beneficial.
When to Use Technical Analysis
Technical analysis is like having a crystal ball for traders, especially in the fast-paced world of cryptocurrencies. It’s a method that shines brightest during periods of high volatility, where price swings can be as dramatic as a roller coaster ride. So, when should you pull out the technical analysis playbook? Let’s break it down.
First and foremost, technical analysis is your best friend when you're dealing with short-term trades. If you’re looking to make quick profits from price fluctuations, understanding charts and indicators can provide you with the insights necessary to make informed decisions. It’s akin to watching the weather forecast before planning a picnic; you want to know when the sun will shine and when it might rain.
Moreover, technical analysis is particularly useful during market trends. When you notice a consistent upward or downward movement, technical indicators can help you determine the strength of that trend. For instance, if Bitcoin has been surging for several days, using moving averages can help you identify potential entry points to maximize gains. In contrast, if the price starts to show signs of reversal, tools like the Relative Strength Index (RSI) can alert you to overbought or oversold conditions, allowing you to adjust your strategy accordingly.
Another scenario where technical analysis excels is during periods of high trading volume. When many traders are buying and selling, price movements can become exaggerated. Here, chart patterns like flags or pennants can indicate potential breakouts, giving you a tactical advantage. Think of it as navigating through a crowded market; you need to be aware of the flow and adjust your path to avoid getting lost.
In addition, technical analysis can be quite effective in establishing support and resistance levels. These levels act like floors and ceilings for prices, and understanding where they lie can help you make educated guesses about future price action. For example, if you notice that a cryptocurrency has repeatedly bounced off a certain price point, it might indicate strong support, making it an attractive entry point for buyers.
However, it’s important to remember that while technical analysis can provide valuable insights, it’s not foolproof. It’s crucial to combine it with other forms of analysis and market research to get a well-rounded view. Just like a chef wouldn’t rely solely on one ingredient for a gourmet meal, traders should use a mix of technical and fundamental analysis to craft their strategies.
In summary, technical analysis is most effective in scenarios involving:
- Short-term trading: Ideal for quick, opportunistic trades.
- Market trends: Helps identify the direction and strength of price movements.
- High trading volume: Useful for spotting potential breakouts.
- Support and resistance levels: Aids in determining entry and exit points.
By leveraging these insights, traders can enhance their decision-making process and potentially increase their profitability in the ever-evolving crypto landscape. So, next time you’re contemplating a trade, consider reaching for those charts and indicators—they might just be the key to unlocking your trading potential.
1. What is technical analysis in cryptocurrency trading?
Technical analysis involves analyzing price movements and trading volumes using charts and indicators to forecast future price changes.
2. When is the best time to use technical analysis?
The best time to use technical analysis is during high volatility, short-term trading, and when identifying market trends and support/resistance levels.
3. Can technical analysis guarantee profits?
No analysis method can guarantee profits, but technical analysis can provide insights that help traders make informed decisions.
4. Should I combine technical analysis with other methods?
Yes! Combining technical analysis with fundamental analysis and market research can create a more comprehensive trading strategy.

When to Use Fundamental Analysis
Fundamental analysis is an essential tool for investors looking to make informed decisions in the cryptocurrency space, especially when it comes to long-term investments. Unlike technical analysis, which focuses on price movements and market trends, fundamental analysis dives deep into the underlying factors that can affect a cryptocurrency's value over time. So, when should you really consider using fundamental analysis?
Firstly, if you’re looking to invest in a cryptocurrency for the long haul, understanding its fundamentals is crucial. This means evaluating the technology behind the cryptocurrency, the team driving its development, and the overall market demand for the asset. For instance, if you're considering investing in a new blockchain project, you might want to look at:
- Technology: What makes the project unique? Is it solving a real-world problem? How does its technology compare to competitors?
- Team Expertise: Who are the people behind the project? Do they have a solid track record in the industry? Are they transparent about their goals?
- Market Trends: Is there a growing demand for the cryptocurrency? How does it fit into the current market landscape?
Furthermore, fundamental analysis is particularly valuable during market downturns. In times of high volatility, prices can swing dramatically based on market sentiment. By understanding the fundamentals, you can better assess whether a dip in price is a temporary setback or a sign of deeper issues within the project. This insight can help you avoid panic selling and instead hold onto your investment for a potential rebound.
Another scenario where fundamental analysis shines is during the launch of new projects or tokens. In these cases, hype and speculation can drive prices up, but a solid understanding of the project’s fundamentals can help you discern whether the excitement is justified. For example, if a new token is being launched but lacks a clear use case or a competent team, it might be wise to steer clear, regardless of the initial price surge.
Ultimately, fundamental analysis provides a broader perspective on the cryptocurrency market, allowing you to make decisions based on facts rather than fear or speculation. By focusing on the underlying value of a cryptocurrency, you can position yourself better for long-term success. It's like planting a seed; with the right care and understanding of the environment, that seed can grow into a flourishing tree, providing you with fruit for years to come.
Q: How do I start with fundamental analysis?
A: Begin by researching the cryptocurrency you’re interested in. Look at its whitepaper, team credentials, community engagement, and any partnerships it may have. This will give you a solid foundation to understand the project.
Q: Is fundamental analysis enough on its own?
A: While fundamental analysis is crucial for long-term investments, combining it with technical analysis can provide a more comprehensive view, especially for short-term trading strategies.
Q: What are some red flags to watch for in fundamental analysis?
A: Watch out for projects with unclear roadmaps, teams with no prior experience, or those that lack transparency about their operations. These can be indicators of potential issues down the line.
Frequently Asked Questions
- What is the main difference between technical analysis and fundamental analysis?
Technical analysis focuses on price movements and trading volumes, using charts and indicators to predict future price changes. In contrast, fundamental analysis evaluates the underlying value of a cryptocurrency by examining factors such as technology, team expertise, and market demand.
- When should I use technical analysis?
Technical analysis is particularly useful in volatile markets where price movements can be rapid and unpredictable. Traders often rely on technical analysis to make quick decisions based on trends and patterns observed in charts.
- Is fundamental analysis better for long-term investments?
Yes, fundamental analysis is generally more suited for long-term investments. By understanding the fundamental aspects of a cryptocurrency, such as its technology and market potential, investors can make informed decisions that align with their long-term goals.
- What tools are commonly used in technical analysis?
Some popular tools in technical analysis include moving averages, Relative Strength Index (RSI), MACD, and Bollinger Bands. These tools help traders analyze price trends, market conditions, and potential entry or exit points.
- Can I use both technical and fundamental analysis together?
Absolutely! Many traders and investors find that using both approaches provides a more comprehensive view of the market. By combining insights from technical analysis with the fundamental strengths of a cryptocurrency, you can make more balanced investment decisions.
- What are some common chart patterns to look for in technical analysis?
Common chart patterns include head and shoulders, triangles, and flags. These patterns can indicate potential price movements and help traders gauge market sentiment.
- How do I know which analysis to use for a specific cryptocurrency?
The choice between technical and fundamental analysis often depends on your investment strategy and goals. If you're looking for short-term trades, technical analysis might be your best bet. For long-term investments, fundamental analysis is generally more effective.

