How to Use Moving Averages for Trend Confirmation
In the world of trading, understanding market trends is crucial for making informed decisions. One of the most effective tools at a trader's disposal is the moving average. This powerful indicator helps in smoothing out price data, allowing traders to filter out the noise of short-term fluctuations and focus on the underlying trend. But how exactly do you use moving averages for trend confirmation? Let's dive deeper into this essential trading concept.
Moving averages are like a compass in the tumultuous sea of market prices. They provide a clearer picture of where the market is heading by averaging out price data over a specified period. By doing so, they help traders to identify whether the market is in an uptrend, downtrend, or moving sideways. Imagine trying to find your way through a dense fog; moving averages cut through that fog, helping you to see the path ahead more clearly.
There are several types of moving averages, each with its unique characteristics and applications. The most common types include:
- Simple Moving Average (SMA)
- Exponential Moving Average (EMA)
- Weighted Moving Average (WMA)
Each type serves a different purpose in trend analysis, and understanding their differences is key to using them effectively in your trading strategy.
The Simple Moving Average is the most straightforward type of moving average. It calculates the average price over a specific number of periods, providing a general view of the market's direction. Think of the SMA as a gentle breeze that helps to guide your sailboat; it’s steady and reliable, though it may not be the fastest way to catch the wind.
To calculate the SMA, you simply sum the closing prices over a specified period and divide by the number of periods. For example, if you want a 10-day SMA, you would add the closing prices of the last 10 days and divide by 10. This method gives you a clear view of the average price movement, allowing you to make informed decisions based on historical data.
While the SMA is a useful tool, it does come with its limitations. One major drawback is that it can lag behind current price action, making it less responsive to sudden market changes. This lag can lead to missed opportunities if traders rely solely on the SMA. It’s important to be aware of this limitation and consider using other indicators in conjunction with the SMA for a more complete picture.
The Exponential Moving Average takes things a step further by giving more weight to recent prices. This feature makes the EMA more responsive to new information, allowing traders to react quickly to market changes. If you think of the SMA as a calm lake, the EMA is like a rushing river; it adapts to changes more swiftly, providing timely signals that can be crucial for trading decisions.
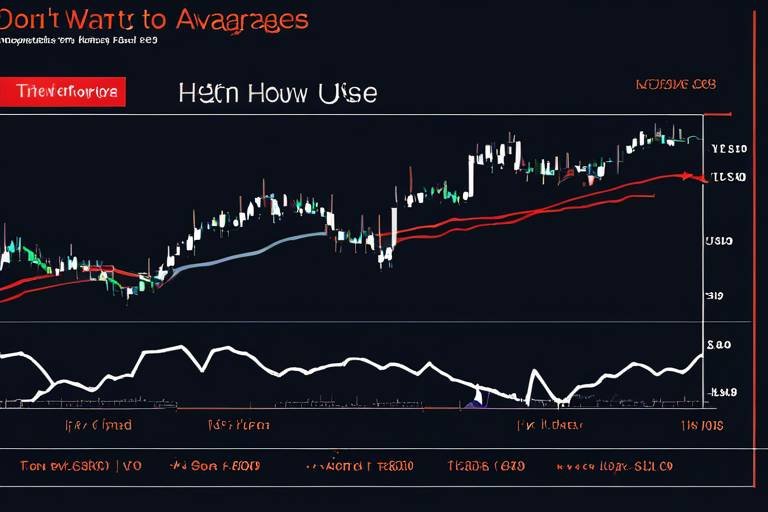
So, how can moving averages help confirm trends? The key lies in their relationship with price movements. When the price is above the moving average line, it typically indicates an uptrend, while a price below the moving average suggests a downtrend. This relationship provides valuable insights for traders, helping them to align their trades with the prevailing market direction.
One of the most popular methods for using moving averages is through crossovers. A crossover occurs when a shorter-term moving average crosses above or below a longer-term moving average. For example, if a short-term EMA crosses above a long-term SMA, it may signal the beginning of a bullish trend. Conversely, if the short-term EMA crosses below the long-term SMA, it could indicate a bearish trend. These crossovers serve as powerful signals for traders looking to enter or exit positions.
For enhanced accuracy, many traders choose to combine moving averages with other technical indicators. This approach can provide a more comprehensive view of market conditions and potential trading opportunities. For instance, using moving averages alongside the Relative Strength Index (RSI) can help confirm whether a trend is overbought or oversold, providing additional context for trading decisions.
Q: What is the best type of moving average for beginners?
A: The Simple Moving Average (SMA) is often recommended for beginners due to its straightforward calculation and clear representation of trends.
Q: How do I choose the right period for my moving average?
A: The choice of period depends on your trading strategy. Shorter periods (like 10 or 20 days) are more responsive but may be noisier, while longer periods (like 50 or 200 days) provide a smoother trend but can lag behind.
Q: Can moving averages be used in all markets?
A: Yes, moving averages can be applied in various markets, including stocks, forex, and commodities, making them versatile tools for traders.

Understanding Moving Averages
This article explores the concept of moving averages, their types, and how they can be effectively utilized for confirming market trends in trading strategies.
Moving averages are essential tools in the world of trading, serving as a compass that helps navigate the often turbulent seas of market fluctuations. They are designed to smooth out price data over a specified period, allowing traders to identify underlying trends more clearly. Imagine trying to read a book while standing on a busy street; the noise and distractions make it nearly impossible. Similarly, price fluctuations can create noise that obscures the true market direction. Moving averages act like a pair of reading glasses, filtering out that noise and focusing on the essential narrative of price movements.
At their core, moving averages help traders determine whether a market is trending upward, downward, or sideways. By analyzing the relationship between the price and the moving average, traders can gain valuable insights into market sentiment. For instance, when the price is consistently above the moving average, it often indicates a bullish trend, while prices below the moving average may signal bearish conditions. This relationship is crucial for making informed trading decisions and can significantly enhance a trader's strategy.
To further clarify how moving averages function, consider the following key points:
- Smoothing Effect: They reduce the impact of short-term fluctuations, providing a clearer picture of long-term trends.
- Time Frames: Moving averages can be calculated over various time frames, from minutes to months, allowing traders to tailor their analysis to their specific trading style.
- Trend Confirmation: They serve as dynamic support and resistance levels, helping to confirm trends and potential reversal points.
In essence, moving averages are like the heartbeat of the market, pulsating with the rhythm of price action. They give traders a reliable way to gauge market momentum and make more informed decisions. However, while they are incredibly useful, it’s important to remember that moving averages are lagging indicators. They rely on past price data, which means they can sometimes react slowly to sudden market changes. This is why understanding the nuances of different types of moving averages is vital for any trader looking to enhance their market analysis.
There are several types of moving averages, including simple, exponential, and weighted. Each type has its unique characteristics and applications in trend analysis.
The Simple Moving Average calculates the average price over a specific number of periods. It is straightforward and widely used for identifying general trends in the market.
To calculate the SMA, sum the closing prices over a specified period and divide by the number of periods. This method provides a clear view of the average price movement.
While the SMA is useful, it can lag behind current price action, making it less responsive to sudden market changes. Traders should be aware of this limitation.
The Exponential Moving Average gives more weight to recent prices, making it more responsive to new information. This feature allows traders to react more quickly to market changes.
Moving averages can help confirm trends by indicating whether the price is above or below the moving average line. This relationship provides valuable insights for traders.
Crossovers between different moving averages can signal potential trend changes. For example, a short-term EMA crossing above a long-term SMA may indicate a bullish trend.
For enhanced accuracy, traders often combine moving averages with other technical indicators. This approach can provide a more comprehensive view of market conditions and potential trading opportunities.
What is a moving average?
A moving average is a statistical calculation used to analyze data over a specific time period, smoothing out fluctuations to identify trends.
How do I choose the right moving average?
The choice depends on your trading strategy: short-term traders might prefer shorter periods, while long-term traders may opt for longer periods.
Can moving averages predict future prices?
While moving averages can indicate trends, they are lagging indicators and should be used in conjunction with other analysis tools for better predictions.

Types of Moving Averages
When diving into the world of trading, understanding the different is crucial for any trader looking to enhance their strategies. Each type of moving average offers unique insights into price trends, and knowing when to use them can significantly impact your trading decisions. The three primary types of moving averages are the Simple Moving Average (SMA), the Exponential Moving Average (EMA), and the Weighted Moving Average (WMA). Let’s break them down one by one.
The Simple Moving Average is perhaps the most straightforward of the moving averages. It calculates the average price of an asset over a specific number of periods, providing a clear and easy-to-understand view of price trends. For instance, if you’re looking at a 10-day SMA, you would sum up the closing prices of the last 10 days and then divide that number by 10. This method smooths out fluctuations and helps traders spot the overall direction of the market.
However, while the SMA is beneficial for identifying trends, it does have its downsides. One major limitation is that it tends to lag behind current price action. This lag can cause traders to miss out on critical market movements, especially in fast-paced environments. Therefore, it's essential to use the SMA in conjunction with other indicators for better decision-making.
The Exponential Moving Average, on the other hand, takes a different approach. Unlike the SMA, the EMA gives more weight to recent prices, making it more responsive to new information. This characteristic allows traders to react more swiftly to market changes, which can be particularly advantageous in volatile conditions. For instance, if the price of an asset suddenly spikes, the EMA will reflect this change faster than the SMA. This responsiveness can be crucial for traders looking to capitalize on short-term price movements.
Lastly, we have the Weighted Moving Average. This type of moving average assigns varying degrees of importance to each data point in the period being analyzed. In essence, it allows traders to emphasize more recent prices while still considering older data. The WMA is particularly useful when traders want to create a more nuanced view of price trends without being overly reactive to short-term fluctuations.
To summarize the differences between these moving averages, here's a quick comparison table:
| Type | Weighting | Responsiveness | Best Used For |
|---|---|---|---|
| Simple Moving Average (SMA) | Equal weight | Low | Long-term trend analysis |
| Exponential Moving Average (EMA) | More weight to recent prices | High | Short-term trading |
| Weighted Moving Average (WMA) | Variable weight | Moderate | Balanced trend analysis |
In conclusion, understanding the types of moving averages and their respective advantages is essential for any trader. Each type serves a different purpose and can provide valuable insights when used correctly. Whether you're a novice just starting out or a seasoned trader looking to refine your strategies, incorporating moving averages into your analysis can help you make more informed decisions.
Q: What is the main difference between SMA and EMA?
A: The primary difference lies in how they calculate the average. The SMA gives equal weight to all prices in the period, while the EMA gives more weight to recent prices, making it more responsive to current market conditions.
Q: Can I use moving averages for all types of trading?
A: Yes, moving averages can be applied to various trading strategies, but their effectiveness may vary depending on market conditions and the time frame you are analyzing.

Simple Moving Average (SMA)
The is one of the most fundamental tools in technical analysis, widely embraced by traders for its simplicity and effectiveness. Essentially, the SMA is calculated by taking the average of a set number of closing prices over a defined period. For example, if you're looking at a 10-day SMA, you would add up the closing prices of the last ten days and then divide that sum by ten. This straightforward approach helps traders to smooth out price fluctuations and get a clearer picture of the market's direction.
One of the main reasons traders favor the SMA is its ability to filter out the noise that often clouds day-to-day price movements. Think of it like looking out over a landscape through a pair of binoculars; the SMA helps you focus on the broader view, rather than getting lost in the details of every little bump in the road. However, while the SMA is a powerful tool, it does come with its own set of limitations.
For instance, because the SMA is based on past prices, it can often lag behind current market conditions. This lag can make it less effective in rapidly changing environments where price shifts occur suddenly. Traders need to be cautious and consider this aspect, especially when making quick decisions based on market trends. In fact, many seasoned traders recommend using the SMA in conjunction with other indicators to enhance its reliability.
To illustrate how the SMA works, let's take a look at a simple example:
| Day | Closing Price | 10-Day SMA |
|---|---|---|
| 1 | $10 | - |
| 2 | $11 | - |
| 3 | $12 | - |
| 4 | $13 | - |
| 5 | $14 | - |
| 6 | $15 | - |
| 7 | $16 | - |
| 8 | $17 | - |
| 9 | $18 | - |
| 10 | $19 | $14.5 |
In this table, you can see how the SMA is calculated after 10 days. On the 10th day, the average of the previous nine days is computed, giving traders a reliable reference point for analyzing price movements.
In summary, while the Simple Moving Average is a powerful tool for identifying trends, traders should be mindful of its limitations and consider integrating it with other technical indicators. This combination can lead to more informed trading decisions and a better understanding of market dynamics.

Calculating SMA
Calculating the Simple Moving Average (SMA) is a straightforward process that can provide traders with a clear picture of price trends over a specified period. To compute the SMA, you need to follow a few simple steps:
- Select a Time Frame: Determine the number of periods you want to analyze. Common choices include 10, 20, 50, or 200 periods, depending on whether you’re looking at short-term or long-term trends.
- Gather Closing Prices: Collect the closing prices of the asset for the selected time frame. For example, if you are calculating a 10-day SMA, you would need the closing prices for the last 10 days.
- Sum the Prices: Add together all the closing prices you've collected. This sum gives you the total price over the specified period.
- Divide by the Number of Periods: Finally, take the total sum of the closing prices and divide it by the number of periods you selected. This calculation gives you the SMA.
For instance, let’s say you want to calculate a 5-day SMA for a stock with the following closing prices:
| Day | Closing Price |
|---|---|
| 1 | $20 |
| 2 | $22 |
| 3 | $21 |
| 4 | $23 |
| 5 | $24 |
In this example, the SMA calculation would be:
Sum of closing prices  20 + 22 + 21 + 23 + 24  110
SMA  Total Sum / Number of Periods
SMA  110 / 5  22
Thus, the 5-day SMA for this stock would be $22. This average can help traders identify whether the price is trending upward or downward over the given period. However, keep in mind that while the SMA is a valuable tool, its lagging nature means it may not react swiftly to sudden price changes. Therefore, it’s crucial to combine it with other indicators for better trading decisions.
What is the main purpose of using SMA in trading?
The main purpose of using SMA is to smooth out price data to identify trends over a specific time frame, helping traders make informed decisions based on historical price movements.
How often should I recalculate the SMA?
You should recalculate the SMA at the end of each period you are analyzing (daily, weekly, etc.) to ensure that you are using the most current data available.
Can I use SMA for all types of assets?
Yes, SMA can be applied to various assets, including stocks, currencies, and commodities. However, the effectiveness may vary based on market conditions and the specific asset being analyzed.

Limitations of SMA
This article explores the concept of moving averages, their types, and how they can be effectively utilized for confirming market trends in trading strategies.
Moving averages smooth out price data to identify trends over specific periods. They help traders filter out market noise and focus on the underlying direction of price movements.
There are several types of moving averages, including simple, exponential, and weighted. Each type has its unique characteristics and applications in trend analysis.
The Simple Moving Average calculates the average price over a specific number of periods. It is straightforward and widely used for identifying general trends in the market.
To calculate the SMA, sum the closing prices over a specified period and divide by the number of periods. This method provides a clear view of the average price movement.
While the SMA is a popular tool among traders, it comes with its own set of limitations that can impact its effectiveness. One of the main drawbacks is that the SMA is inherently lagging. This means it reacts to price changes only after they have occurred, which can lead to missed opportunities in fast-moving markets. For instance, if a sudden price spike happens, the SMA may take several periods to reflect this change, causing traders to make decisions based on outdated information.
Another limitation of the SMA is its inability to adapt to market volatility. In periods of high volatility, the SMA can provide misleading signals, as it may not accurately represent the current market sentiment. This can result in traders entering or exiting positions at less than optimal times.
Moreover, the SMA is less effective in identifying short-term trends. Traders who rely solely on the SMA may find themselves at a disadvantage, especially in a rapidly changing market environment. To illustrate this point, consider the following table that summarizes the key limitations of the SMA:
| Limitation | Description |
|---|---|
| Lagging Indicator | Reacts to price changes after they occur, causing potential missed opportunities. |
| Inability to Adapt | Fails to accurately reflect market sentiment during periods of high volatility. |
| Short-term Trends | Less effective in identifying quick shifts in market direction. |
Lastly, traders should also be cautious about relying too heavily on the SMA without considering other indicators. Combining the SMA with other tools can help mitigate its limitations and provide a more comprehensive view of market trends.
The Exponential Moving Average gives more weight to recent prices, making it more responsive to new information. This feature allows traders to react more quickly to market changes.
Moving averages can help confirm trends by indicating whether the price is above or below the moving average line. This relationship provides valuable insights for traders.
Crossovers between different moving averages can signal potential trend changes. For example, a short-term EMA crossing above a long-term SMA may indicate a bullish trend.
For enhanced accuracy, traders often combine moving averages with other technical indicators. This approach can provide a more comprehensive view of market conditions and potential trading opportunities.
- What is the best moving average for day trading? The Exponential Moving Average (EMA) is often preferred for day trading due to its responsiveness to recent price changes.
- Can moving averages predict future prices? While moving averages can help identify trends, they do not predict future prices with certainty. They should be used in conjunction with other indicators.
- How do I choose the right period for a moving average? The choice of period depends on your trading strategy; shorter periods (like 10 or 20 days) are better for short-term trading, while longer periods (like 50 or 200 days) are suitable for long-term trends.

Exponential Moving Average (EMA)
The is a powerful tool in the world of trading that gives more significance to recent price data, making it a favorite among traders who want to react swiftly to market movements. Unlike its counterpart, the Simple Moving Average (SMA), which treats all data points equally, the EMA places greater weight on the most current prices. This characteristic enables the EMA to respond more effectively to price changes, providing a clearer picture of the current trend.
To understand the mechanics behind the EMA, let’s break it down a bit further. The calculation involves a specific formula that factors in the previous EMA value, the current price, and a smoothing factor. This smoothing factor is derived from the number of periods you choose to analyze. For example, a 10-day EMA will react more quickly to price changes than a 50-day EMA. Traders often prefer shorter EMAs for their sensitivity, allowing them to catch potential trend reversals sooner.
Here’s a quick look at the formula:
EMA  (Current Price x Multiplier) + (Previous EMA x (1 - Multiplier))
Multiplier  2 / (N + 1)
Where N is the number of periods. This formula showcases how the EMA not only considers the latest price but also incorporates the previous EMA, creating a dynamic and responsive indicator.
One of the most compelling aspects of the EMA is its effectiveness in identifying trends. When the price is above the EMA, it often indicates a bullish trend, while prices below the EMA suggest a bearish trend. This clear visual representation helps traders make informed decisions. For instance, if you're looking at a stock chart and notice that the price has consistently stayed above the 20-day EMA, that could signal a strong upward trend.
Moreover, the EMA is often used in conjunction with other indicators to enhance trading strategies. For example, traders might look for crossovers between the EMA and other moving averages, such as the SMA, to confirm potential buy or sell signals. When a short-term EMA crosses above a long-term EMA, it can indicate a buying opportunity, while the opposite crossover might suggest it's time to sell.
However, while the EMA is a fantastic tool, it’s essential to remember that no indicator is foolproof. Market conditions can change rapidly, and relying solely on the EMA without considering other factors can lead to false signals. Therefore, it’s wise to combine the EMA with other technical indicators and fundamental analysis for a more comprehensive trading strategy.
- What is the main advantage of using EMA over SMA? The EMA reacts more quickly to price changes because it gives more weight to recent prices, making it more responsive in volatile markets.
- How do I choose the period for my EMA? The choice of period depends on your trading strategy. Shorter periods (like 10 or 20 days) are better for day trading, while longer periods (like 50 or 200 days) are typically used for long-term trends.
- Can I use EMA for all types of markets? Yes! The EMA can be applied to any market, including stocks, forex, and commodities, making it a versatile tool for traders.
- What should I combine with EMA for better results? Combining EMA with other indicators like the Relative Strength Index (RSI) or MACD can provide more reliable trading signals and help confirm trends.

Using Moving Averages for Trend Confirmation
When it comes to trading, understanding market trends is crucial. Moving averages serve as one of the most effective tools in a trader's arsenal for confirming these trends. By analyzing the relationship between the price and the moving average line, traders can gain valuable insights into market direction. Essentially, if the price is consistently above the moving average, it indicates a bullish trend, while prices below the moving average suggest a bearish trend. This simple yet powerful concept can significantly enhance your trading strategy.
Imagine you're on a road trip, and the moving average is like your GPS. It helps you navigate through the twists and turns of the market, filtering out the noise and showing you the most direct route to your destination. In this context, the destination is a profitable trade, and the road is the fluctuating price movements. By keeping an eye on your moving average, you can make informed decisions about when to enter or exit a trade.
One of the most exciting aspects of moving averages is their ability to generate signals through crossovers. A crossover occurs when a shorter-term moving average crosses above or below a longer-term moving average. For instance, if a 10-day EMA crosses above a 50-day SMA, it can signal a potential bullish trend, prompting traders to consider entering a position. Conversely, if the 10-day EMA crosses below the 50-day SMA, it may indicate a bearish trend, suggesting it's time to exit or short the market.
However, relying solely on moving averages might not be enough for every trader. To enhance the accuracy of trend confirmation, many traders choose to combine moving averages with other technical indicators. For example, pairing moving averages with Relative Strength Index (RSI) or MACD can provide a more comprehensive view of market conditions. This combination allows traders to confirm trends and identify potential reversals, making their trading strategies more robust.
Here's a quick overview of how moving averages can be integrated with other indicators:
| Indicator | Purpose |
|---|---|
| Relative Strength Index (RSI) | Measures the speed and change of price movements to identify overbought or oversold conditions. |
| Moving Average Convergence Divergence (MACD) | Shows the relationship between two moving averages of a security's price, helping to identify momentum and trend changes. |
In conclusion, moving averages are a vital component of any trader's toolkit for trend confirmation. They not only help in identifying the direction of the market but also provide crucial signals for making timely trading decisions. By understanding how to effectively use moving averages alongside other indicators, traders can navigate the complex landscape of financial markets with greater confidence.
- What is the best type of moving average to use? The best type of moving average depends on your trading style. For quick trades, the EMA might be more suitable, while long-term investors often prefer the SMA.
- How can I avoid false signals from moving averages? To reduce false signals, consider combining moving averages with other indicators like RSI or MACD for confirmation.
- Can moving averages be used in all markets? Yes, moving averages can be applied in various markets, including stocks, forex, and commodities.

Crossovers as Signals
When it comes to trading, crossovers are a powerful signal that can indicate potential changes in market trends. Imagine you're sailing on a boat; when the wind shifts direction, you adjust your sails accordingly. Similarly, in trading, crossovers help you adjust your strategy based on the market's direction. A crossover occurs when a shorter-term moving average crosses above or below a longer-term moving average, signaling a shift in momentum.
For instance, consider the scenario where the Exponential Moving Average (EMA) of 10 days crosses above the Simple Moving Average (SMA) of 50 days. This situation is often interpreted as a bullish signal, suggesting that it might be a good time to enter a long position. Conversely, if the 10-day EMA crosses below the 50-day SMA, it can indicate a bearish trend, signaling that it might be time to sell or short the asset. This dynamic interplay between moving averages can be likened to a dance, where each step taken informs the next move in the trading strategy.
To illustrate this concept further, let’s take a look at a simple table that outlines the implications of different crossover scenarios:
| Crossover Type | Signal | Action |
|---|---|---|
| Short-term EMA crosses above Long-term SMA | Bullish | Consider buying |
| Short-term EMA crosses below Long-term SMA | Bearish | Consider selling |
However, it's essential to remember that crossovers are not foolproof indicators. They can sometimes produce false signals, especially in volatile markets. This is where the importance of context comes into play. Traders should look at other indicators, such as volume or momentum oscillators, to confirm the signals generated by moving average crossovers. Think of it as a detective gathering evidence; the more clues you have, the better your chances of solving the case!
In conclusion, crossovers serve as vital signals in the world of trading, guiding traders to make informed decisions. By understanding these signals and combining them with other technical indicators, traders can enhance their strategies and improve their chances of success. So, the next time you analyze moving averages, pay close attention to those crossovers—they just might lead you to profitable opportunities!
- What is a moving average? A moving average is a statistical calculation used to analyze data over a specific period, smoothing out price fluctuations to identify trends.
- How do I choose the right moving average? The choice of moving average depends on your trading strategy. Shorter moving averages react quickly to price changes, while longer ones provide a broader view of the trend.
- Can moving averages be used in all markets? Yes, moving averages can be applied in various markets, including stocks, forex, and commodities.
- What are the risks of using moving averages? The main risk is relying solely on them without considering other market factors, as they can lag behind current price movements.

Combining Moving Averages with Other Indicators
When it comes to trading, relying solely on moving averages can sometimes feel like navigating a ship without a compass. While they provide a solid foundation for understanding market trends, their effectiveness can be significantly enhanced when combined with other technical indicators. Think of moving averages as the backbone of your trading strategy, while other indicators serve as the muscles that provide strength and flexibility.
One popular approach is to pair moving averages with momentum indicators, such as the Relative Strength Index (RSI) or the Moving Average Convergence Divergence (MACD). These indicators can help traders gauge whether a trend is gaining strength or losing momentum. For instance, if the price is above the moving average and the RSI is above 70, it might indicate that the market is overbought, suggesting a potential reversal. Conversely, if both the price and the RSI are below their respective moving averages, it could signal a bearish trend.
Another effective combination involves using moving averages alongside volume indicators. Volume serves as a confirmation tool; when price movements coincide with increasing volume, it adds credibility to the trend. For example, if a short-term EMA crosses above a long-term SMA and is accompanied by a surge in trading volume, this could be a strong buy signal. On the other hand, if the crossover occurs with low volume, traders might want to exercise caution.
Moreover, utilizing candlestick patterns along with moving averages can provide deeper insights into market sentiment. For instance, if a bullish candlestick pattern forms near a moving average support level, it could indicate a strong buying opportunity. Conversely, bearish patterns near resistance levels can signify potential sell signals. The combination of these elements creates a more robust trading strategy, enabling traders to make informed decisions based on multiple data points.
In summary, combining moving averages with other indicators not only enhances the reliability of your trading signals but also equips you with a more comprehensive view of market conditions. By integrating momentum, volume, and candlestick analysis, traders can navigate the complex waters of the financial markets with greater confidence and precision.
- What is the main advantage of combining moving averages with other indicators?
Combining moving averages with other indicators increases the reliability of trading signals and provides a more comprehensive understanding of market conditions.
- Can I use any indicators with moving averages?
While you can technically use any indicators, it’s best to choose those that complement moving averages, such as momentum or volume indicators, to enhance your analysis.
- How do I know which indicators to combine with moving averages?
Experimenting with different combinations and analyzing historical data can help you identify which indicators work best for your trading strategy.
Frequently Asked Questions
- What are moving averages and why are they important?
Moving averages are statistical calculations used to analyze data points by creating averages over a specific period. They are crucial in trading as they help smooth out price action, making it easier to identify trends and eliminate market noise. By using moving averages, traders can better understand the underlying direction of price movements.
- What is the difference between Simple Moving Average (SMA) and Exponential Moving Average (EMA)?
The main difference lies in how they weight the data. The SMA gives equal weight to all prices over the specified period, making it slower to respond to recent price changes. In contrast, the EMA places more emphasis on recent prices, allowing it to react more quickly to new information and market shifts. This responsiveness makes the EMA a popular choice for many traders.
- How can I calculate the Simple Moving Average (SMA)?
To calculate the SMA, you simply add up the closing prices over a chosen number of periods and then divide that sum by the number of periods. For example, if you want a 5-day SMA, you would sum the closing prices of the last five days and divide by 5. This calculation provides a clear average that helps visualize the price trend over time.
- What are the limitations of using the Simple Moving Average (SMA)?
While the SMA is a helpful tool, it does have its limitations. One significant drawback is its lagging nature; since it averages past prices, it can be slow to respond to sudden market changes. This lag may result in missed opportunities or delayed reactions to market trends, which traders should keep in mind when utilizing the SMA.
- How can moving averages confirm trends in trading?
Moving averages can confirm trends by showing whether the price is above or below the moving average line. If the price is consistently above the moving average, it typically indicates a bullish trend, while a price consistently below suggests a bearish trend. This relationship provides valuable insights for traders to make informed decisions.
- What are crossovers and how do they signal potential trend changes?
Crossovers occur when a shorter-term moving average crosses above or below a longer-term moving average. For instance, if a short-term EMA crosses above a long-term SMA, it may signal a bullish trend, while the opposite crossover could indicate a bearish trend. These signals can be powerful indicators for traders looking to capitalize on potential market shifts.
- Can I combine moving averages with other indicators?
Absolutely! Many traders enhance their strategies by combining moving averages with other technical indicators, such as Relative Strength Index (RSI) or MACD. This combination can provide a more comprehensive view of market conditions, helping traders confirm signals and make more informed decisions. It's like having a trusty sidekick to help you navigate the trading landscape!

