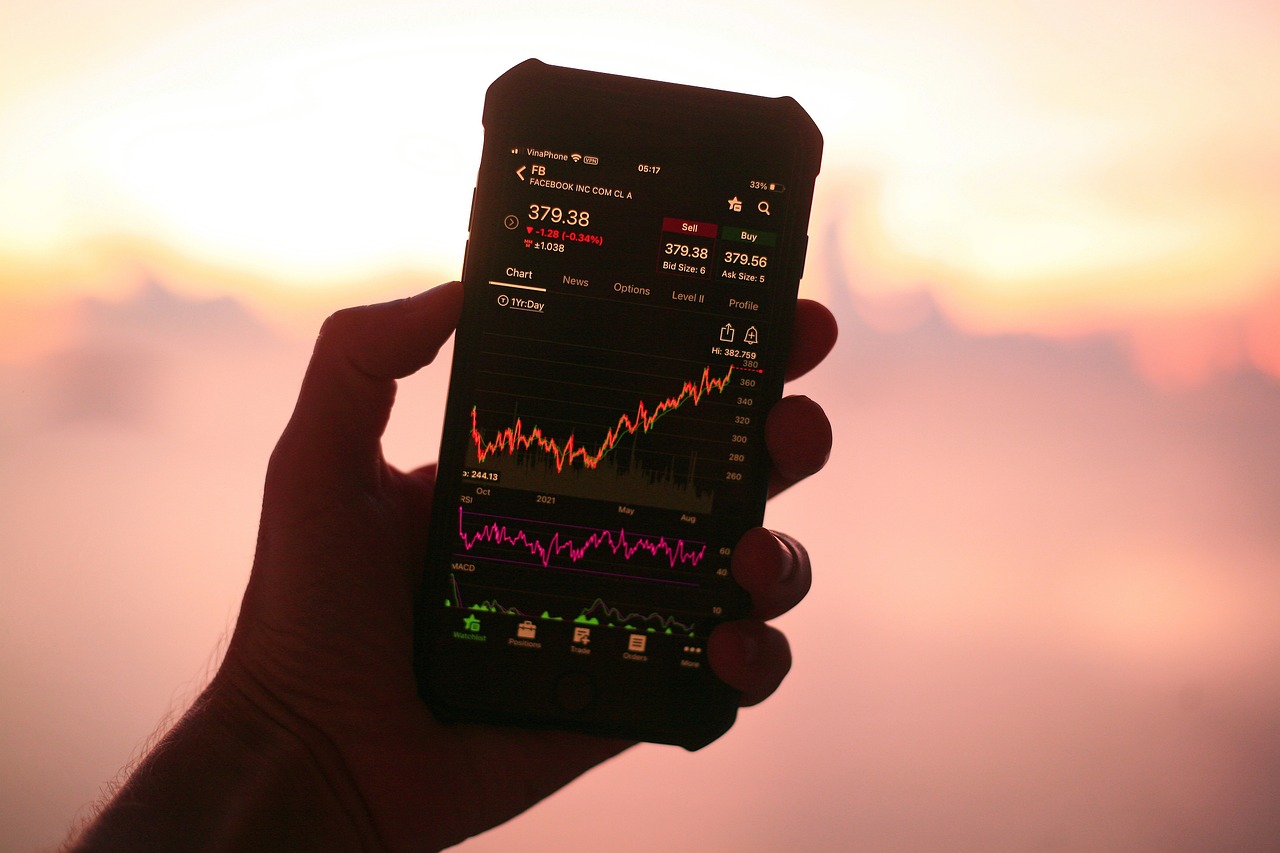
How to Integrate Technical Analysis with Trading Bots
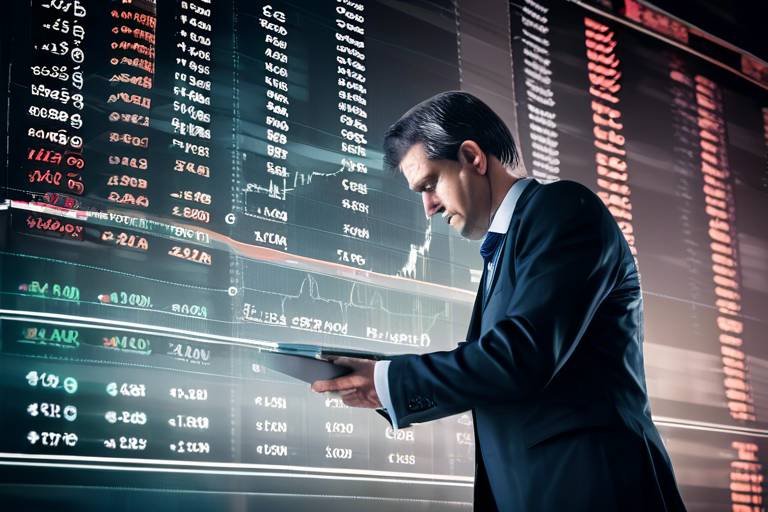
Have you ever wondered how some traders seem to have an edge over the market? What if I told you that the secret often lies in the seamless integration of technical analysis with trading bots? This powerful combination can transform your trading strategy from a mere guesswork to a well-informed decision-making process. In this article, we will explore how to effectively merge these two elements, enhancing your trading efficiency and boosting your potential for profit.
First off, let's break down what we mean by technical analysis. It’s not just a fancy term thrown around in trading circles; it’s a systematic method of evaluating securities by analyzing statistics generated by market activity. This includes price movements, trading volume, and historical data. By understanding patterns and trends, traders can make predictions about future price movements. Imagine having a crystal ball that doesn’t just show you the future but also provides you with the tools to act on it! That’s the essence of technical analysis.
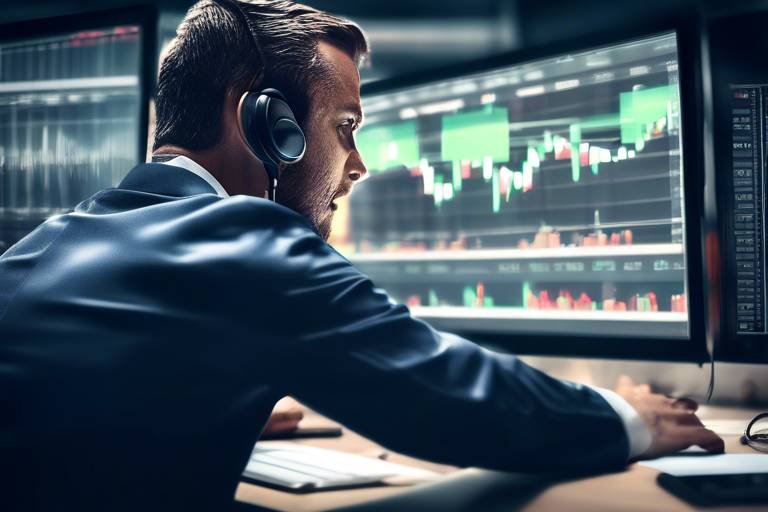
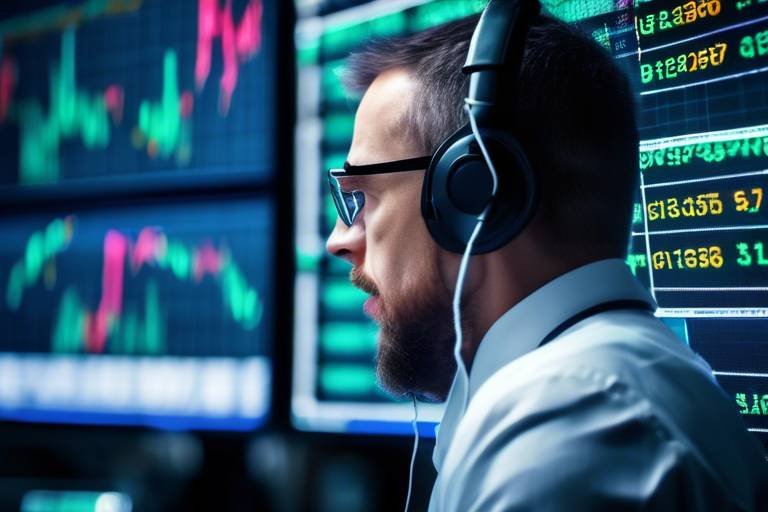
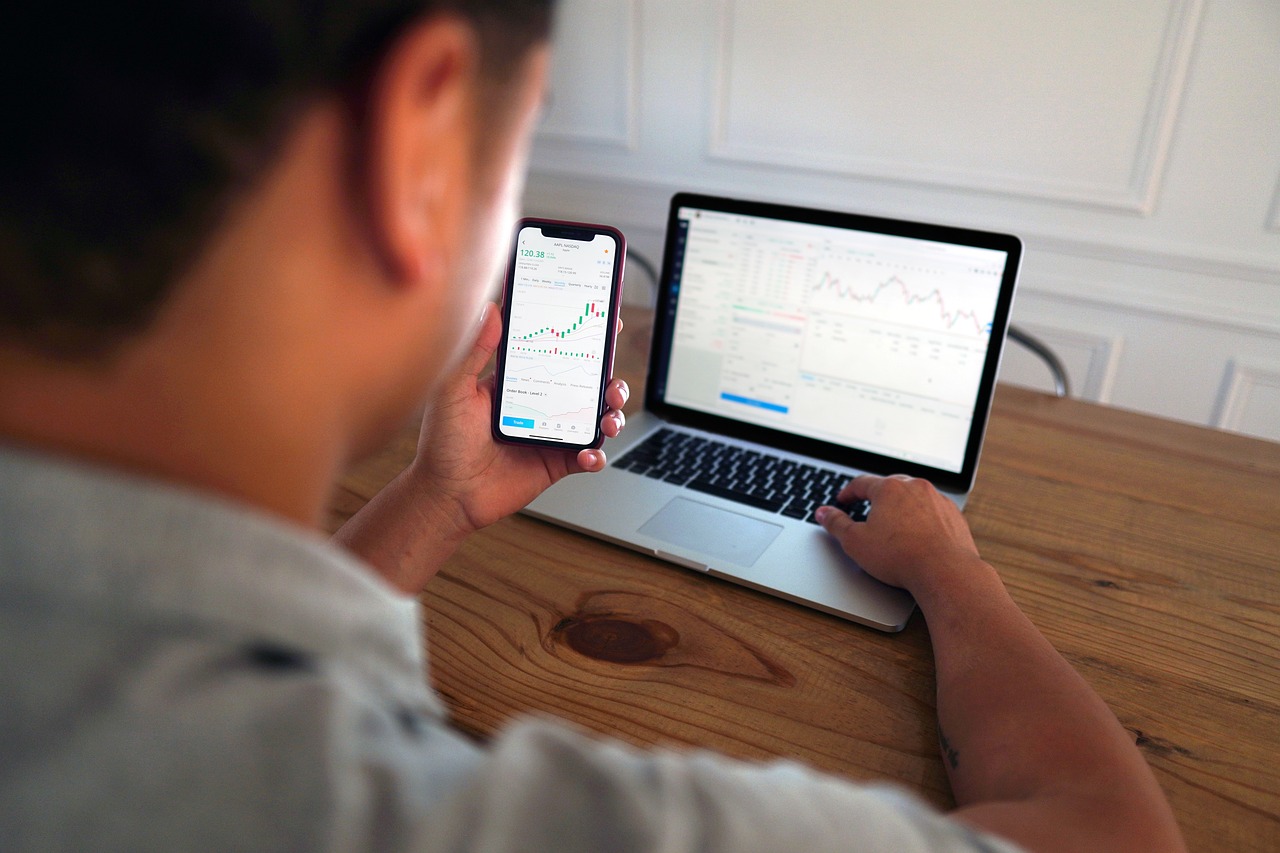
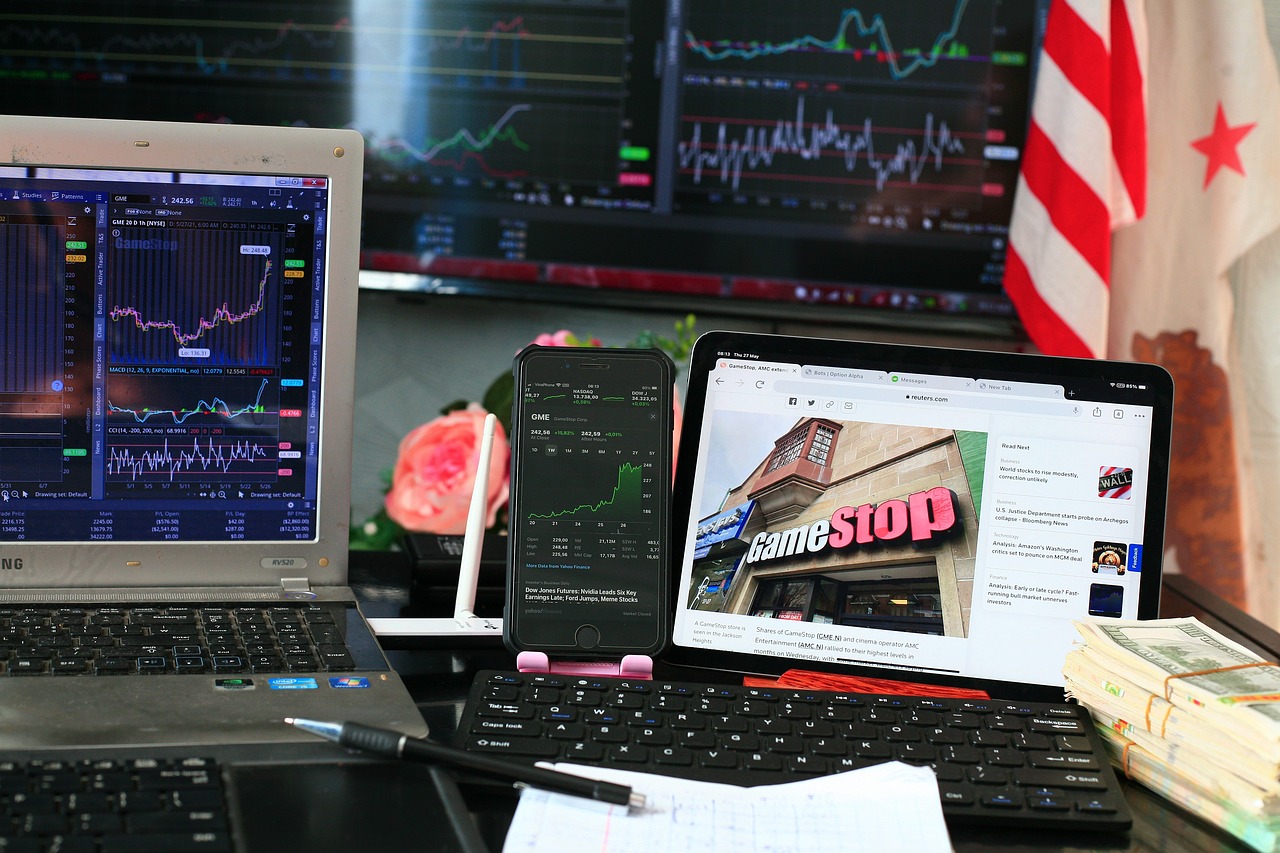
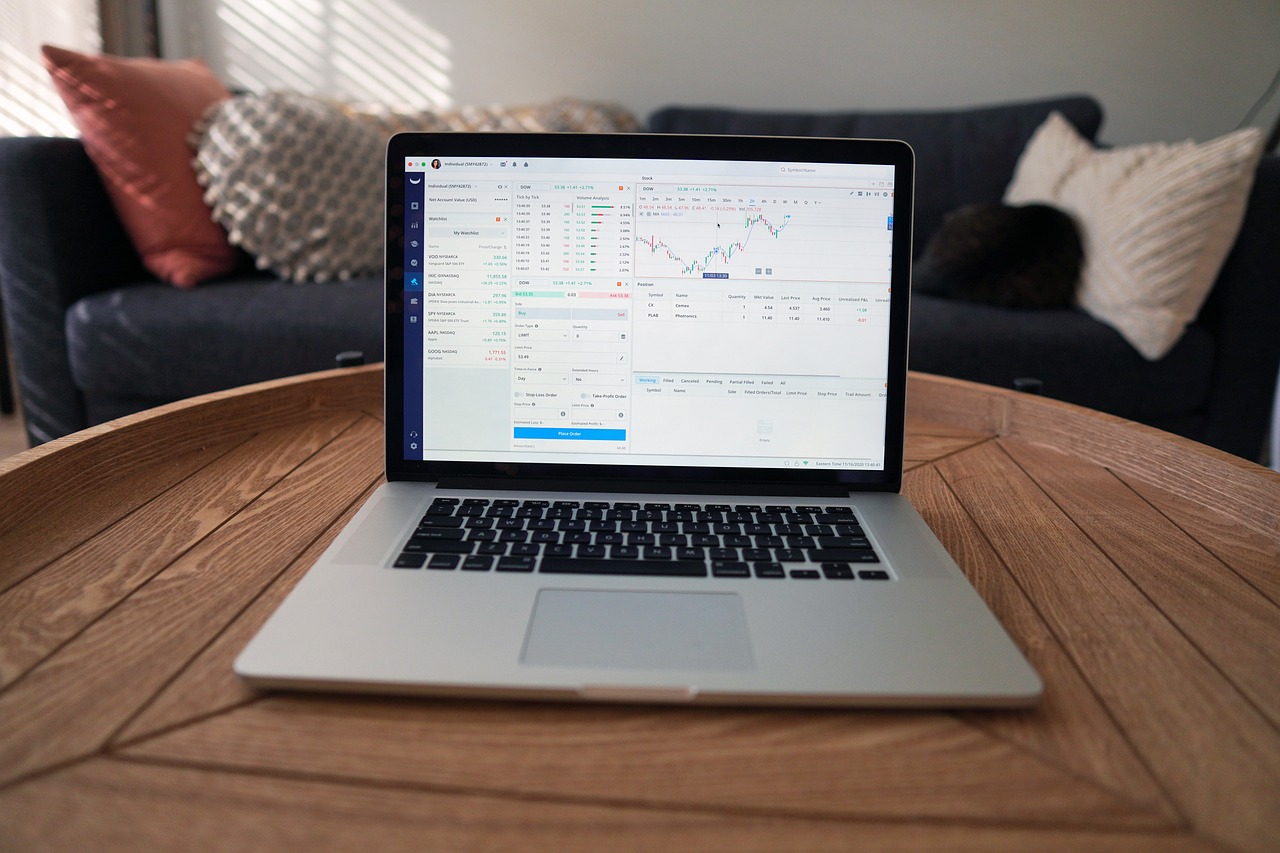
Now, let’s talk about trading bots. These are automated software programs designed to execute trades based on predefined criteria. Think of them as your personal trading assistants, tirelessly working around the clock to find opportunities in the market while you sleep. The beauty of trading bots lies in their ability to analyze vast amounts of data far quicker than any human could. They can execute trades in milliseconds, ensuring you never miss out on a potential profit. But the real magic happens when you combine the analytical prowess of technical analysis with the speed and efficiency of trading bots.
So, how do you go about integrating these two powerful tools? The first step is to ensure that your trading bot is programmed to utilize various technical indicators. These indicators can range from simple moving averages to more complex oscillators like the Relative Strength Index (RSI). By feeding your bot with these indicators, you enable it to make informed trading decisions based on real-time data. For instance, if the RSI indicates that a stock is oversold, your trading bot can automatically place a buy order, capitalizing on the potential for a price rebound.
Moreover, it’s essential to backtest your strategies to ensure they perform well under various market conditions. Backtesting involves running your trading bot with historical data to see how it would have performed in the past. This process is crucial for refining your strategies and boosting your bot’s performance. Think of it as a rehearsal before the big show—ensuring everything runs smoothly when it’s time to perform live.
As you can see, the integration of technical analysis with trading bots is not just about automation; it’s about creating a sophisticated trading system that leverages data analysis to enhance decision-making. By utilizing technical indicators and backtesting your strategies, you can significantly improve your trading outcomes. So, are you ready to take your trading game to the next level? Let’s dive deeper into each component of this integration!
- What is technical analysis? Technical analysis is a method of evaluating securities by analyzing statistics generated by market activity, such as price movements and trading volume.
- How do trading bots work? Trading bots are automated programs that execute trades based on predefined criteria, allowing for quick and efficient trading without human intervention.
- Can I use multiple technical indicators with my trading bot? Yes, you can program your trading bot to use multiple technical indicators to enhance its decision-making capabilities.
- What is backtesting, and why is it important? Backtesting involves testing trading strategies on historical data to evaluate their effectiveness. It’s crucial for refining strategies and improving performance.

Understanding Technical Analysis
Technical analysis is a method used by traders to evaluate securities and forecast future price movements by analyzing historical market data, primarily price and volume. Imagine trying to predict the weather without looking at past data; it would be nearly impossible! Similarly, traders rely on technical analysis to make informed decisions based on market activity. This approach is grounded in the belief that all relevant information is already reflected in the price of a security, and that price movements follow trends that can be identified and exploited.
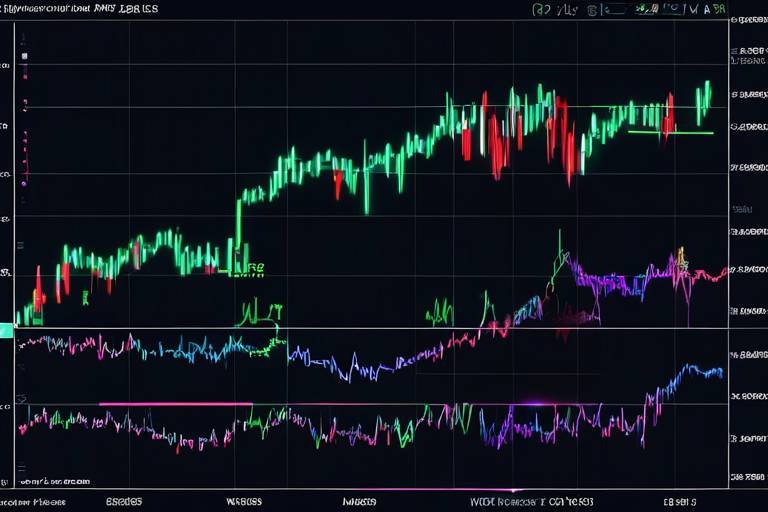
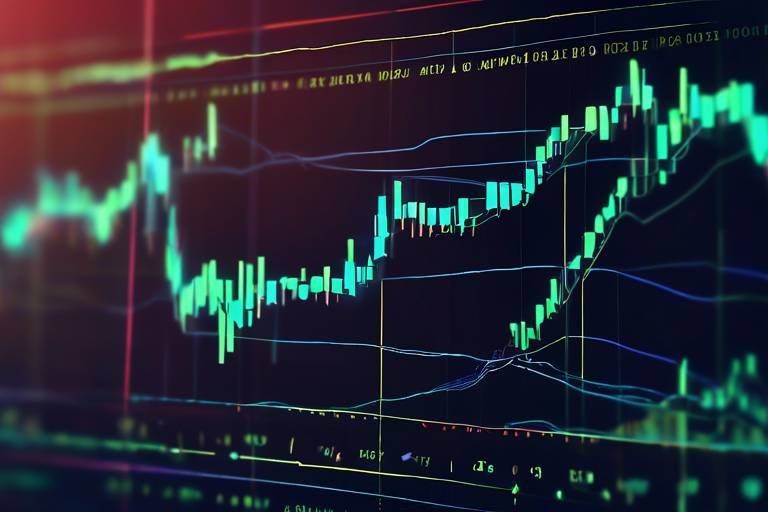
At its core, technical analysis involves various principles and tools that help traders understand market behavior. For instance, traders often utilize charts to visualize price movements over time. These charts can take many forms, including line charts, bar charts, and candlestick charts, each providing unique insights into market dynamics. By studying these patterns, traders can identify potential entry and exit points, helping them to optimize their trades.
One of the fundamental principles of technical analysis is the concept of support and resistance. Support refers to a price level where a security tends to stop falling and may even bounce back, while resistance is where prices often stop rising and may reverse. Knowing these levels can be crucial for traders, as they often indicate where to place buy or sell orders. Think of it like a rubber ball; when dropped, it hits the ground (support) and bounces back up, but if you throw it against a ceiling (resistance), it will just bounce back down.
In addition to support and resistance, traders use various technical indicators to assist their analysis. These indicators can be categorized into different types, including trend indicators, momentum indicators, and volatility indicators. Each serves a specific purpose:
- Trend Indicators: Help identify the direction of the market.
- Momentum Indicators: Measure the speed of price movements.
- Volatility Indicators: Assess the degree of price fluctuations.
By integrating these indicators into their trading strategies, traders can enhance their decision-making processes. For example, a trader might use a combination of moving averages to identify the trend and the Relative Strength Index (RSI) to gauge whether a security is overbought or oversold. This holistic approach to analysis allows for a more nuanced understanding of market conditions, ultimately leading to better trading outcomes.
In summary, technical analysis is an invaluable tool for traders looking to navigate the complex world of financial markets. By understanding and utilizing its principles and tools, traders can make more informed decisions, capitalize on market trends, and improve their overall trading strategies. Just as a skilled navigator relies on maps and instruments to chart a course, traders can use technical analysis to guide their trading journey.
The Role of Trading Bots
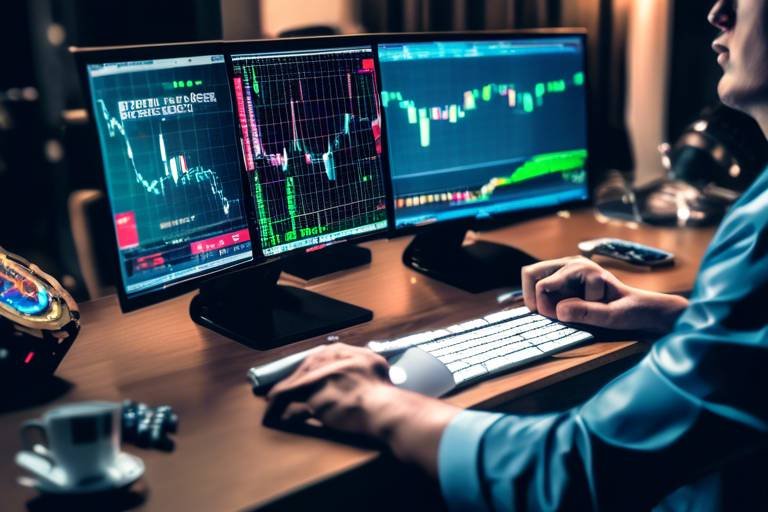
Trading bots have revolutionized the way traders interact with financial markets. These automated software programs are designed to execute trades based on predefined criteria, eliminating the emotional and psychological stress that often accompanies trading. Imagine having a tireless assistant who can analyze market data and execute trades at lightning speed—this is precisely what trading bots offer. They operate continuously, monitoring market conditions and making decisions in real-time, which can significantly enhance a trader's ability to capitalize on market movements.
One of the most compelling aspects of trading bots is their ability to process vast amounts of data quickly and efficiently. While a human trader may take time to analyze charts, identify trends, and execute trades, a bot can perform these tasks in a fraction of the time. This speed can be a game-changer, especially in volatile markets where every second counts. Moreover, trading bots can operate 24/7, ensuring that no opportunity is missed, even when the trader is asleep or busy with other activities.
In addition to speed, trading bots provide a level of consistency that is hard for human traders to achieve. Emotions like fear and greed can cloud judgment, leading to impulsive decisions. However, bots rely solely on data and algorithms, which allows them to maintain a disciplined approach to trading. This can lead to more rational decision-making and ultimately improve trading outcomes.
There are several advantages to using trading bots:
- Automation: Bots automate the trading process, allowing traders to focus on strategy rather than execution.
- Speed: They can execute trades in milliseconds, taking advantage of fleeting market opportunities.
- Emotionless Trading: Bots operate based on data, reducing the impact of emotional decision-making.
- Backtesting Capability: Traders can test their strategies against historical data before deploying them in live markets.
However, it’s important to note that trading bots are not a one-size-fits-all solution. They require careful setup and a clear understanding of the market and trading strategies. Additionally, while bots can enhance trading efficiency, they are not foolproof. Market conditions can change rapidly, and unforeseen events can lead to losses, even for the most sophisticated algorithms. Therefore, traders must remain vigilant and continually assess the performance of their bots.
In summary, trading bots play a pivotal role in modern trading by automating processes, improving speed and consistency, and allowing traders to focus on strategy rather than execution. As technology continues to evolve, the integration of these bots with advanced technical analysis will likely lead to even more sophisticated trading strategies, making them an essential tool for both novice and experienced traders.
Types of Trading Bots
When it comes to trading bots, understanding the different types can significantly enhance your trading strategy. Just like how a chef uses various tools to create a culinary masterpiece, traders can leverage different bots to achieve their financial goals. Each type of trading bot serves a unique purpose and can be tailored to fit specific trading styles. Let's dive into the most common types of trading bots and how they can be utilized effectively.
The first category worth mentioning is Market-Making Bots. These bots are like the lifeblood of the trading ecosystem, providing liquidity by placing simultaneous buy and sell orders. They help maintain an orderly market by ensuring that there are always available trades. Market-making bots can capitalize on the spread, which is the difference between the buying and selling price. While they can be highly profitable, they also come with risks, especially in volatile markets where price fluctuations can lead to unexpected losses.
Next up, we have Arbitrage Bots. Think of these bots as the opportunists of the trading world. They exploit price differences across various exchanges to secure profits. For instance, if Bitcoin is priced lower on one exchange than another, an arbitrage bot will buy it at the lower price and sell it at the higher price, pocketing the difference. This type of bot requires speed and efficiency, as opportunities can vanish in the blink of an eye. While arbitrage trading can be lucrative, it also demands a solid understanding of transaction fees and market dynamics to ensure profitability.
Another type of trading bot is the Trend-Following Bot. These bots are designed to identify and capitalize on market trends. They analyze historical price data and apply various technical indicators to determine the direction of the market—upward or downward. By following trends, these bots aim to enter trades at the right moment, maximizing potential gains. However, it's essential to remember that trends can change, and a sudden reversal can lead to losses if not managed properly.
Lastly, we have Mean Reversion Bots. Imagine a rubber band that stretches and then snaps back to its original state; that's how mean reversion works. These bots operate on the premise that prices will revert to their historical average over time. They identify overbought or oversold conditions and execute trades accordingly. While this strategy can be effective, it requires a keen understanding of market cycles and the ability to recognize when a price deviation is likely to revert.
In summary, the world of trading bots is diverse, with each type offering unique advantages and challenges. Whether you’re a market maker, an arbitrage seeker, a trend follower, or a mean reversion enthusiast, understanding these types will empower you to make informed decisions. As you explore the capabilities of trading bots, consider how each type aligns with your trading philosophy and objectives.
Market-Making Bots
Market-making bots play a crucial role in the trading ecosystem by providing liquidity to the markets. These automated programs continuously place buy and sell orders, ensuring that there is always a market for traders looking to execute their trades. Imagine walking into a bustling marketplace where vendors are always ready to buy and sell goods; that’s the essence of what market-making bots do—they keep the trading floor alive and thriving.
The operation of market-making bots is based on sophisticated algorithms that analyze market conditions and price fluctuations in real-time. By placing limit orders at specific prices, these bots can capitalize on the spread—the difference between the buying and selling price. This allows them to earn profits on each transaction. However, while the concept may sound simple, the execution requires a deep understanding of market dynamics and a robust strategy to manage risks effectively.
One of the significant benefits of using market-making bots is their ability to react swiftly to changing market conditions. Unlike human traders, these bots can analyze vast amounts of data and execute trades in milliseconds. This speed can be particularly advantageous in volatile markets where prices can change dramatically in a short period. However, it's essential to note that this speed also comes with its own set of risks, especially in times of extreme volatility where price swings can lead to significant losses.
Advantages of Market-Making Bots:
- Increased Liquidity: By constantly placing orders, these bots help maintain liquidity, making it easier for traders to enter and exit positions.
- Reduced Spread: With more buy and sell orders available, the spread between the bid and ask price can narrow, benefiting all market participants.
- Emotionless Trading: Bots operate based on algorithms, eliminating emotional decision-making that can often lead to poor trading choices.
However, it’s important to be aware of the potential risks associated with market-making bots. For instance, in a highly volatile market, these bots may end up executing trades at unfavorable prices, leading to losses. Additionally, if a bot is not programmed correctly, it could flood the market with orders, causing a disruption. Therefore, it’s crucial to continuously monitor and adjust the bot’s parameters to adapt to changing market conditions.
In summary, market-making bots are an essential tool for traders looking to enhance their trading experience. By providing liquidity and executing trades rapidly, they can significantly improve market efficiency. However, like any trading strategy, it’s vital to understand the underlying risks and implement robust risk management practices to ensure long-term success.

Arbitrage Bots
Arbitrage bots are fascinating tools in the trading world, designed to take advantage of price discrepancies across different exchanges. Imagine if you could buy a product at a lower price in one store and instantly sell it at a higher price in another—this is essentially what arbitrage trading does, but in the financial markets. These bots operate under the principle that prices for the same asset may vary across platforms due to factors like market inefficiencies, supply and demand fluctuations, or even latency in price updates.
When we talk about how arbitrage bots function, it’s essential to understand their speed and efficiency. These bots are programmed to monitor multiple exchanges simultaneously, scanning for opportunities where the price of an asset differs. Once a disparity is detected, the bot can execute trades in a matter of milliseconds, securing profits before the market corrects itself. This rapid action is crucial because, in the world of trading, timing is everything. If you’re too slow, the opportunity might vanish before you can react!
One of the significant advantages of using arbitrage bots is their ability to operate around the clock. Unlike human traders, who need breaks and can be affected by emotions, these bots tirelessly execute trades 24/7. This constant vigilance allows traders to capitalize on fleeting opportunities that might otherwise be missed. However, it’s not all sunshine and rainbows; there are potential risks involved. For instance, transaction fees can eat into profits, and if a bot miscalculates or if there’s a sudden market shift, losses can occur.
To give you a clearer picture, here’s a simple table illustrating how arbitrage bots can operate across two hypothetical exchanges:
| Exchange A | Exchange B |
|---|---|
| Bitcoin Price: $30,000 | Bitcoin Price: $30,500 |
| Action: Buy Bitcoin | Action: Sell Bitcoin |
| Profit per Bitcoin: $500 | Transaction Fees: $50 |
In this example, an arbitrage bot would buy Bitcoin from Exchange A at $30,000 and sell it on Exchange B for $30,500, resulting in a profit of $500. After accounting for transaction fees, the net profit would still be a respectable $450. This demonstrates how powerful arbitrage bots can be when equipped with the right algorithms and strategies.
Moreover, traders often utilize various strategies with arbitrage bots, including triangular arbitrage, where they exploit price differences between three currencies. By converting one currency to another and then back to the original currency across different exchanges, traders can create a loop that yields a profit. It’s a complex dance of numbers and timing, but the rewards can be significant for those who master it.
In conclusion, arbitrage bots serve as a powerful ally for traders looking to exploit market inefficiencies. While they offer the potential for substantial profits, it’s crucial to understand the underlying mechanics and risks involved. As with any trading strategy, thorough research and careful implementation are key to success.
- What is an arbitrage bot? An arbitrage bot is a type of automated trading software that identifies and capitalizes on price discrepancies of the same asset across different exchanges.
- How do I set up an arbitrage bot? Setting up an arbitrage bot typically involves selecting a trading platform, configuring the bot with your trading strategy, and connecting it to your exchange accounts.
- Are arbitrage bots profitable? Yes, arbitrage bots can be profitable, but their success depends on various factors such as market conditions, transaction fees, and the bot's efficiency.
- What risks are associated with using arbitrage bots? Risks include market volatility, transaction fees, and potential technical issues that could lead to losses if not managed properly.

Combining Technical Analysis with Bots
In the ever-evolving world of trading, the integration of technical analysis with trading bots represents a powerful synergy that can enhance decision-making and improve trading outcomes. Imagine having the ability to analyze vast amounts of market data at lightning speed, while simultaneously executing trades based on well-defined strategies. This is precisely what happens when technical analysis meets automation. By embedding technical indicators and chart patterns into trading bots, traders can create a more robust framework for making informed decisions.
First off, let's consider how technical analysis can inform the algorithms that drive trading bots. Technical analysis relies on historical price data and trading volumes to identify trends and patterns that can predict future price movements. By programming these indicators into a trading bot, traders can automate the process of identifying entry and exit points. For instance, if a bot is programmed to recognize a head and shoulders pattern, it can execute a sell order as soon as the pattern is confirmed, thus taking advantage of potential market reversals.
Moreover, the use of technical indicators can significantly reduce emotional trading. When traders rely solely on their instincts, they are often swayed by fear or greed. However, by using a trading bot that executes trades based on predefined technical signals, traders can maintain discipline and stick to their strategies. Imagine a scenario where the market suddenly drops; a well-programmed bot can automatically trigger a stop-loss order based on the Relative Strength Index (RSI), preventing further losses without the trader having to make a split-second decision.
To effectively combine technical analysis with trading bots, it’s essential to choose the right indicators. Here are a few popular indicators that can be seamlessly integrated:
- Moving Averages: These help in smoothing out price data and identifying trends over specific periods.
- Bollinger Bands: These can signal market volatility and potential price reversals.
- MACD (Moving Average Convergence Divergence): This indicator helps traders spot changes in momentum.
Each of these indicators has its own unique strengths and can be tailored to fit different trading strategies. The key is to backtest these indicators within the bot's framework to ensure they perform well under various market conditions.
Another important aspect of combining technical analysis with trading bots is the ability to adapt to changing market conditions. Markets can be unpredictable, and a bot that relies on static strategies may falter. By incorporating machine learning algorithms, a trading bot can learn from past trades and adjust its parameters accordingly. This adaptive approach can lead to improved performance over time as the bot becomes more attuned to market dynamics.
In conclusion, the fusion of technical analysis with trading bots is not just a trend; it’s a revolutionary approach that can significantly enhance trading efficiency and profitability. By leveraging the power of automation and data analysis, traders can make informed decisions while minimizing emotional biases. As technology continues to advance, the possibilities for integrating technical analysis with trading bots will only expand, paving the way for smarter trading strategies.
Q1: Can trading bots replace human traders?
A trading bot can automate many tasks, but it cannot replace the intuition and experience of a human trader. Bots are best used as tools to enhance trading strategies.
Q2: How do I choose the right technical indicators for my bot?
Choosing the right indicators depends on your trading strategy and goals. Consider backtesting different indicators to see which ones yield the best results for your approach.
Q3: Are there risks associated with using trading bots?
Yes, while trading bots can enhance efficiency, they also come with risks such as technical failures or market volatility. It’s crucial to monitor bot performance regularly.

Choosing the Right Indicators
When it comes to trading, the choice of indicators can make or break your strategy. Indicators are like the compass in a sailor's hand; they help navigate the often turbulent waters of the financial markets. But how do you know which indicators are right for your trading bot? The answer lies in understanding the market conditions you’re dealing with and what you aim to achieve. Just like a chef selects ingredients based on the dish they want to create, traders must choose indicators that align with their strategy.
There are numerous indicators available, each serving different purposes. For instance, some indicators are designed to identify trends, while others focus on momentum or volatility. To make the best decision, it’s essential to consider the following factors:
- Market Conditions: Different indicators perform better in different market environments. For example, trending markets may benefit from trend-following indicators, while ranging markets might require oscillators.
- Time Frame: The time frame you choose for trading can influence which indicators are most effective. Short-term traders might prefer indicators that react quickly, while long-term investors may focus on more stable indicators.
- Personal Preference: Ultimately, the best indicators are those you feel comfortable using. Familiarity breeds confidence, and confidence can lead to more decisive trading.
One of the most popular types of indicators is the Moving Average. This indicator helps smooth out price data and identify trends over a specific period. There are various types of moving averages, such as the Simple Moving Average (SMA) and the Exponential Moving Average (EMA), each with its unique applications. For instance, while the SMA gives equal weight to all prices in the period, the EMA gives more weight to recent prices, making it more responsive to new information.
Another key player in the world of indicators is the Relative Strength Index (RSI). This momentum oscillator measures the speed and change of price movements, providing insights into whether an asset is overbought or oversold. The RSI operates on a scale of 0 to 100, with readings above 70 indicating overbought conditions and readings below 30 suggesting oversold conditions. By integrating the RSI into your trading bot, you can automate the process of identifying potential reversal points in the market.
To summarize, choosing the right indicators for your trading bot is crucial for effective decision-making. By aligning your indicators with your trading goals, market conditions, and personal preferences, you can significantly enhance your trading strategy. Remember, the goal is to create a harmonious blend of technical analysis tools that work together to provide a clearer picture of market dynamics.
Q: How many indicators should I use in my trading strategy?
A: While it might be tempting to use many indicators, it's best to stick with a few that you understand well. Too many indicators can create confusion and lead to analysis paralysis.
Q: Can I rely solely on indicators for trading decisions?
A: Indicators are valuable tools, but they should not be the only basis for your trading decisions. Always consider other factors like market news, economic indicators, and your risk tolerance.
Q: How often should I adjust my indicators?
A: It's wise to periodically review your indicators, especially if market conditions change. Adaptability is key in trading, and what works today may not work tomorrow.
Moving Averages
Moving averages are one of the most widely used technical indicators in the trading world, serving as a fundamental tool for traders looking to identify trends and make informed decisions. Essentially, a moving average smooths out price data over a specified period, helping to filter out the "noise" that can often cloud market movements. This smoothing effect allows traders to focus on the underlying trends, providing a clearer picture of the market's direction. Imagine trying to find a clear path through a dense forest; moving averages act like a well-marked trail, guiding you through the chaos of price fluctuations.
There are several types of moving averages, each with its unique characteristics and applications. The two most common types are the Simple Moving Average (SMA) and the Exponential Moving Average (EMA). The SMA calculates the average price over a specific number of periods, giving equal weight to all prices in that range. On the other hand, the EMA places greater emphasis on the most recent prices, making it more responsive to new information. This responsiveness can be particularly beneficial in fast-moving markets where timely decisions are crucial.
When programming moving averages into trading bots, traders often choose the type of moving average based on their trading strategy and market conditions. For instance, a trader focused on long-term trends might opt for the SMA, while a day trader looking for quick entries and exits might prefer the EMA for its quicker reaction to price changes. To illustrate the differences, here's a simple comparison table:
| Type of Moving Average | Calculation Method | Use Case |
|---|---|---|
| Simple Moving Average (SMA) | Averages prices over a set period | Long-term trend analysis |
| Exponential Moving Average (EMA) | Gives more weight to recent prices | Short-term trading and quick reactions |
Incorporating moving averages into trading bots can significantly enhance their effectiveness. By setting specific parameters, such as the number of periods for the moving average, traders can create strategies that trigger buy or sell signals based on the crossover of different moving averages. For example, a common strategy involves using both the 50-day and 200-day moving averages; when the 50-day EMA crosses above the 200-day EMA, it signals a potential buying opportunity, while a crossover below may indicate a selling point. This kind of strategy can be easily programmed into a trading bot, allowing for automated execution without the need for constant monitoring.
In conclusion, moving averages are not just another technical indicator; they are a powerful tool that can help traders navigate the complexities of the market. By understanding their types, applications, and how to integrate them into trading bots, traders can enhance their decision-making processes, ultimately leading to improved trading outcomes. So, whether you’re a seasoned trader or just starting, consider making moving averages a part of your trading toolkit.

Relative Strength Index (RSI)
The is a powerful momentum oscillator that measures the speed and change of price movements. Developed by J. Welles Wilder Jr., this indicator is a favorite among traders for its ability to identify potential overbought or oversold conditions in the market. But what does that really mean? Imagine you're at a party, and everyone is dancing; suddenly, the music stops, and people start leaving. The RSI helps you gauge whether the party is still lively or if it's time to pack up and head home.
Typically, the RSI is displayed on a scale from 0 to 100, with levels above 70 indicating that a security may be overbought and levels below 30 suggesting it may be oversold. This simple yet effective range allows traders to make quick decisions based on market conditions. For instance, if the RSI is above 70, it could signal a potential reversal, indicating that it might be wise to sell. Conversely, an RSI below 30 could be a signal to buy, as it suggests that the asset might be undervalued.
To incorporate the RSI into trading bots, you'll need to program the bot to recognize these thresholds. This can be done using coding languages like Python, which is popular for its simplicity and effectiveness in developing trading algorithms. Here’s a simple example of how you might code the RSI into a trading bot:
def calculate_rsi(data, period14):
    delta  data['close'].diff()
    gain  (delta.where(delta > 0, 0)).rolling(windowperiod).mean()
    loss  (-delta.where(delta < 0, 0)).rolling(windowperiod).mean()
    rs  gain / loss
    rsi  100 - (100 / (1 + rs))
    return rsi
In this code snippet, the RSI is calculated based on the closing prices of a security over a specified period, typically 14 days. By integrating such logic into your trading bot, you can automate the process of monitoring RSI levels and executing trades based on predefined criteria.
However, while the RSI is a valuable tool, it shouldn't be used in isolation. Combining it with other indicators can provide a more comprehensive view of market dynamics. For example, using the RSI alongside moving averages can help confirm trends and reduce the likelihood of false signals. Think of it as having a buddy at that party who helps you decide when to leave—sometimes, two heads are better than one!
As you consider implementing the RSI in your trading strategies, remember that backtesting is crucial. By analyzing historical data, you can see how well the RSI would have performed under different market conditions, allowing you to tweak your strategies accordingly. The more you understand how the RSI interacts with price movements, the better equipped you'll be to make informed trading decisions.
- What is the best RSI period to use? While the default setting is 14 periods, traders often experiment with different lengths to find what works best for their trading style.
- Can the RSI be used for all types of securities? Yes, the RSI can be applied to stocks, forex, commodities, and cryptocurrencies, making it a versatile tool for traders.
- Is the RSI a reliable indicator? While the RSI is widely used, no indicator is foolproof. It's essential to combine it with other analysis methods for better accuracy.

Backtesting Trading Strategies
Backtesting is an essential component of developing a successful trading strategy. It involves testing a trading strategy on historical data to determine its viability before deploying it in real-time markets. Think of it as a rehearsal for a play; you want to ensure that everything runs smoothly before the opening night. In the world of trading, this means analyzing past market movements and assessing how a strategy would have performed under various conditions. This process helps traders identify potential weaknesses in their strategies and make necessary adjustments.
When backtesting, traders typically use historical price data to simulate trades based on their chosen strategy. By doing so, they can evaluate key performance metrics such as profitability, drawdown, and win rate. These metrics are crucial for understanding how a strategy might perform in the future. Remember, however, that past performance is not always indicative of future results. Markets change, and what worked yesterday may not work tomorrow. Therefore, it’s vital to approach backtesting with a critical eye.
To set up a backtesting environment effectively, traders need specific tools and resources. Here are some of the essential elements:
- Historical Data: Accurate historical price data is the backbone of any backtesting effort. This data should include various time frames and encompass different market conditions.
- Backtesting Software: There are numerous platforms available that allow traders to input their strategies and analyze performance. Popular options include MetaTrader, TradingView, and specialized backtesting software.
- Clear Strategy Definition: Before backtesting, it's crucial to have a well-defined trading strategy, including entry and exit points, risk management rules, and position sizing.
Once the backtesting environment is set up, the next step is to run the tests. This involves executing the strategy against historical data and recording the results. Traders should pay attention to various metrics, such as:
| Metric | Description |
|---|---|
| Profit Factor | The ratio of gross profit to gross loss, indicating the overall profitability of the strategy. |
| Maximum Drawdown | The largest drop from a peak to a trough, showcasing the risk involved in the strategy. |
| Win Rate | The percentage of profitable trades compared to total trades, helping to gauge the effectiveness of the strategy. |
Interpreting backtest results is crucial for refining trading bots and maximizing success. Traders should analyze the results carefully, looking for patterns and insights that can inform future decisions. For instance, if a strategy shows a high win rate but also a significant drawdown, it may be necessary to adjust the risk management rules. On the other hand, a strategy with a lower win rate but consistent profitability might indicate a more sustainable approach.
In conclusion, backtesting is not just a one-time task; it's an ongoing process that should evolve alongside market conditions and trading strategies. By continuously refining and optimizing their approaches, traders can enhance their chances of success in the ever-changing landscape of financial markets.
Q: What is backtesting in trading?
A: Backtesting is the process of testing a trading strategy on historical data to evaluate its effectiveness before applying it in real markets.
Q: Why is backtesting important?
A: Backtesting helps traders understand how a strategy would have performed in the past, allowing them to identify strengths and weaknesses and make necessary adjustments.
Q: Can I rely solely on backtesting results?
A: While backtesting provides valuable insights, it’s essential to remember that past performance does not guarantee future results. Markets can change, so continuous evaluation is necessary.

Setting Up Backtesting Environments
Setting up a backtesting environment is a crucial step for any trader looking to refine their strategies and enhance the performance of their trading bots. Think of it as creating a simulated playground where your bots can practice and learn without risking real money. The first step in this process is to choose the right software that can handle backtesting effectively. There are several platforms available, such as MetaTrader, TradingView, and specialized backtesting software like Amibroker or QuantConnect. Each has its unique features, so it's essential to select one that aligns with your trading style and technical requirements.
Once you've selected your software, the next step is to gather historical market data. This data acts as the foundation for your backtesting. You’ll want to ensure that the data is accurate and covers a sufficient time frame to make your tests meaningful. Look for data that includes price, volume, and any other relevant metrics. Many platforms offer built-in access to historical data, but you can also source it from third-party providers if needed.
After securing your data, it's time to configure your trading bot with the specific strategies you want to test. This involves programming the bot to execute trades based on your predefined criteria, which may include various technical indicators, entry and exit points, and risk management rules. It's important to code these parameters clearly to ensure that the bot mimics your intended trading strategy accurately. You can use a simple table to outline your strategy parameters, making it easier to visualize the rules your bot will follow:
| Parameter | Description |
|---|---|
| Entry Signal | Condition that triggers a buy order (e.g., RSI below 30) |
| Exit Signal | Condition that triggers a sell order (e.g., Moving Average crossover) |
| Stop Loss | Percentage or price level at which to exit a losing trade |
| Take Profit | Target price level to secure profits from a winning trade |
Once your bot is programmed, it's time to run your backtest. This process typically involves inputting your historical data and allowing the software to simulate trades based on your strategy. As the backtest runs, it will generate various metrics that help you assess the performance of your trading strategy. Key metrics to look for include total return, maximum drawdown, and win/loss ratio. Understanding these results is vital as they will guide you in tweaking your strategy for better performance.
Finally, remember that backtesting is not a one-time event. It’s an ongoing process. After analyzing the results, you may need to make adjustments to your strategy and re-run the backtest to see how those changes impact performance. This iterative approach is essential for honing your trading skills and ensuring that your bot remains competitive in the ever-changing market landscape.
- What is backtesting? Backtesting is the process of testing a trading strategy using historical data to evaluate its effectiveness before applying it in the live market.
- Why is backtesting important? It helps traders understand how a strategy would have performed in the past, allowing them to make informed decisions and adjustments.
- Can I trust backtest results? While backtesting provides valuable insights, it's important to remember that past performance does not guarantee future results. Always combine backtesting with other analysis methods.
- How much historical data do I need? Ideally, you should use several years of data to ensure that your strategy is robust across different market conditions.

Interpreting Backtest Results
When it comes to trading bots, backtesting is like a crystal ball, giving you a glimpse into how your strategies might perform in the real world. However, interpreting the results can be a bit tricky, and it's crucial to understand what those numbers really mean. Are you looking at a winner or just a fluke? Let's dive into the essential metrics that can help you decipher your backtest results.
First off, one of the most fundamental metrics to consider is the Net Profit. This figure shows the total amount of profit (or loss) generated over the backtesting period. A positive net profit indicates that your trading strategy has the potential to be profitable, but don't get too excited just yet! It's essential to analyze the profit in conjunction with other metrics.
Next, we have the Win Rate, which tells you the percentage of trades that were profitable. A high win rate might seem appealing, but it can be misleading. For instance, a strategy with a 90% win rate that only makes small profits might not be as effective as one with a 50% win rate but larger average profits. This brings us to the Risk-Reward Ratio, a critical metric that evaluates the average gain of winning trades against the average loss of losing trades. Ideally, you want a risk-reward ratio greater than 1, meaning you're making more on your winners than you lose on your losers.
Another important aspect to consider is Maximum Drawdown, which measures the largest drop from a peak to a trough during the backtest. A smaller drawdown indicates a more stable strategy, whereas a large drawdown might suggest that the strategy could be risky in live trading. This is crucial because it helps you understand how much risk you're willing to tolerate.
| Metric | Description |
|---|---|
| Net Profit | Total profit or loss generated over the testing period. |
| Win Rate | Percentage of profitable trades. |
| Risk-Reward Ratio | Average gain of winning trades vs. average loss of losing trades. |
| Maximum Drawdown | Largest drop from a peak to a trough during the backtest. |
Lastly, don’t forget about the Sharpe Ratio. This metric measures the risk-adjusted return of your strategy. A higher Sharpe Ratio implies that your strategy is generating more return per unit of risk, which is something every trader should strive for. In essence, the Sharpe Ratio helps you compare the performance of different strategies on a level playing field.
In conclusion, interpreting backtest results isn't just about looking at a single figure; it's about understanding the complete picture. By analyzing these key metrics, you can refine your trading strategy, making it more robust and potentially more profitable. Remember, even the best strategies can fail in live markets, so always approach trading with caution and a clear understanding of the risks involved.
- What is backtesting? Backtesting is the process of testing a trading strategy using historical data to see how it would have performed in the past.
- Why is interpreting backtest results important? It helps traders understand the effectiveness of their strategies and make informed decisions before deploying them in live markets.
- What metrics should I focus on when interpreting backtest results? Key metrics include Net Profit, Win Rate, Risk-Reward Ratio, Maximum Drawdown, and Sharpe Ratio.
Frequently Asked Questions
- What is the main purpose of integrating technical analysis with trading bots?
The main purpose is to enhance trading strategies and improve decision-making through automation and data analysis. By using technical analysis, traders can provide their bots with the necessary indicators and patterns that guide trading decisions, making the process more efficient and potentially more profitable.
- How do trading bots operate?
Trading bots operate by executing trades automatically based on predefined criteria set by the user. They analyze market data, execute trades, and can even manage positions without human intervention. This automation allows traders to capitalize on market opportunities 24/7, which is especially useful in fast-moving markets.
- What types of trading bots are available?
There are several types of trading bots, including market-making bots, which provide liquidity by placing buy and sell orders, and arbitrage bots, which exploit price differences across different exchanges. Each type serves a unique purpose and can be tailored to specific trading strategies.
- How can I choose the right technical indicators for my trading bot?
Selecting the right indicators involves understanding your trading strategy and the market conditions. Popular indicators include Moving Averages, which help identify trends, and the Relative Strength Index (RSI), which signals overbought or oversold conditions. It's essential to test various indicators to see which ones align best with your trading goals.
- What is backtesting and why is it important?
Backtesting is the process of testing a trading strategy using historical data to gauge its effectiveness. It’s crucial because it allows traders to refine their strategies, identify potential weaknesses, and improve the performance of their trading bots before deploying them in live markets.
- How can I set up a backtesting environment for my trading bot?
Setting up a backtesting environment requires specific tools and historical data. You can use platforms that offer backtesting features, or you can develop your own setup using programming languages like Python. The key is to ensure you have accurate data and a reliable method to simulate trades based on past market conditions.
- What key metrics should I analyze from backtest results?
When interpreting backtest results, focus on metrics such as the win rate, profit factor, maximum drawdown, and the Sharpe ratio. These metrics provide insights into the strategy's risk and return profile, helping you make informed adjustments to optimize your trading bot's performance.