How to Optimize Your Crypto Trading Strategy with Technical Analysis
In the fast-paced world of cryptocurrency trading, having a solid strategy is paramount. But how do you enhance that strategy to navigate the volatile market effectively? The answer lies in technical analysis. By diving deep into price movements and trading volumes, you can uncover patterns and trends that guide your trading decisions. This article explores how to leverage technical analysis to optimize your crypto trading strategy, making you not just a participant but a savvy trader.
Technical analysis is more than just a buzzword; it’s a crucial element for anyone serious about trading cryptocurrencies. At its core, technical analysis involves evaluating market data—primarily price and volume—to forecast future price movements. Imagine trying to predict the weather without looking at the clouds; it’s just not feasible. Similarly, understanding the fundamentals of technical analysis is essential for making informed trading decisions. Key concepts include support and resistance levels, trend lines, and chart patterns. Grasping these concepts will provide you with a solid foundation to build upon as you delve deeper into the technical aspects of trading.
When it comes to technical analysis, certain indicators stand out as invaluable tools for traders. These indicators help you make informed decisions by providing insights into market trends and potential entry or exit points. Among the most popular indicators are Moving Averages, Relative Strength Index (RSI), and Moving Average Convergence Divergence (MACD). Each of these indicators has its unique role in analyzing the market, and knowing how to use them can significantly improve your trading outcomes.
Moving averages are essential for smoothing out price data and identifying trends over specific periods. Think of them as a way to filter out the noise from daily price fluctuations. There are two primary types of moving averages that traders often use: Simple Moving Averages (SMA) and Exponential Moving Averages (EMA). Each serves a purpose, and understanding how to implement them effectively can enhance your trading strategy.
The Simple Moving Average (SMA) calculates the average price over a set period, allowing traders to see the overall trend without getting bogged down by daily volatility. For example, if you’re looking at a 10-day SMA, you’ll be able to see the average price over the last ten days, which can help you identify whether the asset is trending upwards or downwards. To implement SMA in your trading strategy, simply calculate the average price for the chosen period and plot it on your chart. This can help you spot potential buying or selling opportunities based on crossovers with the price line.
On the other hand, the Exponential Moving Average (EMA) gives more weight to recent prices, making it more responsive to new information. This feature allows traders to react faster to price changes, which can be particularly beneficial in the highly volatile crypto market. To use the EMA, you can apply it similarly to the SMA, but keep in mind that it will react more quickly to price movements. This can help you identify potential trends and reversals more efficiently, giving you an edge in your trading decisions.
The Relative Strength Index (RSI) is another powerful tool in your technical analysis arsenal. This momentum oscillator measures the speed and change of price movements, helping you identify overbought or oversold conditions in the market. An RSI value above 70 typically indicates that an asset may be overbought, while a value below 30 suggests it may be oversold. By interpreting these values, you can make more informed decisions about when to enter or exit trades, potentially maximizing your profits.
Recognizing chart patterns can provide valuable insights into potential market movements. Patterns like head and shoulders, triangles, and flags are essential for traders looking to predict future price movements. By understanding these patterns, you can make more informed trading decisions and enhance your strategy.
The head and shoulders pattern typically indicates a reversal in trend. This pattern consists of three peaks: a higher peak (the head) between two lower peaks (the shoulders). Identifying this pattern can signal a potential trend reversal, allowing you to adjust your trading strategy accordingly. Recognizing head and shoulders formations can provide a significant advantage in the crypto market.
Triangles and flags are continuation patterns that signal potential price movements. Triangles can be ascending, descending, or symmetrical, indicating whether the market is consolidating before a breakout. Flags, on the other hand, represent a brief pause in a strong trend. Learning to recognize these patterns can help you leverage them in your trading strategies for optimal results.
A well-structured trading plan is crucial for success in crypto trading. A trading plan outlines your goals, risk management strategies, and the role of technical analysis in shaping your approach. Think of it as your roadmap in the often chaotic world of cryptocurrency; without it, you might find yourself lost and making impulsive decisions.
Effective risk management is vital for protecting your capital and ensuring long-term success. Strategies such as stop-loss orders and position sizing are essential tools for minimizing potential losses in crypto trading. By setting stop-loss orders, you can automatically sell an asset if it drops to a certain price, helping you limit your losses. Likewise, understanding how to size your positions based on your risk tolerance can prevent you from overexposing yourself in the market.
Establishing clear trading goals and objectives is essential for maintaining focus and discipline. Without defined targets, it’s easy to get sidetracked by market noise. Consider setting realistic targets based on your analysis and measuring your progress regularly. This approach not only keeps you accountable but also allows you to adjust your strategy as needed.
- What is technical analysis? Technical analysis is the evaluation of market data, primarily price and volume, to forecast future price movements.
- How do I use moving averages in trading? Moving averages smooth out price data to help identify trends, with SMA providing a simple average and EMA reacting more quickly to recent price changes.
- What does the RSI indicate? The Relative Strength Index measures price momentum, helping traders identify overbought or oversold conditions.
- Why is a trading plan important? A trading plan provides structure and discipline, helping traders set clear goals and manage risk effectively.
Understanding Technical Analysis
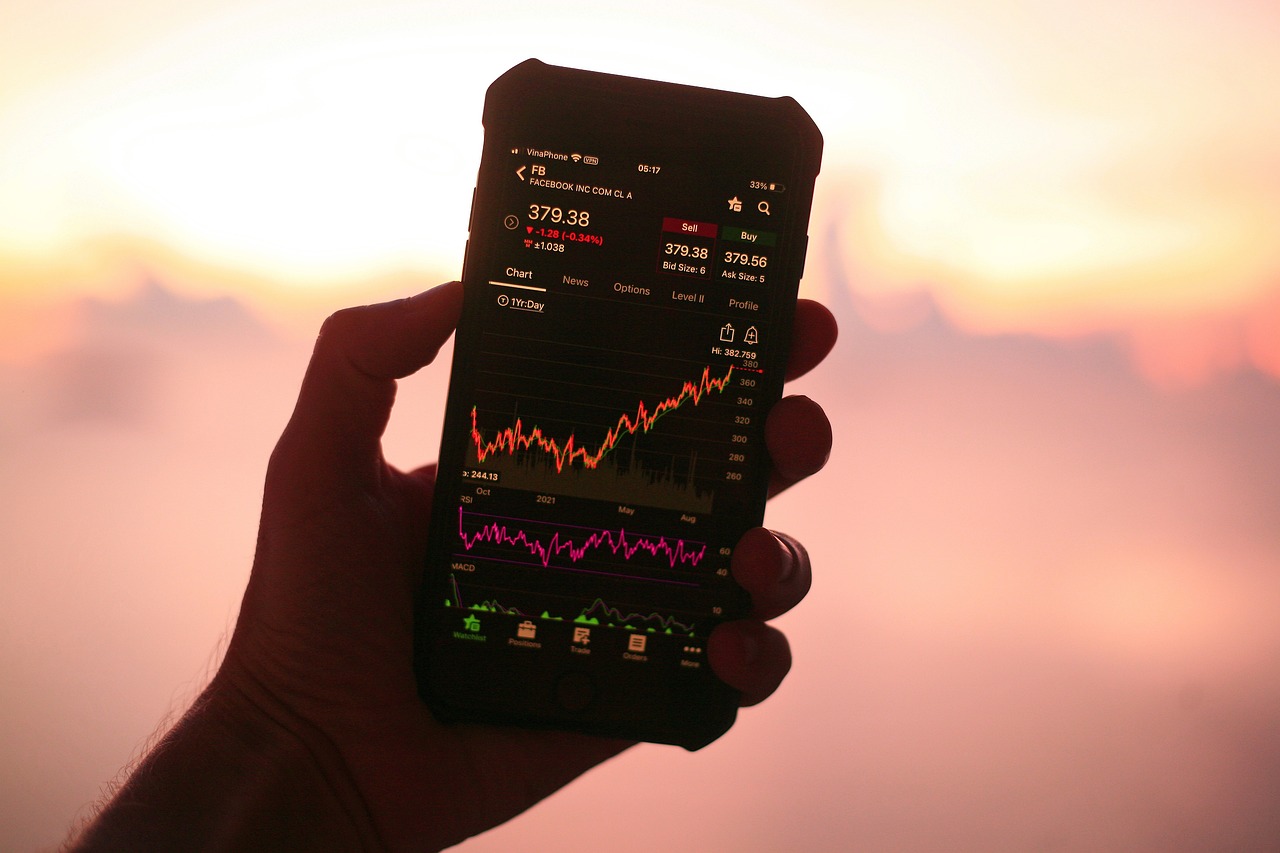
When it comes to navigating the wild and unpredictable waters of cryptocurrency trading, technical analysis serves as your trusty compass. But what exactly is it? In simple terms, technical analysis is the art and science of evaluating market data, primarily focusing on price and volume, to predict future price movements. Think of it like reading a map; you need to understand the terrain before embarking on your trading journey.
Why is technical analysis so crucial? Well, the crypto market is notorious for its volatility. Prices can skyrocket or plummet in a matter of minutes, and without a solid understanding of market trends, you might find yourself lost at sea. By analyzing historical data and identifying patterns, traders can make more informed decisions, improving their chances of success. Here are some foundational concepts that every trader should grasp:
- Price Action: This refers to the movement of a cryptocurrency's price over time. Understanding price action helps traders identify trends and potential reversals.
- Volume: Volume indicates how much of a cryptocurrency is being traded. High volume can signify strong interest, while low volume may suggest a lack of conviction in price movements.
- Market Sentiment: This is the overall attitude of investors towards a particular cryptocurrency. Sentiment can be gauged through news, social media, and other channels, influencing price movements.
To effectively utilize technical analysis, traders often rely on various tools and indicators. These tools help distill complex data into actionable insights, enabling traders to identify potential entry and exit points. For instance, moving averages help smooth out price fluctuations, while momentum indicators like the Relative Strength Index (RSI) provide insights into whether a cryptocurrency is overbought or oversold. By mastering these tools, traders can enhance their decision-making process and increase their chances of capitalizing on market opportunities.
In summary, understanding technical analysis is not just a nice-to-have skill; it’s an essential component of a successful trading strategy. By analyzing price movements and market trends, traders can navigate the crypto landscape with greater confidence. So, if you're serious about trading cryptocurrencies, make sure to invest the time to learn and apply technical analysis in your strategy. It could very well be the difference between sailing smoothly and capsizing in turbulent waters!

Key Indicators for Crypto Trading
When it comes to navigating the unpredictable waters of cryptocurrency trading, having the right tools at your disposal can make all the difference. One of the most effective ways to enhance your trading strategy is by utilizing technical indicators. These indicators are statistical calculations based on historical price and volume data, providing insights that help traders make informed decisions. In this section, we will dive into some of the essential indicators that every crypto trader should know about, including Moving Averages, Relative Strength Index (RSI), and Moving Average Convergence Divergence (MACD).
The Moving Average is a fundamental indicator that helps smooth out price data over a specific period, allowing traders to identify trends more easily. By understanding the differences between the Simple Moving Average (SMA) and the Exponential Moving Average (EMA), traders can better gauge market sentiment. The SMA calculates the average price over a set time frame, while the EMA gives more weight to recent prices, making it more responsive to new information. This responsiveness can be crucial in the fast-paced crypto market, where conditions can change rapidly.
Next up is the Relative Strength Index (RSI), a momentum oscillator that measures the speed and change of price movements. The RSI ranges from 0 to 100 and is typically used to identify overbought or oversold conditions in the market. A reading above 70 often indicates that a cryptocurrency is overbought, while a reading below 30 suggests it may be oversold. Understanding these signals can help traders time their entries and exits more effectively, enhancing their overall trading strategy.
The Moving Average Convergence Divergence (MACD) is another powerful indicator that helps traders spot potential buy and sell signals. It consists of two moving averages and the MACD line, which shows the relationship between them. When the MACD line crosses above the signal line, it can be a bullish signal, while a cross below can indicate a bearish trend. This indicator is particularly useful in identifying momentum shifts, which can be critical in the highly volatile crypto market.
| Indicator | Purpose | Key Signals |
|---|---|---|
| Moving Averages | Identify trends | Crossovers indicate potential buy/sell signals |
| Relative Strength Index (RSI) | Measure momentum | Overbought (>70) / Oversold (<30) conditions |
| Moving Average Convergence Divergence (MACD) | Spot momentum shifts | Crossovers indicate potential buy/sell signals |
In summary, understanding these key indicators is essential for anyone looking to enhance their crypto trading strategy. By incorporating tools like Moving Averages, RSI, and MACD into your analysis, you can gain valuable insights into market trends and make more informed decisions. Remember, the crypto market is notoriously volatile, and utilizing these indicators can provide you with a clearer picture, helping you navigate the waves with greater confidence.
Q: What is the best indicator for crypto trading?
A: There isn't a one-size-fits-all answer, as the best indicator depends on your trading style. However, many traders find success using a combination of Moving Averages, RSI, and MACD to get a comprehensive view of market conditions.
Q: How often should I check my indicators?
A: It depends on your trading strategy. Day traders may check indicators multiple times a day, while swing traders might look at them daily or weekly. The key is to find a rhythm that works for you.
Q: Can I rely solely on technical indicators?
A: While technical indicators are valuable tools, they should be used in conjunction with other analysis methods, such as fundamental analysis and market sentiment, to make well-rounded trading decisions.

Moving Averages
When it comes to navigating the choppy waters of cryptocurrency trading, are like your trusty compass. They help smooth out the noise of price fluctuations, allowing you to identify trends over a specific period. By analyzing moving averages, traders can make more informed decisions and potentially increase their profitability. But how do you utilize these powerful tools effectively in your trading strategy? Let’s break it down.
There are two primary types of moving averages that traders often use: the Simple Moving Average (SMA) and the Exponential Moving Average (EMA). Each has its unique characteristics and applications, which we’ll explore in more detail below. Understanding the differences between these two can significantly impact your trading outcomes.
The Simple Moving Average is calculated by taking the average price of a cryptocurrency over a specific number of periods. For example, a 10-day SMA adds up the closing prices of the last 10 days and divides that sum by 10. This gives you a smoothed line that represents the average price over that timeframe. Traders often look for crossovers between the SMA and the actual price to make trading decisions. If the price crosses above the SMA, it may signal a buying opportunity, while a drop below might indicate a sell signal.
Here’s a quick example to illustrate how SMA works:
| Day | Closing Price | SMA (10-day) |
|---|---|---|
| 1 | $100 | N/A |
| 2 | $102 | N/A |
| 3 | $104 | N/A |
| 4 | $98 | N/A |
| 5 | $105 | N/A |
| 6 | $107 | N/A |
| 7 | $110 | N/A |
| 8 | $112 | N/A |
| 9 | $115 | N/A |
| 10 | $120 | $107.5 |
As you can see, the SMA provides a clearer picture of the trend over time, smoothing out the fluctuations. However, it can lag behind the price action, which is where the Exponential Moving Average comes into play.
The Exponential Moving Average gives more weight to recent prices, making it more responsive to new information. This is particularly useful in the fast-paced world of crypto trading, where prices can change rapidly. The EMA reacts quicker to price movements, allowing traders to spot trends and potential reversals sooner than with the SMA.
To calculate the EMA, you’ll need to determine the multiplier for weighting the recent prices. The formula is:
Multiplier 2 / (N + 1)
Where N is the number of periods. For example, for a 10-day EMA, the multiplier would be 0.1818. This means that recent prices will have a greater influence on the EMA compared to older prices.
Utilizing both SMA and EMA in your trading strategy can provide a comprehensive view of market trends. Many traders use a combination of both, looking for crossovers between the two to signal potential buy or sell opportunities. For instance, when the EMA crosses above the SMA, it may indicate a bullish trend, while the opposite crossover could suggest a bearish trend.
In summary, moving averages are essential tools in a trader's toolkit. They help you filter out the noise and focus on the underlying trend, making your trading decisions more informed and strategic. Remember, the key is to combine these indicators with other forms of analysis to create a robust trading strategy.
- What is the main difference between SMA and EMA? The main difference is that SMA treats all prices equally, while EMA gives more weight to recent prices, making it more responsive to new information.
- How can I use moving averages in my trading strategy? You can use moving averages to identify trends, make buy or sell decisions based on crossovers, and set up support and resistance levels.
- Should I use SMA or EMA for day trading? Many day traders prefer EMA due to its responsiveness, but using both in conjunction can provide a more comprehensive view of the market.

Simple Moving Average (SMA)
The is one of the most fundamental tools in technical analysis, yet it holds immense power in shaping your trading decisions. At its core, the SMA is a calculation that takes the average price of a cryptocurrency over a specific period, smoothing out price fluctuations to reveal the underlying trend. Imagine it as a calm lake reflecting the sky; the ripples of daily price changes are smoothed out to give you a clear view of the overall direction.
To effectively use the SMA in your trading strategy, it’s crucial to understand how to calculate it and interpret its signals. The formula for calculating the SMA is quite simple:
SMA (P1 + P2 + P3 + ... + Pn) / n
Where P1, P2, P3, ... Pn are the prices over the chosen period, and n is the number of periods. For example, if you’re looking at a 10-day SMA, you would add the closing prices of the last 10 days and divide by 10. This gives you a single average price that represents the trend over that timeframe.
Utilizing the SMA can provide you with significant insights into market behavior. Here are a few key points to consider when implementing SMA in your trading:
- Trend Identification: If the price is above the SMA, it indicates an uptrend, while prices below the SMA suggest a downtrend. This can help you determine whether to buy or sell.
- Support and Resistance Levels: The SMA can act as a dynamic support or resistance level. Traders often look for price reactions at the SMA line to make decisions.
- Crossover Signals: When a shorter-term SMA crosses above a longer-term SMA, it can signal a potential buy opportunity, while the opposite crossover may indicate a sell signal.
It's important to remember that while the SMA is a powerful tool, it’s not infallible. Relying solely on this indicator can lead to missed opportunities or false signals, especially in highly volatile markets like cryptocurrency. Therefore, many traders combine the SMA with other indicators, such as the Exponential Moving Average (EMA) or the Relative Strength Index (RSI), to enhance their analysis and decision-making process.
In summary, the Simple Moving Average is a valuable ally in your trading toolkit. By understanding how to calculate and interpret the SMA, you can gain a clearer perspective on market trends and make more informed trading decisions. Just remember, the key to successful trading is not just in the tools you use but also in how you apply them in conjunction with your overall strategy.
- What is the main difference between SMA and EMA? The main difference is that the EMA gives more weight to recent prices, making it more responsive to new information compared to the SMA.
- How can I choose the right period for my SMA? The choice of period depends on your trading style. Shorter periods (like 10 days) are better for day trading, while longer periods (like 50 or 200 days) are typically used for long-term investing.
- Can I use SMA for all cryptocurrencies? Yes, SMA can be applied to any cryptocurrency as long as you have historical price data.

Exponential Moving Average (EMA)
The is a powerful tool in the arsenal of any crypto trader looking to make informed decisions. Unlike the Simple Moving Average (SMA), which treats all price data equally, the EMA gives more weight to recent prices. This characteristic makes the EMA more responsive to new information, allowing traders to react swiftly to market changes. By focusing on the most recent price movements, the EMA helps in identifying trends more effectively, which is crucial in the highly volatile world of cryptocurrencies.
To calculate the EMA, a specific formula is used that incorporates the closing prices of the asset along with a multiplier derived from the chosen period. For instance, if you're using a 10-day EMA, the most recent closing prices will have a greater influence on the EMA value compared to older prices. This is akin to having a magnifying glass that sharpens your view of the current market landscape, enabling you to see potential opportunities that may be obscured by older data.
One of the most significant advantages of using the EMA is its ability to highlight potential reversal points in the market. When the price of a cryptocurrency crosses above the EMA, it can signify a bullish trend, while a price crossing below the EMA may indicate a bearish trend. This simple yet effective indicator can assist traders in determining when to enter or exit trades. However, it’s essential to combine the EMA with other indicators and tools for a more comprehensive trading strategy.
For traders looking to implement the EMA in their strategies, here are some key considerations:
- Choosing the Right Period: The period you select for your EMA can significantly impact your analysis. Shorter EMAs (like 9 or 12 days) are more sensitive to price changes, while longer EMAs (like 50 or 200 days) provide a smoother view of the trend.
- Crossovers: Watching for crossovers between different EMAs can provide additional signals. For example, a short-term EMA crossing above a long-term EMA is often seen as a bullish signal.
- Combining with Other Indicators: To enhance the effectiveness of the EMA, consider using it alongside other indicators, such as the Relative Strength Index (RSI) or the Moving Average Convergence Divergence (MACD), to confirm signals and reduce false positives.
In conclusion, the Exponential Moving Average is not just another line on your trading chart; it’s a vital indicator that can provide insights into market trends and potential trading opportunities. By understanding and utilizing the EMA effectively, traders can enhance their decision-making process and potentially increase their profitability in the fast-paced crypto market.
What is the main difference between EMA and SMA?
The primary difference lies in how they calculate averages. The EMA gives more weight to recent prices, making it more responsive to market changes, while the SMA treats all prices equally.
How can I choose the right period for my EMA?
Choosing the right period depends on your trading strategy. Shorter EMAs are better for day trading, while longer EMAs are suitable for longer-term investments.
Can I use EMA alone for trading?
While the EMA is a powerful tool, it’s best used in conjunction with other indicators to confirm signals and reduce the risk of false positives.

Relative Strength Index (RSI)
The is a powerful tool in the arsenal of any crypto trader. This momentum oscillator, developed by J. Welles Wilder Jr., measures the speed and change of price movements on a scale of 0 to 100. But what does that mean for you as a trader? Essentially, it helps you gauge whether a cryptocurrency is overbought or oversold, giving you a clearer picture of potential price reversals. Imagine walking into a store and noticing a sale; you wouldn't buy something at full price when it's discounted, right? Similarly, the RSI helps you identify those 'discounted' moments in the market.
Typically, an RSI reading above 70 indicates that a cryptocurrency might be overbought, suggesting that the price may soon drop. Conversely, a reading below 30 signals that an asset might be oversold, indicating a potential price increase. Understanding these levels is crucial for making informed trading decisions. For instance, if you see an RSI reading of 75 on Bitcoin, it might be wise to consider selling or at least tightening your stop-loss to protect your gains.
To make the most of the RSI, it’s essential to look at its movement over time rather than just a single reading. Here are a few key points to keep in mind:
- Divergence: If the price of a cryptocurrency is making new highs, but the RSI is not, this divergence can signal a potential reversal.
- Centerline Crossovers: When the RSI crosses above the 50 level, it can indicate a bullish trend, while crossing below can signal a bearish trend.
- Trend Confirmation: Use the RSI alongside other indicators, like moving averages, to confirm trends and make more robust trading decisions.
In summary, the RSI is not just a standalone indicator; it's a part of a larger trading strategy. By integrating it with other tools and understanding its signals, you can make more calculated decisions in the volatile world of cryptocurrency trading. Remember, like any tool, the RSI is most effective when used wisely and in conjunction with a well-rounded trading plan.
- What is a good RSI level to buy? Generally, an RSI below 30 is considered oversold, which might be a good time to buy, but always confirm with other indicators.
- Can the RSI be used for day trading? Absolutely! Many day traders use the RSI to identify short-term price movements and potential entry and exit points.
- How often should I check the RSI? It depends on your trading strategy. For day trading, checking it frequently is essential, while swing traders may look at it less often.

Chart Patterns and Their Significance
When it comes to trading cryptocurrencies, understanding chart patterns can be a game-changer. These patterns act like a compass, guiding traders toward potential market movements. Just like a seasoned sailor reads the wind and waves, a skilled trader deciphers these visual cues to navigate the often tumultuous waters of the crypto market. By recognizing specific formations, traders can make educated guesses about future price actions, which can significantly enhance their trading strategy.
Chart patterns can be broadly categorized into two types: reversal patterns and continuation patterns. Reversal patterns signal a change in the current trend, while continuation patterns suggest that the prevailing trend will persist. Understanding these distinctions is crucial for any trader looking to optimize their strategy. For example, a trader spotting a head and shoulders pattern might prepare for a potential downturn, while recognizing a triangle pattern could indicate that the price will continue in the same direction.
Let’s dive deeper into some of the most significant chart patterns that every crypto trader should be aware of:
- Head and Shoulders: This pattern is often viewed as a signal of a trend reversal. It consists of three peaks: a higher peak (head) between two lower peaks (shoulders). When this pattern appears, it could indicate that the price is about to decline, providing traders with an opportunity to sell or short the asset.
- Triangles: Triangles can be ascending, descending, or symmetrical. They tend to form during periods of consolidation and indicate that the price could break out in either direction. Recognizing the type of triangle can help traders prepare for potential breakouts.
- Flags: Flags are continuation patterns that resemble small rectangles or parallelograms. They typically form after a strong price movement and suggest that the trend will continue in the previous direction. Traders often look for flags as confirmation of their existing positions.
Understanding these patterns is only half the battle. The real magic happens when traders combine these insights with other technical analysis tools. For instance, a trader might spot a head and shoulders pattern and also check the Relative Strength Index (RSI) to confirm whether the asset is overbought or oversold. This multi-faceted approach can lead to more informed decisions and better trading outcomes.
In conclusion, chart patterns are invaluable tools in a trader's arsenal. They not only help in predicting potential price movements but also provide a framework for making strategic decisions. By mastering these patterns and integrating them with other technical indicators, traders can significantly enhance their chances of success in the fast-paced world of cryptocurrency trading.
What are chart patterns?
Chart patterns are formations created by the movement of prices on a chart, which traders analyze to predict future price movements.
How can I identify a head and shoulders pattern?
A head and shoulders pattern consists of three peaks: a higher peak (the head) between two lower peaks (the shoulders). It typically indicates a potential trend reversal.
What is the significance of triangle patterns?
Triangle patterns indicate periods of consolidation and can signal potential breakouts in either direction, depending on the type of triangle (ascending, descending, or symmetrical).
Are flags considered reliable indicators?
Yes, flags are considered reliable continuation patterns that suggest the price will continue in the direction of the previous trend after a brief consolidation period.

Head and Shoulders
The pattern is one of the most recognized and reliable reversal patterns in technical analysis. It typically signals a change in trend direction, indicating that the price is likely to reverse from an upward trend to a downward trend. Imagine standing on a mountain peak—when you see a steep slope ahead, it’s a clear sign to prepare for a descent. Similarly, when traders spot this pattern, it's time to reassess their positions.
To identify the head and shoulders pattern, traders should look for the following characteristics:
- Left Shoulder: The price rises to a peak and then declines.
- Head: The price rises again, surpassing the previous peak, and then declines.
- Right Shoulder: The price rises a third time, but this peak is lower than the head, followed by a decline.
Once the pattern is established, the neckline is drawn by connecting the lows of the declines following the left shoulder and head. A breakout below this neckline is considered a strong signal to sell, as it confirms the reversal of the trend. To illustrate this, here's a simple table summarizing the key components of the head and shoulders pattern:
| Component | Description |
|---|---|
| Left Shoulder | First peak followed by a decline. |
| Head | Highest peak surpassing the left shoulder, followed by a decline. |
| Right Shoulder | Third peak lower than the head, followed by a decline. |
| Neckline | Line connecting the lows of the left shoulder and head. |
It’s essential to note that while the head and shoulders pattern is a powerful tool for predicting market reversals, it’s not infallible. Traders should use this pattern in conjunction with other indicators and analysis techniques to confirm their trading decisions. For instance, combining the head and shoulders pattern with volume analysis can provide additional validation. A decrease in volume during the formation of the right shoulder can indicate weakening bullish momentum, making the subsequent breakdown more reliable.
In summary, recognizing the head and shoulders pattern can significantly enhance your trading strategy. It’s like having a compass in the wilderness; it guides you toward the right direction amidst the chaos of the crypto market. However, always remember to exercise caution and utilize a comprehensive approach when making trading decisions.
Q1: What does the head and shoulders pattern indicate?
A1: The head and shoulders pattern indicates a potential reversal in trend from bullish to bearish, signaling traders to prepare for a possible price decline.
Q2: How reliable is the head and shoulders pattern?
A2: While the head and shoulders pattern is considered one of the most reliable reversal patterns, it should be used in conjunction with other technical indicators for confirmation.
Q3: What is the significance of the neckline in this pattern?
A3: The neckline is crucial as it acts as a support level. A breakout below the neckline confirms the reversal and signals a potential selling opportunity.

Triangles and Flags
In the world of cryptocurrency trading, triangles and flags are essential chart patterns that can provide traders with significant insights into potential price movements. These patterns are not just random shapes; they represent periods of consolidation where traders are uncertain about the future direction of the market. Understanding these formations can help you make informed decisions and potentially capitalize on upcoming price action.
Let's start with triangles. These patterns can be classified into three main types: ascending, descending, and symmetrical triangles. Each type has its unique implications:
- Ascending Triangle: Typically indicates bullish sentiment, as the price makes higher lows while the resistance remains constant. A breakout above the resistance level can signal a strong upward move.
- Descending Triangle: Often seen as a bearish pattern, where the price makes lower highs while the support remains constant. A breakdown below the support level can lead to significant downward movement.
- Symmetrical Triangle: This pattern shows indecision in the market, with both buyers and sellers pushing the price closer together. A breakout can occur in either direction, making it crucial to watch for confirmation.
Now, let’s dive into flags. Flags are continuation patterns that occur after a sharp price movement, followed by a period of consolidation. They resemble a small rectangle that slopes against the prevailing trend. Flags can be either bullish or bearish:
- Bullish Flag: This pattern appears after a strong upward move, followed by a brief consolidation period before the price continues to rise. Traders often look for a breakout above the flag to confirm the continuation.
- Bearish Flag: Conversely, this pattern forms after a significant downward trend, followed by a consolidation phase that suggests a continuation of the downtrend. A breakout below the flag can confirm this bearish sentiment.
Recognizing these patterns is vital for any trader looking to enhance their technical analysis skills. The key to successfully trading triangles and flags lies in waiting for a breakout and confirming it with other indicators, such as volume or momentum oscillators. For instance, if you spot a bullish flag, it's wise to see an increase in volume during the breakout to validate the move. Similarly, with triangles, confirming the breakout direction can help you avoid false signals.
In summary, triangles and flags are powerful tools in a trader's arsenal. By mastering these patterns, you can better anticipate market movements and make more informed trading decisions. Remember, patience is crucial; waiting for clear signals can often make the difference between a successful trade and a missed opportunity.
Q: How can I identify a triangle pattern on a chart?
A: Look for converging trendlines that form higher lows and lower highs. This indicates a period of consolidation before a potential breakout.
Q: What is the importance of volume in confirming triangles and flags?
A: Volume plays a critical role in confirming breakouts. A significant increase in volume during a breakout signals strength and can validate the move.
Q: Can triangles and flags appear on any time frame?
A: Yes, these patterns can occur on any time frame, but they are more reliable on higher time frames, such as daily or weekly charts.
Q: Should I use other indicators alongside triangles and flags?
A: Absolutely! Combining these patterns with indicators like moving averages or the Relative Strength Index (RSI) can provide additional confirmation and improve your trading strategy.
Developing a Trading Plan
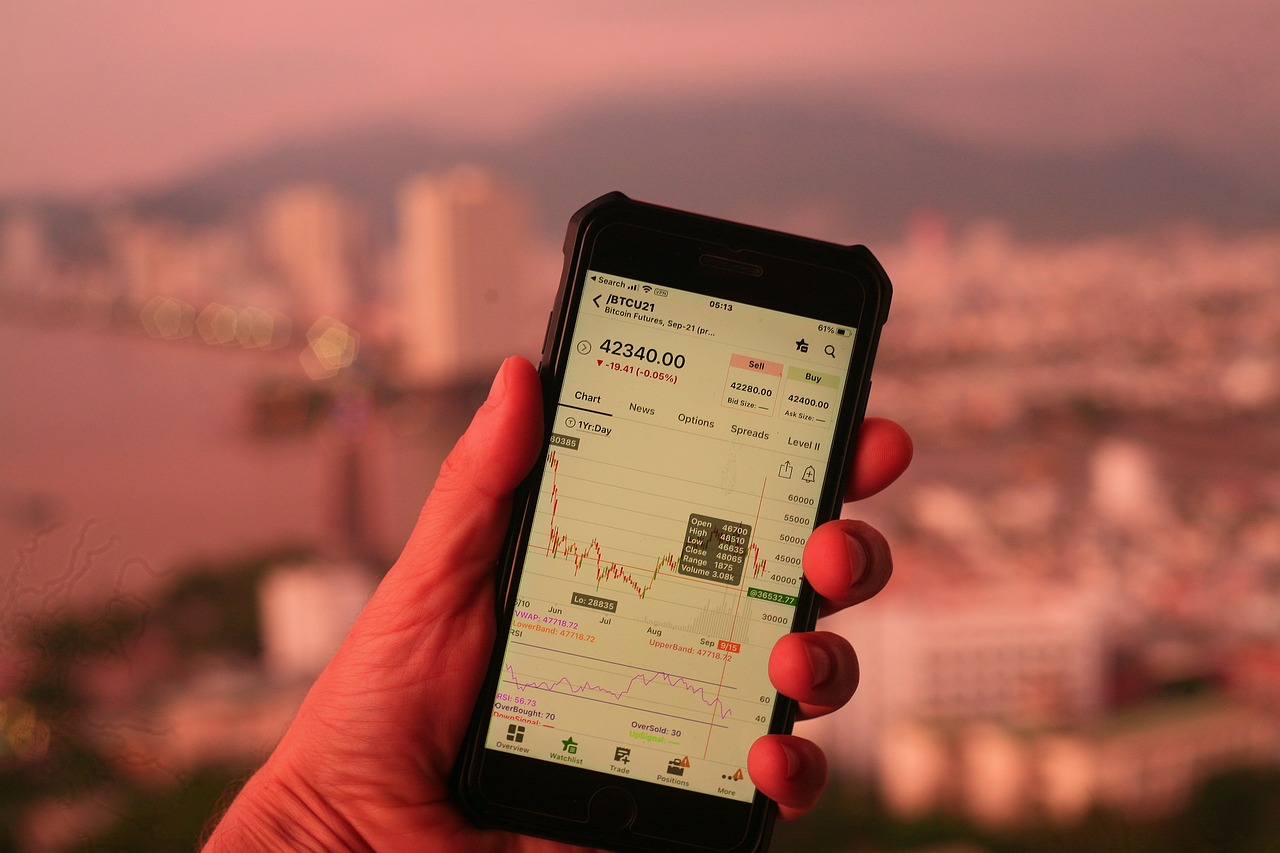
In the wild world of cryptocurrency trading, having a well-structured trading plan is akin to having a roadmap in an uncharted territory. It not only guides your decisions but also helps you navigate the volatile market with confidence. A trading plan serves as your personal blueprint, detailing your strategies, objectives, and risk management techniques. So, how do you go about crafting one? Let's break it down.
First and foremost, you need to set clear goals. What do you want to achieve? Are you looking to make a quick profit, or are you in it for the long haul? Your goals should be specific, measurable, achievable, relevant, and time-bound (SMART). For instance, rather than saying, "I want to make money," you might say, "I want to earn a 20% return on my investment within the next six months." This clarity will not only keep you focused but also help you evaluate your progress.
Next, risk management is a crucial component of your trading plan. You wouldn't go on a road trip without checking your car's brakes, right? Similarly, you need to assess how much risk you're willing to take on each trade. This involves setting stop-loss orders to limit potential losses and determining your position size based on your overall capital. For example, if you have a $10,000 trading account and decide to risk 2% on a single trade, your maximum loss would be $200. This approach helps preserve your capital for future trades and ensures you can weather the inevitable market storms.
Furthermore, your trading plan should incorporate technical analysis, as it plays a vital role in shaping your strategies. By analyzing market trends and indicators, you can make informed decisions rather than relying on gut feelings. For instance, if your analysis shows that a particular cryptocurrency is in a strong uptrend, your trading plan should specify how you will capitalize on that momentum—perhaps by setting specific entry and exit points based on your technical indicators.
Lastly, it's essential to regularly review and adjust your trading plan. The crypto market is dynamic, and what works today may not work tomorrow. By keeping track of your trades and their outcomes, you can identify patterns and refine your strategies over time. Consider maintaining a trading journal where you document your trades, the rationale behind them, and their results. This practice not only promotes accountability but also helps you learn from your mistakes and successes alike.
In summary, developing a robust trading plan is a fundamental step for anyone looking to succeed in crypto trading. By setting clear goals, managing risks effectively, utilizing technical analysis, and continuously reviewing your strategies, you can enhance your trading performance and navigate the volatile crypto landscape with greater ease.
- What is a trading plan? A trading plan is a comprehensive strategy that outlines your trading goals, risk management techniques, and the analysis methods you will use to make trading decisions.
- Why is risk management important? Risk management is crucial because it helps protect your trading capital, ensuring that you can continue trading even after experiencing losses.
- How often should I review my trading plan? It’s advisable to review your trading plan regularly, ideally after a set number of trades or at the end of each trading month, to ensure it remains effective and relevant.
- Can I adjust my trading plan? Absolutely! Your trading plan should be a living document that you adjust based on your experiences and changes in the market.

Risk Management Strategies
When it comes to crypto trading, the thrill of potential profits can sometimes overshadow the need for effective risk management. However, ignoring this crucial aspect can lead to devastating losses. Think of your trading account as a garden; without proper care and protection, it can quickly become overrun with weeds. Implementing robust risk management strategies is like nurturing that garden, ensuring it thrives and flourishes even in the most volatile conditions.
One of the most effective techniques in risk management is the use of stop-loss orders. A stop-loss order is a predetermined price at which you will exit a losing trade to prevent further losses. For instance, if you buy a cryptocurrency at $100 and set a stop-loss at $90, your position will automatically close if the price drops to $90, limiting your loss to $10. This strategy helps you maintain control over your losses and prevents emotional decision-making during market fluctuations.
Another essential component of risk management is position sizing. This refers to determining how much of your capital you will risk on a single trade. A common rule of thumb is to risk no more than 1-2% of your total trading capital on any given trade. For example, if your trading account has $10,000, risking 1% means you would only risk $100 on a single trade. By adhering to this guideline, you can withstand a series of losses without significantly impacting your overall capital.
Furthermore, diversifying your portfolio can serve as an effective risk management strategy. Instead of putting all your eggs in one basket, consider spreading your investments across various cryptocurrencies. This way, even if one asset underperforms, the others may compensate for those losses. Diversification is akin to having a balanced diet; it provides a safety net and protects you from the volatility of any single asset.
In addition to these strategies, regularly reviewing and adjusting your risk management plan is vital. The crypto market is constantly evolving, and what works today might not work tomorrow. By staying informed about market trends and reassessing your strategies, you can adapt to changes and continue to protect your capital effectively.
To summarize, incorporating effective risk management strategies into your trading approach is not just advisable; it's essential. By utilizing stop-loss orders, practicing sound position sizing, diversifying your portfolio, and regularly reviewing your strategies, you can safeguard your investments and increase your chances of long-term success in the unpredictable world of cryptocurrency trading.
- What is a stop-loss order? A stop-loss order is an instruction to sell a cryptocurrency when it reaches a certain price to limit losses.
- How much of my capital should I risk on a trade? It's generally recommended to risk no more than 1-2% of your total trading capital on any single trade.
- Why is diversification important in crypto trading? Diversification helps mitigate risk by spreading investments across different assets, reducing the impact of a poor-performing asset.
- How often should I review my risk management strategies? Regular reviews are essential, especially in the fast-paced crypto market. Adjust your strategies as needed based on market conditions.

Setting Goals and Objectives
When it comes to crypto trading, having a clear vision is like having a map in uncharted waters. Without defined goals and objectives, you may find yourself lost amidst the volatility of the market. So, how do you set effective goals that can guide your trading journey? First, it’s crucial to distinguish between short-term and long-term objectives. Short-term goals might include daily or weekly profit targets, while long-term goals could be centered around your overall portfolio growth over months or years.
One effective way to structure your goals is by using the SMART criteria. This means your goals should be Specific, Measurable, Achievable, Relevant, and Time-bound. For example, instead of saying, “I want to make money trading crypto,” you could say, “I aim to achieve a 15% return on my investment within the next three months.” This not only gives you a clear target but also makes it easier to track your progress.
Now, let’s break it down further. Here are some key components to consider when setting your trading goals:
- Risk Tolerance: Understand how much risk you are willing to take. This will help shape your trading strategy and influence your goal-setting process.
- Time Commitment: Determine how much time you can realistically dedicate to trading. This will influence whether you pursue day trading, swing trading, or long-term investing.
- Profit Expectations: Set realistic profit expectations based on your research and analysis. Remember, the crypto market can be unpredictable, so it’s essential to remain grounded.
Furthermore, regularly reviewing and adjusting your goals is vital. The crypto market is dynamic, and what seemed like a good target last month might not hold up today. By periodically reassessing your objectives, you can ensure they remain aligned with your trading performance and market conditions. This practice not only helps you stay focused but also allows you to adapt your strategies as needed.
In conclusion, setting clear and structured goals will not only enhance your trading discipline but also empower you to make informed decisions. Just like a ship needs a captain to navigate through storms, your trading journey requires well-defined objectives to steer you towards success. So, take the time to craft your trading goals, and watch how they transform your approach to the crypto market.
Q: How often should I review my trading goals?
A: It's advisable to review your trading goals at least once a month. This allows you to adjust to market changes and evaluate your performance effectively.
Q: What if I don't meet my trading goals?
A: If you find yourself consistently missing your goals, it may be time to reassess your strategy or risk tolerance. Consider seeking advice or further education in trading techniques.
Q: Can I set multiple goals at once?
A: Absolutely! However, it's essential to ensure that your goals are manageable and do not overwhelm you. Focus on a few key objectives to start with, and expand as you gain confidence.
Frequently Asked Questions
- What is technical analysis in crypto trading?
Technical analysis is a method used by traders to evaluate and predict future price movements based on historical market data, primarily focusing on price and volume. By analyzing charts and using various indicators, traders can make informed decisions in the often volatile crypto market.
- How do moving averages help in trading?
Moving averages, including Simple Moving Average (SMA) and Exponential Moving Average (EMA), help traders identify trends over specific periods. The SMA gives an average price over a set timeframe, while the EMA places more weight on recent prices, making it more responsive to new information. Both can signal potential entry or exit points for trades.
- What is the Relative Strength Index (RSI)?
The Relative Strength Index (RSI) is a momentum oscillator that measures the speed and change of price movements. It ranges from 0 to 100 and helps traders identify overbought or oversold conditions, allowing them to make better trading decisions based on market momentum.
- What are common chart patterns in crypto trading?
Common chart patterns include head and shoulders, triangles, and flags. Recognizing these patterns can provide valuable insights into potential market movements. For instance, the head and shoulders pattern often indicates a reversal, while triangles and flags suggest continuation of current trends.
- Why is a trading plan important?
A well-structured trading plan is essential for success in crypto trading as it sets clear goals, outlines risk management strategies, and incorporates technical analysis. Having a plan helps traders stay disciplined and focused, reducing emotional decision-making during trades.
- What are effective risk management strategies?
Effective risk management strategies, such as using stop-loss orders and position sizing, are crucial in minimizing potential losses. These strategies help protect your capital and ensure long-term success by allowing traders to manage their exposure to risk effectively.
- How do I set realistic trading goals?
Setting realistic trading goals involves defining clear objectives based on your trading style, risk tolerance, and market conditions. It's important to measure progress regularly and adjust your goals as necessary to stay focused and motivated throughout your trading journey.


