How to Use Technical Analysis for Long-Term Crypto Gains
In the ever-evolving world of cryptocurrency, where fortunes can be made or lost in the blink of an eye, understanding how to navigate the market is crucial. Technical analysis has emerged as a powerful tool for investors looking to achieve sustainable long-term gains. But what exactly is technical analysis, and how can it be applied to the unpredictable nature of crypto? This article will delve into the fundamentals of technical analysis, explore key indicators, and unveil chart patterns that can guide you on your investment journey. By the end, you'll be equipped with the knowledge to make informed decisions that could lead to substantial profits over time.
At its core, technical analysis involves examining price charts and market trends to forecast future price movements. Think of it as a crystal ball—one that doesn’t predict the future with certainty but offers insights based on historical data. In the context of cryptocurrency, where volatility reigns supreme, technical analysis becomes even more vital. It helps investors identify potential entry and exit points, ultimately allowing them to ride the waves of market fluctuations.
Why is this important? Well, imagine trying to navigate a ship through stormy seas without a compass. Technical analysis serves as that compass, providing direction amidst the chaos. By understanding the basic principles of technical analysis, you can develop strategies that align with your investment goals and risk tolerance.
When it comes to technical analysis, certain indicators can significantly enhance your ability to make informed trading decisions. These indicators act like signposts on your investment journey, guiding you toward potential opportunities. Among the most effective indicators are Moving Averages and the Relative Strength Index (RSI). Let’s take a closer look at each of these tools and how they can be utilized for long-term crypto investments.
Moving averages are essential for smoothing out price data and identifying trends over time. They help filter out the noise, allowing you to focus on the underlying direction of the market. There are two primary types of moving averages: the Simple Moving Average (SMA) and the Exponential Moving Average (EMA).
The Simple Moving Average is calculated by adding the closing prices over a specified period and dividing by that number of periods. For instance, a 10-day SMA would average the closing prices of the last ten days. This indicator is particularly useful for identifying long-term trends. However, it can lag behind current market conditions due to its reliance on historical data.
Here's a simple table to illustrate the calculation of the SMA:
| Day | Closing Price | 10-Day SMA |
|---|---|---|
| 1 | $50 | N/A |
| 2 | $52 | N/A |
| 3 | $54 | N/A |
| 4 | $53 | N/A |
| 5 | $55 | N/A |
| 6 | $56 | N/A |
| 7 | $57 | N/A |
| 8 | $58 | N/A |
| 9 | $59 | N/A |
| 10 | $60 | $55.4 |
The Exponential Moving Average gives more weight to recent prices, making it more responsive to new information. This can be particularly advantageous for identifying entry and exit points in long-term trades. For example, if the price crosses above the EMA, it may signal a buying opportunity, while a drop below could indicate a potential sell.
The Relative Strength Index is a momentum oscillator that measures the speed and change of price movements. It ranges from 0 to 100 and is typically used to identify overbought or oversold conditions in the market. An RSI above 70 suggests that an asset may be overbought, while an RSI below 30 indicates it may be oversold. Understanding how to interpret these values can significantly enhance your investment decisions.
Recognizing chart patterns is another critical aspect of successful technical analysis. These patterns can signal potential long-term price movements in cryptocurrencies. Some of the most common patterns include:
The Head and Shoulders pattern is a classic reversal pattern that indicates a change in trend direction. Identifying this pattern can provide valuable insights for long-term trading strategies. When you spot a head and shoulders formation, it often means that a bullish trend is about to shift to a bearish one, making it a crucial signal for investors.
Support and resistance levels are fundamental concepts in technical analysis. Support is the price level at which an asset tends to stop falling and may bounce back up, while resistance is the level at which the price tends to stop rising and may reverse downward. Identifying these levels can help you make informed long-term investment decisions. Understanding where these levels lie can be the difference between a successful trade and a missed opportunity.
- What is the best time frame for technical analysis? It varies depending on your investment strategy, but many long-term investors prefer daily or weekly charts.
- Can technical analysis predict market crashes? While it can provide insights, no method can predict crashes with certainty. It's essential to use technical analysis in conjunction with other research methods.
- How often should I analyze my investments? Regular analysis is key, but the frequency can depend on your trading style. Long-term investors may analyze less frequently than day traders.

Understanding Technical Analysis
Technical analysis is like having a crystal ball that allows you to peek into the future of the cryptocurrency market. By studying price charts and market trends, traders aim to predict future price movements. But why is this important? Well, in the fast-paced world of crypto, where prices can swing wildly in a matter of hours, having a solid grasp of technical analysis can be the difference between making a profit or taking a loss. It’s all about understanding the market's psychology and the patterns that emerge over time.
At its core, technical analysis is built on a few fundamental principles. Firstly, it assumes that all market information is already reflected in the price. This means that the price of a cryptocurrency is a direct reflection of supply and demand, and by analyzing price movements, traders can identify potential future trends. Secondly, technical analysis is based on the idea that historical price movements tend to repeat themselves. Just like how history often has a way of repeating itself, price patterns can give us clues about what might happen next.
In the context of cryptocurrency investments, technical analysis can be particularly useful. Unlike traditional markets that may be influenced by economic indicators and company performance, the crypto market is largely driven by speculation and market sentiment. This makes technical analysis even more relevant, as it allows traders to gauge the emotional state of the market and make informed decisions based on price action.
To get started with technical analysis, you don’t need to be a math whiz or a financial guru. It’s about observing and interpreting data. Here are some key components to focus on:
- Price Charts: These are the visual representations of price movements over time. Candlestick charts are particularly popular in the crypto world as they provide more information than simple line charts.
- Volume: This indicates how much of a cryptocurrency is being traded over a certain period. High volume can signify strong interest in a price movement.
- Trends: Identifying whether the market is in an uptrend, downtrend, or sideways movement can help you decide when to enter or exit a trade.
In summary, understanding technical analysis is essential for anyone looking to navigate the cryptocurrency market successfully. It empowers you to make data-driven decisions rather than relying solely on gut feelings. As you dive deeper into the world of technical analysis, you'll discover that it’s not just about numbers; it's about understanding the story that those numbers tell. So grab your charts, keep your eyes peeled for patterns, and get ready to unlock the secrets of the crypto market!

Key Indicators to Watch
When diving into the world of cryptocurrency, it's crucial to equip yourself with the right tools for analysis. Technical analysis isn't just about looking at numbers; it's about understanding the story those numbers tell. By focusing on specific indicators, you can enhance your analysis and make more informed trading decisions. So, what are these key indicators that every crypto investor should keep an eye on? Let's break down some of the most effective technical indicators that can guide your investment journey.
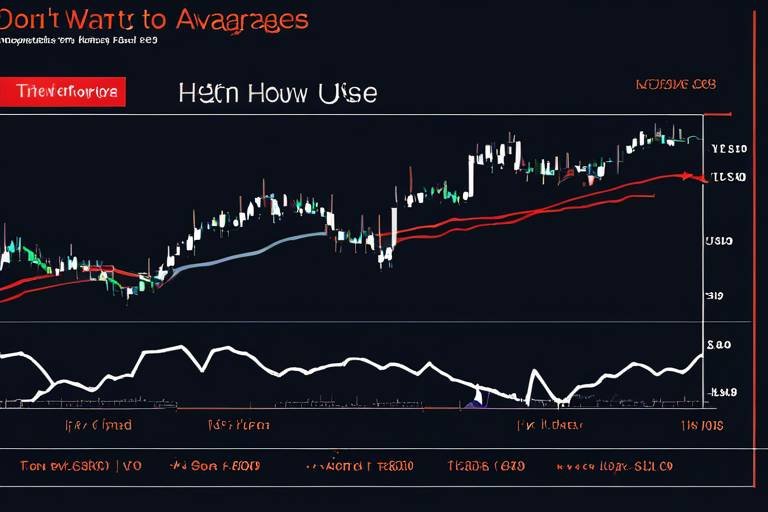
First up, we have Moving Averages. These are like the GPS of the trading world, helping you navigate through the often turbulent waters of the crypto market. Moving averages smooth out price data over a specific period, allowing you to identify trends that might not be immediately clear. By analyzing these trends, you can better understand the overall direction of a cryptocurrency's price and make decisions accordingly.
Next, we have the Relative Strength Index (RSI). Think of the RSI as your personal fitness tracker for crypto investments. It measures the speed and change of price movements, giving you insights into whether a cryptocurrency is overbought or oversold. An RSI value above 70 typically signals that an asset might be overbought, while a value below 30 indicates it could be oversold. This information can be invaluable when deciding when to enter or exit a position.
But that’s not all! There are several other indicators worth considering:
- Bollinger Bands: These bands provide a visual representation of volatility and can help you identify potential price breakouts.
- MACD (Moving Average Convergence Divergence): This indicator helps you spot changes in momentum and can signal potential buy or sell opportunities.
- Volume: Always pay attention to trading volume, as it can confirm trends and help validate price movements.
Incorporating these indicators into your trading strategy can significantly improve your chances of achieving long-term gains in the crypto market. However, it's essential to remember that no single indicator is foolproof. Instead, consider using a combination of these tools to create a more comprehensive analysis. By doing so, you'll be better equipped to navigate the highs and lows of cryptocurrency trading.
Ultimately, the key to successful trading lies in your ability to interpret these indicators effectively and make decisions based on the data at hand. Keep your eyes peeled for these essential indicators, and you just might find yourself on the path to sustainable long-term gains in the ever-evolving world of cryptocurrencies.

Moving Averages
When it comes to navigating the often turbulent waters of cryptocurrency investments, serve as your compass. These indicators help traders smooth out price fluctuations, enabling them to identify the underlying trends over time. Imagine you're trying to find your way through a foggy landscape; moving averages cut through that fog, providing clarity on where the market might be headed. They are particularly useful for long-term investors who wish to avoid the noise of daily price movements and focus on the bigger picture.
There are two primary types of moving averages that investors commonly use: the Simple Moving Average (SMA) and the Exponential Moving Average (EMA). Each type has its unique characteristics and applications, making them essential tools in an investor's toolkit. Let's dive deeper into both of these moving averages and see how they can be leveraged for long-term gains.
The Simple Moving Average (SMA) is calculated by taking the average price of a cryptocurrency over a specific number of periods. For example, a 50-day SMA takes the closing prices of the last 50 days, adds them up, and divides by 50. This method provides a straightforward view of the price trend, but it can lag behind current price movements, especially during volatile market conditions. Investors often use the SMA to identify long-term trends and potential buy or sell signals. When the price crosses above the SMA, it may indicate a bullish trend, while crossing below could signal a bearish trend.
On the other hand, the Exponential Moving Average (EMA) gives more weight to recent prices, making it more responsive to new information. This feature allows the EMA to react quicker to price changes, which can be incredibly beneficial for traders looking to capitalize on short-term movements while still maintaining a long-term perspective. The formula for calculating the EMA is a bit more complex than the SMA, but it essentially involves applying a multiplier to the most recent price, which results in a more dynamic indicator. Traders often look for crossovers between the EMA and the price line or the SMA to determine potential entry and exit points.
To illustrate the differences between these two moving averages, consider the following table:
| Feature | Simple Moving Average (SMA) | Exponential Moving Average (EMA) |
|---|---|---|
| Calculation | Average of prices over a set period | Weighted average giving more importance to recent prices |
| Responsiveness | Slower to react | Faster to react |
| Use Case | Long-term trend analysis | Short-term trading signals |
Incorporating both SMA and EMA into your technical analysis can provide a more comprehensive view of market trends. For instance, a common strategy is to use a combination of short-term and long-term moving averages to identify potential buy or sell signals. When a short-term EMA crosses above a long-term SMA, it could indicate a buying opportunity, whereas a cross below might suggest selling. This crossover strategy can be an effective way to maximize gains while minimizing risks.
In conclusion, moving averages are not just numbers on a chart; they are powerful tools that can guide your investment decisions in the ever-changing world of cryptocurrency. By understanding how to use both the SMA and EMA, you can enhance your ability to spot trends and make informed decisions that align with your long-term investment goals.
- What is the best moving average for long-term trading? The 200-day moving average is commonly used for long-term trading as it provides a clearer picture of the overall trend.
- How do I determine which moving average to use? It often depends on your trading strategy; short-term traders might prefer the EMA, while long-term investors might favor the SMA.
- Can moving averages guarantee profits? No, moving averages are tools for analysis and do not guarantee profits. They should be used in conjunction with other indicators and market analysis.

Simple Moving Average (SMA)
The is a fundamental yet powerful tool in the realm of technical analysis, especially when it comes to navigating the volatile waters of cryptocurrency investments. Essentially, the SMA calculates the average price of a cryptocurrency over a specified period, providing a clear picture of its price trends. Imagine trying to read a book while standing in a crowded subway; the SMA helps you focus on the storyline by filtering out the noise of daily price fluctuations.
To calculate the SMA, you simply add the closing prices of a cryptocurrency over a given number of time periods and then divide that total by the number of periods. For example, if you want to calculate a 10-day SMA, you would add the closing prices of the last 10 days and divide by 10. This calculation can be done easily with the following formula:
| Formula | Description |
|---|---|
| SMA (P1 + P2 + P3 + ... + Pn) / n | P1, P2, P3, ... are the closing prices for the last n days |
But why is the SMA so important? Well, it serves as a reliable indicator of market trends. When the price of a cryptocurrency is above the SMA, it typically indicates a bullish trend, while a price below the SMA suggests a bearish trend. This insight can be crucial for long-term investors looking to make informed decisions. Think of it as your compass in the unpredictable sea of crypto trading; it guides you toward potential profit while steering you away from dangerous waters.
Moreover, the SMA can be customized to suit your trading strategy. Short-term traders might prefer a 20-day SMA, while long-term investors may find more value in a 50-day or even 200-day SMA. By adjusting the timeframe, you can tailor your analysis to match your investment goals. Just like choosing the right pair of shoes for a marathon versus a casual stroll, selecting the appropriate SMA period can make all the difference in your trading success.
In addition to trend identification, the SMA can also be used to spot potential entry and exit points. For instance, when the price crosses above the SMA, it might be a signal to buy, while a cross below could indicate a sell opportunity. However, it’s essential to combine SMA analysis with other indicators for a more comprehensive view of the market. After all, relying solely on one tool is like trying to navigate a maze with just a flashlight; you need a map for the best results!

Exponential Moving Average (EMA)
The is a powerful tool in the arsenal of any serious cryptocurrency trader. Unlike the Simple Moving Average (SMA), which treats all price points equally, the EMA gives more significance to the most recent prices. This feature makes the EMA more responsive to new information, allowing traders to react faster to price changes. Imagine you're sailing a ship; the EMA is like adjusting your sails based on the latest wind direction, while the SMA is more like relying on the average wind speed over the entire journey. This responsiveness can be crucial in the volatile world of cryptocurrencies, where prices can shift dramatically in a matter of minutes.
To calculate the EMA, you first need to determine the Multiplier, which is based on the number of periods you want to analyze. The formula for the Multiplier is:
| Multiplier | Formula |
|---|---|
| 2 | 2 / (N + 1) |
Where N is the number of periods. For example, if you are calculating a 10-day EMA, the Multiplier would be 0.1818 (2 / (10 + 1)). Once you have the Multiplier, you can apply it to the most recent closing prices to find the EMA. The calculation involves taking the current closing price, multiplying it by the Multiplier, and adding it to the previous EMA multiplied by (1 - Multiplier).
One of the best ways to use the EMA is to identify entry and exit points in your trades. For instance, if the price of a cryptocurrency crosses above the EMA, it might indicate a good time to buy, as it suggests a bullish trend. Conversely, if the price falls below the EMA, it could signal a bearish trend, indicating it might be time to sell. This strategy is often referred to as the EMA crossover strategy, and it can be a strong indicator of momentum shifts in the market.
Moreover, traders often use multiple EMAs of different lengths to create a more robust trading strategy. For example, a common approach is to use both the 50-day and 200-day EMAs. When the 50-day EMA crosses above the 200-day EMA, it’s known as a Golden Cross, a bullish signal indicating that the asset might be entering a strong upward trend. Conversely, when the 50-day EMA crosses below the 200-day EMA, it’s called a Death Cross, which is generally seen as a bearish signal.
In summary, the EMA is not just a number; it's a dynamic tool that helps traders navigate the often-turbulent waters of cryptocurrency trading. By focusing on recent price movements, the EMA allows traders to make informed decisions that can lead to long-term gains. So, if you're serious about your crypto investments, incorporating the EMA into your technical analysis toolkit is essential!
- What is the main advantage of using EMA over SMA?
The EMA reacts more quickly to price changes, making it more effective for identifying trends in volatile markets. - How do I choose the right period for the EMA?
The best period depends on your trading strategy; shorter periods are better for day trading, while longer periods are more suitable for long-term investments. - Can I use EMA alone for trading decisions?
While the EMA is a powerful tool, it's recommended to use it in conjunction with other indicators for a more comprehensive analysis.

Relative Strength Index (RSI)
The is a powerful tool in the world of technical analysis, especially for those venturing into the volatile realm of cryptocurrencies. Think of the RSI as your personal fitness tracker for the market—it measures the strength and speed of price movements, helping you identify whether a cryptocurrency is overbought or oversold. This can be crucial for making informed investment decisions, especially when you're aiming for long-term gains.
So, how does the RSI work? The index ranges from 0 to 100, providing a clear visual representation of market momentum. Generally, an RSI above 70 indicates that a cryptocurrency might be overbought, suggesting that it could be due for a price correction. Conversely, an RSI below 30 signals that it may be oversold, indicating a potential buying opportunity. This is akin to checking the temperature of a soup; if it's too hot, you might want to wait before diving in, and if it's too cold, it might be time to heat things up!
To calculate the RSI, you can use the following formula:
| Formula | Description |
|---|---|
| RSI 100 - (100 / (1 + RS)) | Where RS (Relative Strength) Average Gain / Average Loss over a specified period. |
Typically, traders use a 14-day period for calculating RSI, but you can adjust this based on your trading strategy. For example, shorter periods can make the RSI more sensitive to price changes, while longer periods can smooth out the fluctuations, giving you a clearer picture of the overall trend.
Interpreting the RSI can be straightforward, yet it requires a nuanced approach. Here are some key points to consider:
- Divergence: If the price of a cryptocurrency is making new highs while the RSI is failing to do so, this could indicate a potential reversal.
- Centerline Crossover: An RSI crossing above the 50 mark suggests bullish momentum, while crossing below indicates bearish momentum.
- Overbought/Oversold Conditions: As mentioned, watch for those 70 and 30 levels, but also consider the context of the market.
Incorporating RSI into your trading strategy can significantly enhance your decision-making process. However, it's essential to remember that no single indicator should be used in isolation. The RSI should be combined with other indicators and analysis methods to confirm your trading signals. Think of it as a team effort; while the RSI provides valuable insights, it works best when paired with other tools in your technical analysis toolbox.
- What is the best RSI setting for cryptocurrencies? While many traders use a 14-day period, you can experiment with shorter or longer periods based on your trading style.
- Can the RSI be used in conjunction with other indicators? Absolutely! Combining RSI with moving averages or MACD can provide a more comprehensive view of market conditions.
- Is the RSI reliable for predicting long-term trends? The RSI is more effective for identifying short to medium-term trends, but it can complement long-term strategies when used wisely.

Chart Patterns for Long-Term Gains
When it comes to navigating the often turbulent waters of the cryptocurrency market, understanding chart patterns can be a game-changer for investors seeking long-term gains. Just like a seasoned sailor reads the wind and waves, savvy traders analyze these patterns to forecast potential price movements. These patterns, formed by the price action of cryptocurrencies over time, can provide valuable insights into market sentiment and future trends. By recognizing these formations, you can position yourself strategically to capitalize on upcoming price shifts.
One of the most significant advantages of using chart patterns is that they can help you identify entry and exit points for your investments. For instance, a bullish pattern may signal a good time to buy, while a bearish pattern could indicate that it’s time to sell. Understanding these patterns can not only enhance your trading strategy but also offer a clearer perspective on when to hold your assets for the long haul.
Among the various chart patterns, a few stand out due to their reliability and frequency of occurrence. Here are some key patterns to keep an eye on:
- Head and Shoulders: This pattern typically signals a reversal in trend, indicating that a bullish trend may be coming to an end. It consists of three peaks: a higher peak (head) between two lower peaks (shoulders).
- Double Top and Double Bottom: These patterns suggest a potential reversal. A double top indicates a bearish reversal after an uptrend, while a double bottom suggests a bullish reversal after a downtrend.
- Triangles: These patterns can be ascending, descending, or symmetrical, and they often indicate a continuation of the current trend. Traders watch for breakouts from these formations to make informed decisions.
Recognizing these patterns is just the beginning. You also need to understand their implications on your trading strategy. For example, the Head and Shoulders pattern not only signals a potential trend reversal but also helps identify the best time to exit a long position. Conversely, spotting a double bottom could be your cue to enter a position, as it often precedes a bullish rally.
To further illustrate the importance of chart patterns, let’s take a look at a simple table summarizing these patterns and their implications:
| Chart Pattern | Type | Implication |
|---|---|---|
| Head and Shoulders | Reversal | Potential bearish trend |
| Double Top | Reversal | Potential bearish reversal |
| Double Bottom | Reversal | Potential bullish reversal |
| Ascending Triangle | Continuation | Potential bullish breakout |
| Descending Triangle | Continuation | Potential bearish breakout |
In conclusion, mastering chart patterns can significantly enhance your ability to make informed decisions in the cryptocurrency market. By understanding these formations and their implications, you can better navigate the complexities of trading and position yourself for long-term success. Remember, the key is to combine your knowledge of chart patterns with other technical analysis tools to create a robust trading strategy that aligns with your investment goals.
What are chart patterns?
Chart patterns are formations created by the price movements of cryptocurrencies on a chart. They help traders predict future price movements based on historical trends.
How can I identify chart patterns?
You can identify chart patterns by analyzing price charts and looking for specific formations, such as head and shoulders, double tops, and triangles.
Are chart patterns reliable for long-term gains?
While no pattern is foolproof, chart patterns can provide valuable insights and increase the likelihood of making informed trading decisions when combined with other analysis techniques.

Head and Shoulders
The pattern is one of the most widely recognized and reliable indicators in technical analysis, especially for those looking to make long-term investments in cryptocurrencies. This pattern typically appears at the end of an uptrend and signals a potential reversal, making it crucial for traders who want to maximize their gains. Imagine you're climbing a mountain and suddenly see a steep cliff ahead—that's what this pattern signifies in the trading world. It’s a warning that the upward momentum may be about to take a nosedive!
To identify a Head and Shoulders pattern, you need to look for three peaks: the first peak (the left shoulder), a higher peak (the head), and a third peak (the right shoulder) that is lower than the head but similar in height to the left shoulder. This formation creates a sort of 'mountain' shape on the price chart, which is why it’s so visually recognizable. The neckline, which is drawn by connecting the lows of the two troughs, serves as a critical level of support. If the price breaks below this neckline, it confirms the pattern and indicates that a downward trend is likely to follow.
Here’s a quick breakdown of the Head and Shoulders pattern:
- Left Shoulder: This is the first peak, where the price rises and then falls back down.
- Head: The highest peak that forms after the left shoulder, followed by a decline.
- Right Shoulder: A peak that resembles the left shoulder but is lower than the head.
- Neckline: A horizontal line drawn at the lows of the two troughs, which acts as support.
When trading based on this pattern, it’s essential to wait for confirmation. This means that after the price breaks below the neckline, you should look for increased volume to validate the move. Think of it like waiting for the smoke to clear before jumping into action; confirmation helps ensure that you’re not making a hasty decision based on a false signal.
Moreover, the Head and Shoulders pattern can also be inverted, signaling a potential reversal from a downtrend to an uptrend. The inverted pattern is particularly useful for investors looking for entry points in a bullish market. Understanding both forms of this pattern can significantly enhance your trading strategy and help you make informed decisions.
In conclusion, the Head and Shoulders pattern is a powerful tool in your technical analysis arsenal. Whether you’re a seasoned trader or just starting, recognizing this pattern can help you navigate the often turbulent waters of the cryptocurrency market. Remember, the key to successful trading lies not just in identifying patterns, but in understanding their implications and acting accordingly.
Q: How reliable is the Head and Shoulders pattern?
A: While no pattern is foolproof, the Head and Shoulders pattern has a strong historical track record of indicating reversals, making it a reliable tool for traders.
Q: Can the Head and Shoulders pattern appear in any market?
A: Yes, this pattern can be found in various financial markets, including stocks, forex, and cryptocurrencies.
Q: What should I do if I see a Head and Shoulders pattern?
A: Wait for the price to break below the neckline with increased volume before making any trading decisions.

Support and Resistance Levels
When diving into the world of cryptocurrency trading, understanding is like having a map in an uncharted territory. These levels act as psychological barriers where price movements tend to stall or reverse, making them essential for traders looking to make informed decisions. But what exactly are these levels, and why should you care? Let's break it down!
Support levels are price points where a cryptocurrency tends to stop falling and may even bounce back up. Think of it as a safety net; when the price hits this level, buyers become more active, believing the asset is undervalued, thus increasing demand. On the flip side, resistance levels are where the price struggles to rise above. Here, sellers step in, believing the asset is overvalued, leading to increased selling pressure. This tug-of-war between buyers and sellers creates a fascinating dance that shapes the market.
Identifying these levels involves analyzing historical price data. Traders often look for previous highs and lows where the price has reversed direction. But it’s not just about spotting these levels; understanding their implications is crucial. For instance, if a price breaks through a resistance level, it can signal a potential new upward trend, while a drop below a support level might indicate a bearish market ahead.
To illustrate this further, let’s consider a simple table that highlights how support and resistance levels can change over time:
| Period | Support Level | Resistance Level |
|---|---|---|
| January | $30,000 | $40,000 |
| February | $32,000 | $42,000 |
| March | $28,000 | $45,000 |
As seen in the table, support and resistance levels can fluctuate, reflecting the market's changing sentiment. So, how do you effectively use these levels in your trading strategy? Here are a few tips:
- Always confirm with other indicators: Relying solely on support and resistance can be risky. Combine them with tools like moving averages or RSI for a more comprehensive analysis.
- Watch for breakouts: A breakout above resistance can signify a strong bullish trend, while a breakdown below support may indicate a bearish phase.
- Practice patience: Sometimes, the price may hover around these levels for a while before making a decisive move. Don’t rush your decisions!
In summary, mastering support and resistance levels is vital for any crypto trader aiming for long-term gains. By recognizing these levels and understanding their implications, you can make more informed trading decisions and navigate the volatile cryptocurrency landscape with greater confidence.
Q: How do I identify support and resistance levels?
A: Look for previous highs and lows on price charts. These points often indicate where the price has reversed in the past.
Q: Can support and resistance levels change?
A: Yes! These levels are dynamic and can shift based on market conditions and price movements.
Q: Should I rely solely on support and resistance for trading decisions?
A: While they are important, it's best to combine them with other technical indicators for a more accurate analysis.
Frequently Asked Questions
- What is technical analysis in cryptocurrency?
Technical analysis is a method used to evaluate cryptocurrencies by analyzing statistical trends from trading activity, such as price movement and volume. It helps investors predict future price movements based on historical data, which can be crucial for making informed long-term investment decisions.
- How do moving averages help in crypto trading?
Moving averages smooth out price data to help identify trends over time. By using simple moving averages (SMA) and exponential moving averages (EMA), traders can determine the overall direction of a cryptocurrency's price, which aids in making strategic entry and exit decisions for long-term investments.
- What is the Relative Strength Index (RSI) and how is it used?
The RSI is a momentum oscillator that measures the speed and change of price movements. It ranges from 0 to 100 and helps traders identify overbought or oversold conditions. A high RSI (above 70) may indicate that a cryptocurrency is overbought, while a low RSI (below 30) suggests it may be oversold, guiding investment decisions.
- How can I identify support and resistance levels?
Support and resistance levels can be identified by analyzing historical price data on charts. Support levels are price points where a downtrend can be expected to pause due to a concentration of demand, while resistance levels indicate where an uptrend may pause due to a concentration of selling interest. Recognizing these levels is essential for making informed long-term investment choices.
- What are common chart patterns to look for?
Common chart patterns include the Head and Shoulders, Double Tops and Bottoms, and Triangles. Each of these patterns can signal potential reversals or continuations in price trends, providing traders with insights into future price movements and helping them strategize their long-term investments.