Understanding the Basics of Technical Analysis for Investors
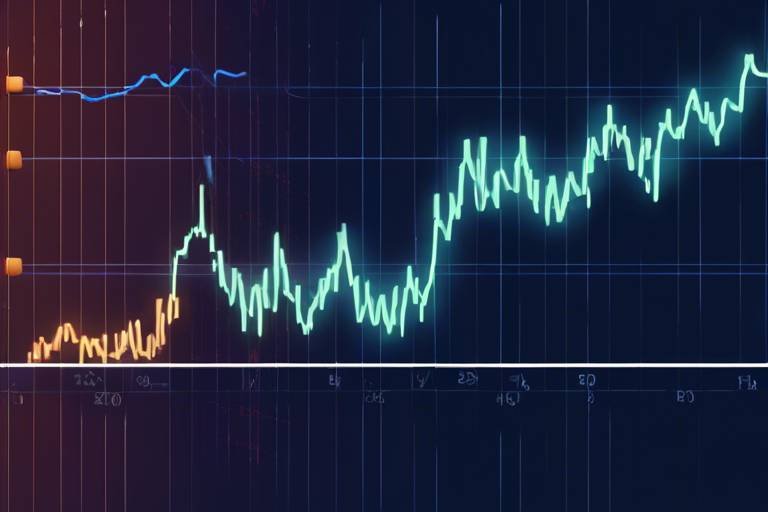
In the ever-evolving world of finance, understanding how to navigate the markets can feel like trying to find your way through a maze. Investors often seek out strategies that can give them an edge, and one of the most effective methods is technical analysis. This approach is not just a dry set of rules; it’s a dynamic way of interpreting market data that can significantly enhance your investment decisions. By analyzing historical price movements and trading volumes, technical analysis allows investors to forecast future price movements, making it an essential tool in any investor's toolkit.
Imagine you’re a detective piecing together clues to solve a mystery. Each price chart, each trend line, and each indicator is a clue that helps you understand what might happen next. The beauty of technical analysis lies in its ability to transform complex market data into actionable insights. Whether you’re a seasoned trader or a beginner, grasping the fundamentals of this analytical method can empower you to make informed decisions that align with your financial goals.
So, why is technical analysis so crucial? It serves as a window into the psychology of the market. By understanding how other investors react to price changes, you can anticipate potential market movements. This is particularly important in volatile markets, where emotions can run high and cause erratic price swings. With technical analysis, you can cut through the noise and focus on the trends that matter, allowing for more informed investment decisions.
Moreover, technical analysis is not just about predicting price movements; it’s also about timing. Knowing when to enter or exit a position can mean the difference between profit and loss. By utilizing various tools and techniques, investors can better position themselves to capitalize on market opportunities. In essence, technical analysis equips you with the knowledge to ride the waves of the market rather than getting swept away by them.
To effectively leverage technical analysis, it’s essential to familiarize yourself with some key concepts. These include support and resistance levels, trends, and chart patterns. Each of these elements plays a vital role in shaping your trading strategies and understanding market dynamics.
Support and resistance levels are like the guardrails of the market. They help investors identify potential price points where stocks may reverse or continue their trends. Understanding these levels can significantly enhance your trading strategy.
Support levels are crucial indicators that show where a stock's price tends to stop falling and may bounce back up. Think of it as a safety net for investors. When prices approach this level, it often indicates a buying opportunity, as many traders believe the price will rebound. By recognizing these levels, you can make more strategic decisions about when to buy.
On the flip side, resistance levels signify where a stock's price tends to stop rising and may reverse downwards. These levels act as a ceiling, preventing prices from climbing higher. Understanding resistance levels can help you determine when to sell or take profits, ensuring you capitalize on your investments before they potentially decline.
Chart patterns are visual representations of price movements that can provide valuable insights into potential future price actions and market sentiment. Patterns like head and shoulders or double tops can signal trend reversals or continuations. Recognizing these patterns is akin to reading the market's pulse, allowing you to anticipate movements before they happen.
Now that you have a grasp on the basic concepts, let's dive into some of the essential tools that can enhance your technical analysis. Indicators such as moving averages and the Relative Strength Index (RSI) are vital for analyzing price action and making informed trading decisions.
Moving averages are like a smoothing agent for price data. They help identify trends over specific periods, making it easier for investors to determine optimal entry and exit points. By filtering out the daily noise, moving averages provide a clearer picture of the overall market direction.
The RSI is a momentum oscillator that measures the speed and change of price movements. It assists investors in identifying overbought or oversold conditions, acting as a helpful guide for when to enter or exit trades. Think of it as your market compass, helping you navigate through the ups and downs of trading.
Creating a robust trading strategy involves more than just understanding technical analysis; it requires a combination of tools and risk management techniques. By integrating technical analysis into your trading plan, you can maximize potential returns while minimizing losses. This approach not only enhances your chances of success but also builds your confidence as an investor.
- What is technical analysis? Technical analysis is a method of evaluating securities by analyzing statistics generated by market activity, such as past prices and volume.
- Why is technical analysis important? It helps investors make informed decisions by understanding market trends and investor behavior, ultimately facilitating better timing in buying and selling.
- What are support and resistance levels? Support levels indicate where prices may stop falling, while resistance levels indicate where prices may stop rising.
- How do I use moving averages? Moving averages can help you identify trends and make decisions on when to enter or exit trades by smoothing out price fluctuations.

The Importance of Technical Analysis
Technical analysis is like the compass for investors navigating the often turbulent waters of the financial markets. It provides a structured framework for understanding market trends and investor behavior, which is essential for making informed investment decisions. By analyzing historical price movements and patterns, investors can gain insights into potential future price actions. Imagine trying to find your way in a dense forest without a map; that’s what investing can feel like without technical analysis. It helps you see the paths that others might miss.
One of the most significant advantages of technical analysis is its ability to identify market sentiment. Investors are not just numbers; they are driven by emotions, fear, and greed. Technical analysis helps in deciphering these emotions through price charts and patterns. For instance, when a stock consistently hits a certain price level, it indicates a psychological barrier for traders, which can lead to buying or selling pressure. This is where the concepts of support and resistance come into play, acting as the bedrock of technical analysis.
Moreover, technical analysis is not just for seasoned traders; it can be a valuable tool for anyone looking to invest. By utilizing various tools and techniques, even novice investors can make educated guesses about market movements. It’s like having a cheat sheet for a tough exam; while you still need to study, it can significantly boost your confidence and performance.
Incorporating technical analysis into your investment strategy allows for a more disciplined approach. Rather than making impulsive decisions based on news headlines or market rumors, investors can rely on data-driven insights. This methodical approach can help mitigate risks and enhance potential returns. Think of it as a GPS system; it not only shows you the best route to take but also warns you of potential roadblocks ahead.
In summary, technical analysis is crucial for anyone looking to succeed in the financial markets. It equips investors with the tools needed to understand market dynamics, identify trading opportunities, and make informed decisions. Whether you're a seasoned pro or just starting, embracing technical analysis can be the key to unlocking your investment potential.
- What is technical analysis? Technical analysis involves analyzing historical price data and market trends to forecast future price movements.
- How does technical analysis differ from fundamental analysis? While technical analysis focuses on price movements, fundamental analysis looks at a company's financial health and market conditions.
- Can beginners use technical analysis? Absolutely! With the right resources and tools, beginners can effectively use technical analysis to make informed investment decisions.
- What are some common technical indicators? Common technical indicators include moving averages, Relative Strength Index (RSI), and Bollinger Bands.

Key Concepts of Technical Analysis
When diving into the world of technical analysis, it’s essential to grasp some key concepts that form the backbone of this analytical approach. Understanding these concepts not only enhances your trading skills but also empowers you to make more informed decisions in the financial markets. Think of technical analysis as a map, guiding you through the unpredictable terrain of stock prices. Without understanding the landmarks, you might just get lost!
One of the first concepts to familiarize yourself with is the idea of support and resistance. These are like the safety nets and ceilings of the market, indicating where prices are likely to bounce back or break through. Support represents a price level where demand is strong enough to prevent the price from declining further, while resistance is where selling pressure tends to push prices back down. Recognizing these levels can provide you with critical insights into potential buying and selling opportunities.
Support and resistance levels are not just arbitrary lines on a chart; they are rooted in the psychology of market participants. Investors often react to these levels based on their previous experiences, leading to predictable behaviors. For instance, when a stock price approaches a support level, many investors might see it as a buying opportunity, anticipating that the price will bounce back up. Conversely, when a stock nears a resistance level, traders might be inclined to sell, expecting a price drop.
To identify support levels, traders typically look for historical price points where the stock has reversed direction in the past. These levels can often be found by examining price charts and looking for areas where the price has repeatedly bounced back. For example, if a stock has hit a price of $50 multiple times and rebounded, that $50 mark could be considered a strong support level. It’s like a trampoline—once the price hits it, it tends to bounce back up!
On the flip side, resistance levels can be identified in a similar manner. Traders look for points on the chart where the price has struggled to rise above in the past. If a stock consistently hits a price of $70 and then falls back, that $70 level acts as a ceiling. This is crucial for sellers, as they may choose to exit their positions when the stock approaches this level, anticipating a drop. Think of it as a ceiling that keeps the price from rising higher.
Chart patterns are another vital aspect of technical analysis. These patterns emerge from the price movements of stocks and can indicate potential future trends. For example, patterns like head and shoulders or double tops are signals that traders often look for. A head and shoulders pattern typically indicates a reversal from bullish to bearish, while a double top suggests that the stock may have hit its peak and is likely to decline. Recognizing these patterns can be like spotting constellations in the night sky—once you know what to look for, they become clear.
In conclusion, mastering these key concepts of technical analysis—support and resistance levels, and chart patterns—can significantly enhance your trading strategy. By understanding how these elements interact, you can better predict market movements and make more strategic investment decisions.
- What is technical analysis? Technical analysis is a method used to evaluate and predict the future price movements of stocks based on historical price data and trading volume.
- How can I identify support and resistance levels? You can identify support and resistance levels by analyzing historical price charts and looking for price points where the stock has reversed direction in the past.
- What are chart patterns? Chart patterns are formations created by the price movements of a stock on a chart, which can indicate potential future price movements. Examples include head and shoulders and double tops.
- Why is technical analysis important? Technical analysis is important because it helps investors make informed decisions based on market trends and investor behavior, potentially increasing their chances of success in trading.

Support and Resistance Levels
Understanding is like having a secret map in the world of trading. These levels act as psychological barriers where the price of a stock tends to pause, reverse, or continue its trend. Imagine you’re climbing a hill; the support level is like a flat plateau where you can catch your breath before continuing your ascent, while the resistance level is the peak where you might find it hard to climb any higher. Recognizing these levels can significantly enhance your trading strategy.
Support levels are points at which a stock's price tends to stop falling and may bounce back up. They are often identified by looking at historical price data. For instance, if a stock has repeatedly bounced back after reaching a certain price, that price is considered a support level. This is where buyers tend to step in, believing the stock is undervalued, creating a demand that pushes the price back up. The psychological aspect is crucial here; traders remember past price behaviors, and their actions can create self-fulfilling prophecies.
Conversely, resistance levels are where a stock's price tends to stop rising and may reverse downwards. Think of it as the ceiling that keeps pushing you back down every time you try to jump higher. When a stock approaches a resistance level, sellers often step in, believing the stock is overvalued. This influx of selling pressure can cause the price to drop. Identifying these levels is essential for timing your trades effectively, whether you’re looking to buy or sell.
To further clarify how support and resistance levels work, here’s a simple table that illustrates their characteristics:
| Characteristic | Support Level | Resistance Level |
|---|---|---|
| Definition | Price level where buying interest is strong enough to overcome selling pressure | Price level where selling interest is strong enough to overcome buying pressure |
| Psychological Effect | Buyers feel confident to purchase | Sellers feel confident to sell |
| Price Action | Price tends to bounce off this level | Price tends to reverse from this level |
In practice, the more times a stock tests a support or resistance level without breaking through, the stronger that level becomes. Think of it like a boxer who keeps getting knocked down but keeps getting back up; the resilience builds a reputation. Traders often use these levels to set stop-loss orders or take-profit points, ensuring they manage their risk effectively. By incorporating support and resistance levels into your trading strategy, you can make more informed decisions, increasing your chances of success.
In conclusion, mastering support and resistance levels is pivotal for any investor looking to navigate the financial markets. They provide insight into potential price movements and help in determining the best times to enter or exit trades. So next time you analyze a stock chart, remember to keep an eye on these vital levels, as they could be the key to unlocking your trading potential.
- What is the difference between support and resistance levels? Support levels indicate where the price tends to stop falling, while resistance levels indicate where the price tends to stop rising.
- How can I identify support and resistance levels? You can identify these levels by analyzing historical price data and observing where the price has reversed in the past.
- Do support and resistance levels change over time? Yes, they can change as market conditions evolve and traders' perceptions shift.

Identifying Support Levels
Identifying support levels is a fundamental aspect of technical analysis that can significantly enhance your trading strategy. Support levels are price points where a stock tends to stop falling and may even bounce back up. Think of it like a trampoline; when the price hits this level, it has a tendency to rebound, much like how you would bounce back up after hitting the trampoline's surface. This makes support levels crucial for investors looking for buying opportunities.
To effectively identify these support levels, investors often look at historical price data. Analyzing past price movements can reveal where the stock has previously found support. For example, if a stock has repeatedly bounced back after hitting a certain price point, that price can be considered a strong support level. It’s like finding a safe harbor in a storm; knowing where the price tends to stabilize can provide a sense of security in your trading decisions.
Here are some methods to identify support levels:
- Historical Price Action: Look back at the stock’s historical price chart to find levels where the price has consistently bounced back.
- Moving Averages: These can act as dynamic support levels. For instance, the 50-day or 200-day moving average might serve as a support level during an uptrend.
- Trend Lines: Drawing trend lines can help visualize potential support levels. An upward trend line drawn along the lows can indicate where support may emerge.
- Volume Profile: Areas where high trading volume occurred can also indicate support. If a lot of trading happened at a certain price, it’s likely that traders will remember that price as significant.
Understanding how to identify support levels not only aids in making informed buying decisions but also helps in setting stop-loss orders. By placing stop-loss orders just below identified support levels, investors can protect themselves from significant losses if the price unexpectedly drops. This strategy acts like a safety net, ensuring that you can exit a position before it spirals out of control.
In summary, identifying support levels is about recognizing patterns and trends in price movements. By leveraging historical data, moving averages, trend lines, and volume profiles, you can create a robust framework for your trading strategy. Remember, the more you practice identifying these levels, the more intuitive it will become, leading to more confident and informed investment decisions.
- What is a support level? A support level is a price point where a stock tends to stop falling and may bounce back up.
- How can I identify support levels? You can identify support levels by analyzing historical price data, using moving averages, drawing trend lines, and examining volume profiles.
- Why are support levels important? Support levels help investors make informed buying decisions and set stop-loss orders to manage risk effectively.
- Can support levels change over time? Yes, support levels can change based on market conditions and price action, so it's essential to continually reassess them.

Identifying Resistance Levels
Identifying resistance levels is a fundamental aspect of technical analysis that can significantly influence your trading decisions. Think of resistance as a ceiling in a room; it’s the point where prices hit a barrier and struggle to rise any further. When a stock price approaches this level, it often encounters selling pressure from investors who believe the price has peaked, creating a situation where the stock struggles to move upward. Understanding these levels can empower you to make more informed choices about when to sell or hold onto your investments.
Resistance levels are typically identified through various methods, including historical price data, trend lines, and moving averages. For instance, if a stock has previously peaked at a price of $100 multiple times, this price can be considered a resistance level. It’s essential to note that when a stock price breaks through a resistance level, it can lead to a surge in buying activity, as traders might see this as a signal that the price will continue to rise. This phenomenon is often referred to as a "breakout."
In practice, identifying resistance involves a bit of detective work. You might want to look at charts over different time frames to see where the stock has previously faced challenges in climbing higher. Here are some techniques to help you identify resistance levels:
- Historical Peaks: Look for previous high points on the price chart where the stock has struggled to rise above.
- Trend Lines: Draw lines connecting the highs on a chart; these lines can act as visual cues for potential resistance.
- Moving Averages: Sometimes, moving averages can also serve as dynamic resistance levels, particularly the 50-day and 200-day moving averages.
Moreover, it's also important to consider the volume of trades at these resistance levels. High trading volume near a resistance level can indicate strong selling pressure, while low volume might suggest a weaker barrier. When analyzing these levels, remember that they are not set in stone. Market conditions, news events, and changes in investor sentiment can all influence these levels, making them dynamic rather than static.
In conclusion, identifying resistance levels is not just about spotting a price point; it’s about understanding the psychology behind market movements. By recognizing where these ceilings lie, you can better position yourself in the market, potentially maximizing your profits while minimizing risks. So next time you're analyzing a stock, take a moment to consider its resistance levels and how they fit into your overall trading strategy.
- What is a resistance level? Resistance levels are price points on a chart where a stock tends to stop rising and may reverse direction due to selling pressure.
- How can I identify resistance levels? You can identify resistance levels by examining historical price data, trend lines, and moving averages.
- What happens when a stock breaks through a resistance level? When a stock breaks through a resistance level, it may indicate a potential continuation of the upward trend, often leading to increased buying activity.

Chart Patterns
Chart patterns are like the fingerprints of the market; they tell a story of past price movements and hint at future trends. By recognizing these patterns, investors can gain valuable insights into market sentiment and potential price movements. Just like a detective piecing together clues, understanding chart patterns can help you make informed trading decisions. Let's dive into some of the most common chart patterns that every investor should know.
One of the most recognized chart patterns is the Head and Shoulders pattern. This pattern typically indicates a reversal in trend, suggesting that a bullish market might be turning bearish. Picture a person with a head and two shoulders; the price action forms three peaks, with the middle peak being the highest - the head. When this pattern emerges, savvy investors often prepare for a shift in market direction.
Another popular pattern is the Double Top. This pattern resembles the letter "M" and occurs when the price reaches a high point twice, with a moderate decline in between. It signals that the asset might be losing momentum and could reverse direction. Recognizing a double top can be crucial for investors looking to sell before a potential downturn.
On the flip side, the Double Bottom pattern, which looks like a "W", signals a potential bullish reversal. It occurs when the price hits a low point twice with a slight rise in between, indicating that the asset might be regaining strength. For investors, spotting a double bottom can present a fantastic buying opportunity.
In addition to these patterns, there are also continuation patterns like the Flags and Pennants. These formations suggest that the current trend is likely to continue after a brief pause. Flags appear as small rectangles that slope against the prevailing trend, while pennants look like small symmetrical triangles. Both patterns can signal traders to stay in their positions or prepare for a continuation of the trend.
Understanding these chart patterns is essential, but it’s also important to remember that they are not foolproof. Market conditions can change rapidly, and patterns can fail. Therefore, combining chart pattern analysis with other technical indicators can help reinforce your trading decisions. For instance, using patterns in conjunction with volume analysis can provide additional confirmation of a potential price movement.
In summary, chart patterns are a powerful tool in the technical analysis toolkit. By recognizing and understanding these patterns, investors can better navigate the complex world of trading. Whether it's identifying potential reversals or continuation signals, mastering chart patterns can significantly enhance your trading strategies.
- What are chart patterns? Chart patterns are formations created by the price movements of an asset on a chart, which help traders predict future price movements.
- How do I identify a head and shoulders pattern? Look for three peaks: two smaller ones (the shoulders) on either side of a larger peak (the head). This pattern often suggests a reversal from bullish to bearish.
- Are chart patterns always reliable? While chart patterns can provide valuable insights, they are not foolproof. It's essential to use them in conjunction with other analysis tools.
- What is the difference between a double top and a double bottom? A double top indicates a potential bearish reversal, while a double bottom suggests a bullish reversal.

Technical Indicators and Tools
When diving into the world of technical analysis, one cannot overlook the significance of technical indicators and tools. These instruments act like a compass, guiding investors through the often turbulent waters of financial markets. By analyzing price action, volume, and other market data, these indicators help investors make informed decisions based on empirical evidence rather than gut feelings.
Among the plethora of indicators available, two stand out for their widespread use and effectiveness: Moving Averages and the Relative Strength Index (RSI). Each of these tools provides unique insights into market behavior, allowing investors to fine-tune their strategies and optimize their trading performance.
Moving averages are like the steady hand of a seasoned sailor, smoothing out the choppy waves of price fluctuations. By averaging a stock's price over a specific period, these indicators help investors identify the overall trend direction. There are two primary types of moving averages: the Simple Moving Average (SMA) and the Exponential Moving Average (EMA).
| Type | Description |
|---|---|
| Simple Moving Average (SMA) | Averages the price over a set number of periods, giving equal weight to all prices. |
| Exponential Moving Average (EMA) | Gives more weight to recent prices, making it more responsive to new information. |
Investors often use moving averages to determine entry and exit points. For instance, when the short-term moving average crosses above the long-term moving average, it may signal a buying opportunity, often referred to as a bullish crossover. Conversely, when the short-term average crosses below the long-term average, it might indicate a selling opportunity, known as a bearish crossover.
The RSI is another powerful tool in the technical analysis toolkit. This momentum oscillator measures the speed and change of price movements, providing insights into whether a stock is overbought or oversold. With values ranging from 0 to 100, the RSI helps investors gauge market sentiment. Typically, an RSI above 70 indicates that a stock is overbought, while an RSI below 30 suggests it is oversold.
Understanding the RSI can be a game-changer for investors. For example, if a stock has an RSI of 75, it may be wise to consider selling or taking profits, as the price could be due for a correction. On the flip side, if a stock's RSI drops to 25, it might represent a buying opportunity, as the price could rebound.
Incorporating these technical indicators into your trading strategy can enhance your ability to make informed decisions. However, it's crucial to remember that no single indicator is foolproof. Combining multiple indicators, along with sound risk management practices, can significantly improve your chances of success in the financial markets.
- What is the best technical indicator for beginners? While there is no one-size-fits-all answer, many beginners find moving averages and RSI straightforward and effective for analyzing market trends.
- How often should I check my technical indicators? It depends on your trading style. Day traders may check indicators multiple times a day, while long-term investors may review them weekly or monthly.
- Can I rely solely on technical indicators for trading decisions? While technical indicators are valuable, it's essential to consider other factors, such as market news and fundamental analysis, to make well-rounded trading decisions.

Moving Averages
Moving averages are one of the most popular and effective tools in technical analysis, serving as a foundational element for many traders. They help to smooth out price fluctuations over a specific period, allowing investors to identify trends more clearly without the noise of daily price changes. Imagine trying to see the overall direction of a river while standing on its banks; the moving average is like a bridge that gives you a broader view of the water's flow. By analyzing the average price over time, you can make more informed decisions about when to enter or exit trades.
There are several types of moving averages, but the two most common are the Simple Moving Average (SMA) and the Exponential Moving Average (EMA). The SMA calculates the average price over a specific number of periods, providing a straightforward representation of the price trend. On the other hand, the EMA gives more weight to recent prices, making it more responsive to new information. This responsiveness can be crucial for traders who need to react quickly to market changes.
To illustrate the difference between these two types, consider the following table that compares their characteristics:
| Type | Calculation Method | Responsiveness |
|---|---|---|
| Simple Moving Average (SMA) | Average of closing prices over a set period | Less responsive to recent price changes |
| Exponential Moving Average (EMA) | Weighted average that gives more importance to recent prices | More responsive to recent price changes |
One of the key advantages of using moving averages is their ability to help identify potential entry and exit points. For instance, when a stock's price crosses above its moving average, it can signal a buying opportunity, whereas a cross below may indicate a selling opportunity. This concept is often referred to as a "crossover," and it can be a powerful strategy for traders looking to capitalize on market momentum.
Additionally, moving averages can be used to identify support and resistance levels. When the price approaches a moving average from above, it may act as a support level, while if it approaches from below, it may serve as a resistance level. This dual functionality makes moving averages a versatile tool in any trader's arsenal.
In conclusion, moving averages are not just simple mathematical calculations; they are vital indicators that can provide valuable insights into market trends and potential price movements. Whether you are a novice or an experienced trader, understanding how to use moving averages effectively can enhance your trading strategy and improve your chances of success in the financial markets.
- What is the best moving average to use? The best moving average depends on your trading style. Short-term traders may prefer the EMA for its responsiveness, while long-term investors might favor the SMA for its stability.
- How do I set up moving averages on my trading platform? Most trading platforms allow you to customize indicators. Simply select the moving average tool and choose your desired period (e.g., 50-day or 200-day).
- Can moving averages guarantee profits? No, moving averages are tools that help identify trends and potential entry/exit points, but they do not guarantee profits. It's essential to combine them with other analysis methods.

Relative Strength Index (RSI)
The is a powerful tool that every investor should have in their technical analysis toolkit. Developed by J. Welles Wilder Jr., this momentum oscillator measures the speed and change of price movements. Essentially, it helps you gauge whether a stock or asset is overbought or oversold, which can be crucial for making timely trading decisions. Imagine you're standing in front of a crowded market; the RSI acts like a seasoned guide, showing you when to buy low and sell high.
Typically, the RSI ranges from 0 to 100, with levels above 70 indicating that an asset may be overbought, while levels below 30 suggest it might be oversold. This simple yet effective range allows investors to quickly assess market conditions. For instance, if you see an RSI reading of 75, it could be a red flag that the asset is due for a correction. Conversely, an RSI of 25 might signal a buying opportunity, as the asset could rebound after a significant drop.
To make the most out of the RSI, it's essential to look at it in conjunction with other indicators and market trends. Just like a chef wouldn’t rely solely on one ingredient to create a delicious dish, you shouldn't depend only on the RSI for your trading decisions. For example, combining the RSI with support and resistance levels can give you a clearer picture of when to enter or exit a trade. If the RSI shows an overbought condition while the price hits a resistance level, it may be wise to consider selling or shorting the asset.
Here's a quick look at how to interpret the RSI:
| RSI Value | Interpretation |
|---|---|
| 0 - 30 | Oversold (Potential buying opportunity) |
| 30 - 70 | Neutral (Market is in balance) |
| 70 - 100 | Overbought (Potential selling opportunity) |
In conclusion, the RSI is more than just a number; it’s a valuable insight into market sentiment. By incorporating the RSI into your trading strategy, you can better navigate the ups and downs of the financial markets. Remember, the key to successful trading lies in understanding the tools at your disposal and knowing when to use them.
- What is the best RSI level to use for trading? While levels above 70 and below 30 are commonly used, it’s essential to consider market context and combine the RSI with other indicators.
- Can the RSI be used for all types of assets? Yes, the RSI can be applied to stocks, commodities, forex, and cryptocurrencies.
- How often should I check the RSI? It depends on your trading style. Day traders might check it frequently, while long-term investors may look at it less often.

Developing a Trading Strategy
Creating a robust trading strategy is akin to crafting a masterful recipe; it requires the right ingredients, precise measurements, and a dash of creativity. The foundation of any successful trading strategy lies in the careful integration of technical analysis tools and risk management techniques. By doing so, investors can maximize their potential returns while minimizing the risk of significant losses. Just like a seasoned chef knows when to tweak a recipe based on the ingredients at hand, a good trader must adapt their strategy according to market conditions.
To begin with, it's essential to outline your trading goals. Are you looking for short-term gains, or do you prefer a long-term investment approach? Defining your objectives will guide your strategy and help you choose the right tools. For instance, day traders may rely heavily on technical indicators and quick price movements, while long-term investors might focus more on fundamental analysis combined with technical insights.
Next, consider the significance of risk management. This is where many traders falter. A well-crafted strategy should include clear rules for when to enter and exit trades, as well as guidelines on how much capital to risk on each trade. A common rule of thumb is the 1% risk rule, which suggests that no more than 1% of your total trading capital should be risked on a single trade. This approach helps to safeguard your portfolio from drastic downturns.
| Strategy Component | Description |
|---|---|
| Entry Points | Identifying optimal times to enter a trade based on technical indicators. |
| Exit Points | Establishing clear criteria for closing a trade, whether for profit or loss. |
| Risk Management | Implementing rules to limit losses and protect capital. |
Moreover, backtesting your strategy is crucial. This process involves applying your trading rules to historical data to see how they would have performed. It’s like trying out a new dish before serving it at a dinner party; you want to ensure it’s delicious and works as intended. Backtesting helps you refine your strategy, identify potential pitfalls, and build confidence in your trading approach.
Finally, stay adaptable. The financial markets are dynamic and ever-changing, much like the seasons. A strategy that works well today may not be as effective tomorrow. Regularly reviewing your performance and making necessary adjustments is key to long-term trading success. Always be on the lookout for new tools and techniques that can enhance your strategy.
- What is the best trading strategy for beginners?
For beginners, a simple strategy that combines basic technical analysis with sound risk management principles is often the best approach. Focus on learning the fundamentals before diving into more complex strategies.
- How can I manage risk effectively?
Effective risk management involves setting clear stop-loss orders, diversifying your portfolio, and adhering to the 1% risk rule to protect your trading capital.
- How often should I review my trading strategy?
It’s advisable to review your trading strategy regularly, at least once a month, to assess its effectiveness and make adjustments based on market conditions.
Frequently Asked Questions
- What is technical analysis?
Technical analysis is a method used by investors to evaluate and forecast the future price movements of assets based on historical price data and trading volume. It involves analyzing charts and various indicators to identify patterns and trends that can inform trading decisions.
- Why is technical analysis important for investors?
Technical analysis is crucial for investors because it helps them understand market trends and investor behavior, allowing for more informed decisions. By analyzing past price movements, investors can identify potential entry and exit points, ultimately enhancing their chances of making profitable trades.
- What are support and resistance levels?
Support and resistance levels are critical concepts in technical analysis. Support levels indicate price points where a stock tends to stop falling and may bounce back up, while resistance levels signify where a stock's price tends to stop rising and may reverse downwards. Recognizing these levels can help investors make better trading decisions.
- How can I identify support and resistance levels?
Support and resistance levels can be identified by analyzing historical price charts. Look for price points where the asset has frequently reversed direction, as these levels often indicate where buying or selling pressure is strongest. Tools like trend lines and moving averages can also assist in pinpointing these levels.
- What are some common chart patterns?
Common chart patterns include head and shoulders, double tops and bottoms, triangles, and flags. Each pattern can provide insights into potential future price movements and market sentiment. By recognizing these patterns, investors can better anticipate market behavior and make informed trading decisions.
- What are moving averages and how are they used?
Moving averages are indicators that smooth out price data over a specific period, helping investors identify trends. They can be used to determine entry and exit points by indicating when a stock is trending upwards or downwards. Common types include simple moving averages (SMA) and exponential moving averages (EMA).
- What is the Relative Strength Index (RSI)?
The Relative Strength Index (RSI) is a momentum oscillator that measures the speed and change of price movements. It ranges from 0 to 100 and helps investors identify overbought or oversold conditions in the market, providing insights into potential price reversals.
- How do I develop a trading strategy using technical analysis?
To develop a trading strategy using technical analysis, combine various tools and indicators, such as moving averages and RSI, with risk management techniques. Set clear entry and exit points based on your analysis, and always ensure that your strategy aligns with your financial goals and risk tolerance.