How to Use Technical Analysis to Understand Market Trends
In the fast-paced world of trading, understanding market trends can feel like trying to catch smoke with your bare hands. Technical analysis is your net, allowing you to grasp those elusive market movements and make informed decisions. This article explores the fundamentals of technical analysis, its key tools, and how traders can effectively utilize it to identify and interpret market trends for better trading decisions.
At its core, technical analysis involves evaluating market data, primarily price and volume, to forecast future market movements. Think of it as looking at the footprints left in the sand to predict the direction of the tide. By analyzing historical data, traders can identify patterns and trends that can indicate where the market might be headed next. The significance of this approach lies in its ability to provide insights that are not always visible through fundamental analysis alone. In a nutshell, technical analysis is about understanding the psychology of the market and the behavior of traders.
Traders use various tools like charts, indicators, and patterns to analyze market trends. Each tool serves a specific purpose and can provide unique insights into market behavior. The essential tools of technical analysis include:
- Charts - Visual representations of price movements over time.
- Indicators - Mathematical calculations based on price and volume data.
- Patterns - Recognizable formations that can signal future price movements.
By mastering these tools, traders can enhance their ability to make informed trading decisions and improve their chances of success in the market.
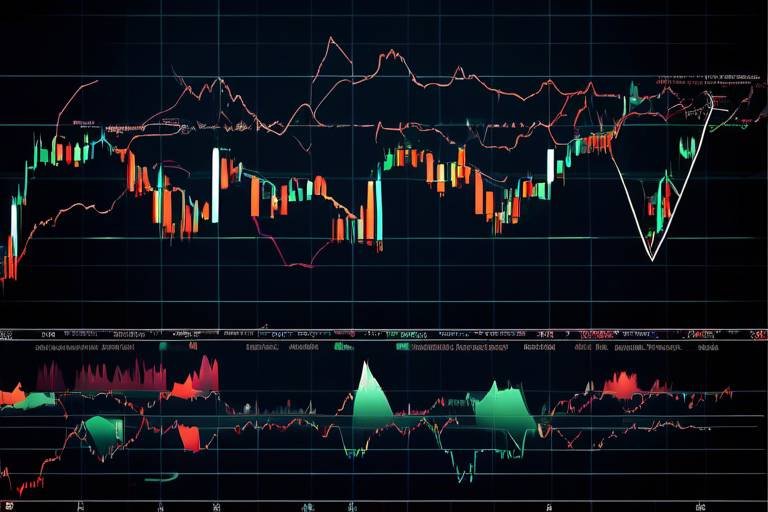
Charts are the backbone of technical analysis, providing a visual representation of market data. Different types of charts, such as line, bar, and candlestick charts, are used to visualize price movements. Understanding these charts is crucial for effective analysis.
Line charts provide a simple view of price movements over time. They connect closing prices with a continuous line, making it easy to identify trends. While they may lack the detail of other chart types, their simplicity allows traders to quickly gauge the overall direction of the market. For instance, if the line is moving upwards, it indicates a bullish trend, while a downward slope suggests bearish sentiment.
Candlestick charts offer more detailed information about price movements. Each candlestick represents a specific time period and includes the open, close, high, and low prices. This additional information allows traders to analyze market sentiment more effectively. For example, a long green candlestick indicates strong buying pressure, while a long red candlestick suggests significant selling pressure. Understanding how to read these candles can be a game-changer in identifying market trends.
Technical indicators, such as moving averages and the Relative Strength Index (RSI), help traders gauge market momentum and strength. These indicators are essential for confirming trends and making more informed trading decisions. For instance, moving averages smooth out price data to identify the direction of the trend, while the RSI measures the speed and change of price movements, helping traders identify overbought or oversold conditions. By incorporating these indicators into their analysis, traders can enhance their ability to predict market movements.
Recognizing market trends is crucial for successful trading. By identifying upward, downward, and sideways trends, traders can position themselves to capitalize on potential opportunities. The key to identifying these trends lies in understanding various methods and tools available for analysis.
Support and resistance levels are vital for determining price movement boundaries. Support is the price level where a downtrend can be expected to pause due to a concentration of demand, while resistance is where an uptrend can pause due to a concentration of supply. Identifying these levels can help traders make informed decisions about entry and exit points. For example, if a stock repeatedly bounces off a support level, it may indicate a strong buying interest at that price, making it a potential entry point for traders.
Drawing trend lines helps visualize market direction. By connecting the highs or lows of price movements, traders can create a visual representation of the trend. An upward trend line indicates bullish sentiment, while a downward trend line suggests bearish sentiment. Understanding how to create and interpret trend lines is essential for effective trading strategies. For instance, if the price breaks above a downward trend line, it may signal a potential reversal and a buying opportunity.
Q: What is the best time frame for technical analysis?
A: The best time frame depends on your trading style. Day traders often use shorter time frames, while swing traders might prefer daily or weekly charts.
Q: Can technical analysis guarantee profits?
A: No, technical analysis cannot guarantee profits, but it can improve your chances of making informed decisions based on market trends.
Q: How often should I update my technical analysis?
A: It’s essential to update your analysis regularly, especially in volatile markets. Stay informed about market news and trends to make timely decisions.

Understanding Technical Analysis
Technical analysis is like having a crystal ball into the financial markets. It involves evaluating market data, primarily focusing on price and volume, to forecast future market movements. Imagine trying to predict the weather; just as meteorologists analyze temperature, humidity, and wind patterns, traders dissect charts and indicators to make informed decisions. This approach is significant because it allows traders to identify trends, reversals, and potential entry and exit points in the market.
At its core, technical analysis is built on a few fundamental principles. Firstly, it operates on the idea that all information is already reflected in the price. This means that market participants have already accounted for news, earnings reports, and economic indicators in the prices we see on charts. Secondly, prices move in trends. Understanding whether a market is trending upwards, downwards, or sideways can significantly influence trading strategies. Lastly, history tends to repeat itself. By studying past price movements and patterns, traders can anticipate future behavior, much like how we learn from history to avoid repeating mistakes.
While diving into technical analysis, traders utilize a variety of tools and techniques to help them interpret the data. These tools can be categorized into several types, including charts, indicators, and patterns. Each of these plays a crucial role in painting a complete picture of market dynamics.
To give you a clearer understanding, here’s a quick overview of the significance of technical analysis:
| Principle | Description |
|---|---|
| Price Reflects Information | All available information is reflected in the price of an asset. |
| Market Trends | Prices move in trends; identifying these trends is essential for trading success. |
| Historical Patterns | Past price movements can help predict future behavior. |
In summary, technical analysis is a powerful tool for traders looking to navigate the complex world of financial markets. By understanding its principles and utilizing the right tools, traders can enhance their ability to make informed decisions and ultimately improve their trading outcomes. Whether you're a seasoned trader or just starting, mastering technical analysis can be the key to unlocking your trading potential.

Key Tools of Technical Analysis
When it comes to navigating the often turbulent waters of financial markets, having the right tools at your disposal can make all the difference. Technical analysis is no different; it relies on a variety of key instruments to help traders make sense of market trends and price movements. Understanding these tools is essential for anyone looking to enhance their trading strategies and make informed decisions.
At the heart of technical analysis are charts, which serve as the primary means of visualizing market data. These charts provide a graphical representation of price movements over time, allowing traders to spot trends and patterns that may not be immediately apparent in raw data. There are several types of charts, each offering unique insights into market behavior. For example, line charts give a straightforward view of price changes, while candlestick charts provide a more detailed look at price action, including opening, closing, high, and low prices within a specific timeframe.
In addition to charts, traders often rely on technical indicators to enhance their analysis. Indicators are mathematical calculations based on price and volume data that help traders identify potential market trends and reversals. Some of the most popular indicators include:
- Moving Averages: These smooth out price data to identify the direction of the trend over a specific period.
- Relative Strength Index (RSI): This momentum oscillator measures the speed and change of price movements to identify overbought or oversold conditions.
- Bollinger Bands: These bands expand and contract based on market volatility, providing insights into potential price breakouts.
Another crucial aspect of technical analysis is the use of patterns. Market patterns can reveal potential future price movements based on historical data. Recognizing these patterns, such as head and shoulders or double tops, allows traders to anticipate market behavior and make strategic decisions. Understanding the psychology behind these patterns can also provide insight into market sentiment, helping traders gauge whether the market is bullish or bearish.
Furthermore, traders often utilize volume analysis as a complementary tool to assess the strength of a price movement. Volume refers to the number of shares or contracts traded in a security or market during a given period. By analyzing volume alongside price movements, traders can validate trends and identify potential reversals. For instance, a price increase accompanied by high volume might indicate strong buyer interest, while a price increase on low volume could suggest a lack of conviction in the move.
In summary, the key tools of technical analysis—charts, indicators, patterns, and volume analysis—are essential for traders looking to navigate the complexities of the market. By mastering these tools, traders can enhance their ability to identify trends, make informed decisions, and ultimately improve their trading outcomes.
Q1: What is the most important tool in technical analysis?
A1: While all tools are important, many traders consider charts to be the most crucial as they provide the visual representation of price movements, allowing for easier trend identification.
Q2: How do I choose the right technical indicators?
A2: The choice of indicators often depends on individual trading strategies. It's best to experiment with different indicators and see which ones align with your trading style and goals.
Q3: Can I rely solely on technical analysis for trading?
A3: While technical analysis is a powerful tool, it's advisable to combine it with fundamental analysis and other market insights for a more comprehensive trading approach.

Charts and Their Types
When it comes to technical analysis, charts are your best friends. They serve as visual representations of price movements over time, allowing traders to spot trends and make informed decisions. Think of charts as the canvas where the story of the market unfolds. Each chart type has its own unique way of conveying information, making it essential to choose the right one for your trading strategy. Let's dive into the most common types of charts you'll encounter in the world of trading.
Line charts are the simplest form of chart used in technical analysis. They plot a line that connects closing prices over a specified time period. This straightforward approach makes it easy to see the overall trend of a security. Imagine drawing a line from point A to point B; it gives you a clear view of the direction in which the price is moving. Line charts are particularly useful for identifying long-term trends, but they can lack the detail needed for short-term trading decisions.
If line charts are the basic building blocks, then candlestick charts are like a beautifully detailed painting. These charts provide a wealth of information by depicting the open, high, low, and close prices for a specific time period. Each "candlestick" represents a set time frame, and the body of the candlestick shows the price range between the open and close. The wicks (or shadows) extend above and below the body to indicate the high and low prices during that time. This detailed representation allows traders to analyze market sentiment and potential reversals more effectively.
| Chart Type | Features | Best For |
|---|---|---|
| Line Chart | Simple, shows closing prices | Long-term trend analysis |
| Candlestick Chart | Open, high, low, close information | Short-term trading and sentiment analysis |
| Bar Chart | Similar to candlestick, but less visual detail | Understanding price volatility |
In addition to line and candlestick charts, there are also bar charts, which provide a similar level of detail to candlestick charts but with a different visual representation. Bar charts display the same open, high, low, and close data but use vertical lines to represent the price range, with horizontal dashes on the left and right indicating the open and close prices, respectively. While they may not be as visually intuitive as candlestick charts, they still hold significant value for traders who prefer this style.
Ultimately, the choice of which chart type to use depends on your trading style and the information you wish to convey. Some traders prefer the simplicity of line charts for long-term analysis, while others might rely on the intricate details provided by candlestick charts for short-term trading strategies. Understanding how to read these charts effectively is crucial for interpreting market trends and making sound trading decisions.
- What is the main difference between line charts and candlestick charts? Line charts show only closing prices, while candlestick charts provide a more detailed view of price action, including open, high, low, and close.
- Which chart type is best for beginners? Line charts are often recommended for beginners due to their simplicity and ease of understanding.
- Can I use multiple chart types simultaneously? Absolutely! Many traders use a combination of chart types to get a comprehensive view of the market.
Line Charts
Line charts are one of the most fundamental tools in technical analysis, offering a clear and concise way to visualize price movements over a specified period. Imagine standing at the edge of a vast landscape, where each peak and valley represents a price point in the market. With line charts, you can easily trace the path of price movements, making it easier to identify trends that may influence your trading decisions.
Constructing a line chart is quite simple. It connects a series of data points, typically closing prices, with straight lines. Each point on the chart represents a price at a specific time, allowing traders to see the overall direction of the market at a glance. This simplicity is what makes line charts so appealing to both novice and experienced traders alike. They strip away the noise and focus on the essential movement of prices, providing a clean view of the market's trajectory.
One of the key benefits of using line charts is their ability to highlight trends over time. By observing the slope of the line, traders can quickly determine whether the market is moving upward, downward, or sideways. For instance:
- Upward Trend: If the line slopes upward from left to right, it indicates that prices are increasing over time.
- Downward Trend: Conversely, a downward slope signals a decrease in prices.
- Sideways Trend: A horizontal line suggests that prices are stable, with no significant movement in either direction.
Moreover, line charts can be enhanced by adding additional data points, such as moving averages, which help smooth out price fluctuations and provide a clearer picture of the underlying trend. This combination allows traders to make more informed decisions based on historical data and market behavior.
However, while line charts are excellent for identifying trends, they do have some limitations. For example, they do not provide detailed information about price fluctuations within a specific time frame, such as opening and closing prices, which can be crucial for day traders. Therefore, it's often beneficial to use line charts in conjunction with other chart types, like candlestick charts, to gain a more comprehensive understanding of market dynamics.
In summary, line charts serve as a powerful yet straightforward tool in the arsenal of technical analysis. They offer a clear visualization of price movements, enabling traders to identify trends quickly and make informed trading decisions. So, whether you're a seasoned trader or just starting, incorporating line charts into your analysis can significantly enhance your market understanding.
1. What is the main advantage of using line charts?
Line charts provide a clear and simple visualization of price movements, making it easy to identify trends without the clutter of too much data.
2. Can line charts be used for all types of trading?
While line charts are versatile, they are particularly beneficial for longer-term trading strategies. For short-term trading, combining them with other chart types, like candlestick charts, may be more effective.
3. How do I interpret an upward trend in a line chart?
An upward trend in a line chart indicates that prices are increasing over time, suggesting a bullish market sentiment.

Candlestick Charts
Candlestick charts are an essential tool in the world of technical analysis, providing traders with a vivid representation of price movements over a specific period. Unlike line charts, which merely connect price points, offer a wealth of information at a glance. Each candlestick represents four critical data points: the open, close, high, and low prices for a given time frame, whether it be minutes, hours, or days. This intricate structure enables traders to grasp market sentiment and potential future movements more effectively.
Each candlestick consists of a body and wicks (or shadows). The body represents the range between the opening and closing prices, while the wicks illustrate the highest and lowest prices during that period. For instance, if the closing price is higher than the opening price, the body is typically filled with a lighter color (often green or white), indicating bullish sentiment. Conversely, if the closing price is lower, the body will be darker (often red or black), signaling bearish sentiment. This visual distinction allows traders to quickly assess the market's mood.
Understanding the various formations of candlesticks is crucial for making informed trading decisions. Here are some common candlestick patterns that traders often look for:
- Doji: A candlestick with a very small body, indicating indecision in the market.
- Hammer: A bullish reversal pattern that appears after a downtrend, characterized by a small body and a long lower wick.
- Engulfing Pattern: A two-candle pattern where the second candle completely engulfs the first, signaling a potential reversal.
By analyzing these patterns, traders can gain insights into potential reversals or continuations of trends. For instance, a series of bullish candlesticks may indicate a strong upward trend, while the appearance of a bearish engulfing pattern could suggest a potential downturn. The ability to read these signals effectively can make a significant difference in trading outcomes.
Moreover, candlestick charts can be combined with other technical indicators to enhance decision-making. For example, traders might look for a bullish candlestick pattern at a support level confirmed by a moving average crossover. This confluence of signals can bolster confidence in a trading decision, making it more likely to succeed.
In summary, candlestick charts are more than just pretty visuals; they are a powerful tool for technical analysis. By understanding their structure and recognizing key patterns, traders can interpret market trends with greater accuracy. As you delve deeper into the world of trading, mastering candlestick charts will undoubtedly enhance your ability to make informed decisions and navigate the often volatile waters of the financial markets.
Q1: What is the primary advantage of using candlestick charts over other chart types?
A1: The primary advantage is the rich information provided by each candlestick, which includes open, close, high, and low prices, allowing for a more nuanced understanding of market sentiment and potential price movements.
Q2: How can I practice reading candlestick patterns?
A2: You can practice by analyzing historical price charts and identifying candlestick patterns. Many trading platforms also offer demo accounts where you can practice in real-time without financial risk.
Q3: Are candlestick patterns reliable for predicting market movements?
A3: While candlestick patterns can provide valuable insights, they are not foolproof. It's essential to use them in conjunction with other technical indicators and market analysis for better accuracy.

Technical Indicators
When diving into the world of trading, understanding is like having a compass on a foggy day. These tools help traders make sense of the chaos of price movements and market behaviors. Essentially, technical indicators are mathematical calculations based on price, volume, or open interest data that traders use to analyze market trends and make informed decisions. They serve as a guide, highlighting potential entry and exit points and providing insights into market momentum.
There are two primary types of technical indicators: leading indicators and lagging indicators. Leading indicators aim to predict future price movements, giving traders a head start on potential market changes. In contrast, lagging indicators follow price movements and confirm trends after they’ve occurred. Both types have their place in a trader's toolkit, and understanding how to use them effectively can significantly enhance trading strategies.
Some of the most popular technical indicators include:
- Moving Averages (MA): These indicators smooth out price data to identify trends over a specific period. They can help traders spot potential reversals or confirm ongoing trends.
- Relative Strength Index (RSI): This momentum oscillator measures the speed and change of price movements. RSI values range from 0 to 100, with values above 70 indicating overbought conditions and below 30 indicating oversold conditions.
- Moving Average Convergence Divergence (MACD): This trend-following momentum indicator shows the relationship between two moving averages of a security’s price. It helps traders identify potential buy and sell signals.
Utilizing these indicators can provide a clearer picture of market conditions. For example, the Moving Average can help smooth out price fluctuations and identify the overall trend direction. If the price is above the moving average, it might indicate an upward trend, while a price below suggests a downward trend. Meanwhile, the RSI can alert traders to potential reversals by indicating when a market may be overbought or oversold, which is crucial for making timely decisions.
However, it's essential to remember that no single indicator is foolproof. The best approach often involves using a combination of indicators to confirm trends and signals. This method, often referred to as "confluence," can help traders filter out false signals and make more reliable decisions. For instance, if both the RSI and MACD indicate a potential buy signal, it may provide stronger assurance than relying on just one indicator.
Furthermore, understanding the market context is vital. Indicators can behave differently in various market conditions. For instance, during a strong trending market, lagging indicators may provide late signals, while leading indicators might give false signals during sideways movements. Therefore, it's crucial to adapt your strategy based on the current market environment.
In conclusion, technical indicators are indispensable tools for traders looking to navigate the complexities of market trends. By mastering these indicators and understanding their strengths and limitations, traders can enhance their decision-making process and ultimately improve their trading performance.

Identifying Market Trends
Recognizing market trends is crucial for successful trading, and it’s like having a compass that guides you through the unpredictable waters of the financial markets. Just as a sailor relies on the stars to navigate, traders must rely on technical analysis to pinpoint the direction of price movements. But how do you actually identify these trends? It's not as daunting as it might seem! By understanding a few key concepts, you can enhance your trading strategies and make more informed decisions.
Market trends can be categorized into three primary types: upward trends, downward trends, and sideways trends. Each type provides valuable insights into market sentiment and potential future movements. An upward trend, for instance, indicates that buyers are in control, pushing prices higher. Conversely, a downward trend suggests that sellers are dominating, leading to declining prices. And then there’s the sideways trend, where prices move within a relatively stable range, indicating indecision in the market.
To identify these trends effectively, traders often utilize various tools and techniques. One of the most significant methods involves analyzing support and resistance levels. These levels act as psychological barriers where price movements tend to pause or reverse. Support levels are the price points where buying interest is strong enough to overcome selling pressure, while resistance levels are where selling interest outweighs buying pressure. Understanding these levels can help traders anticipate potential price reversals or breakouts.
Another essential tool in identifying market trends is the use of trend lines. Drawing trend lines is akin to sketching a roadmap for price movements. By connecting the highs or lows of price data, traders can visualize the direction of the market. For instance, in an upward trend, a trend line is drawn along the ascending lows, while in a downward trend, it connects the descending highs. This visual representation not only helps in confirming trends but also assists in predicting potential entry and exit points for trades.
Moreover, combining trend lines with other technical indicators can provide even deeper insights. For example, when a price breaks through a trend line accompanied by a significant volume increase, it often signals a strong continuation of the trend. This is where the magic of technical analysis truly shines, as it allows traders to make decisions based on data rather than emotions.
In summary, identifying market trends is a fundamental skill for any trader. By leveraging support and resistance levels, drawing trend lines, and incorporating technical indicators, traders can enhance their ability to forecast market movements. Remember, the goal is not just to predict the future but to understand the market's rhythm and flow. So, the next time you look at a price chart, think of it as a dance between buyers and sellers, and you'll be better equipped to join in!
- What is a market trend? A market trend refers to the general direction in which the price of an asset is moving over a certain period.
- How can I identify an upward trend? An upward trend is identified by consistently higher highs and higher lows in price movements.
- What are support and resistance levels? Support levels are price points where buying interest is strong enough to prevent the price from falling further, while resistance levels are where selling interest prevents the price from rising.
- Why are trend lines important? Trend lines help visualize the direction of price movements, making it easier to identify trends and potential reversal points.

Support and Resistance Levels
When diving into the world of technical analysis, one cannot overlook the importance of . These are crucial concepts that serve as the bedrock of market analysis, helping traders make sense of price movements and potential reversals. Think of support and resistance as the floor and ceiling of a room; the price tends to bounce off these levels, creating a dynamic environment where traders can identify opportunities.
Support levels are essentially price points where a downtrend can be expected to pause due to a concentration of demand. When prices fall to this level, buyers step in, believing that the asset is undervalued, thus preventing the price from dropping further. On the other hand, resistance levels are where an uptrend may stall, as sellers emerge, believing the price has peaked, creating a barrier that prices struggle to surpass. Recognizing these levels can be the key to unlocking profitable trades.
To identify support and resistance levels, traders often look at historical price data. Here are some effective methods:
- Historical Price Points: Look for previous highs and lows on charts. These points often serve as strong indicators of future support and resistance.
- Moving Averages: Simple and exponential moving averages can act as dynamic support and resistance levels, adjusting as the price changes.
- Fibonacci Retracement Levels: This tool uses horizontal lines to indicate areas of support or resistance at the key Fibonacci levels before the price continues in the original direction.
Understanding the significance of these levels is vital. For instance, if a stock bounces off a support level multiple times, it indicates a strong buyer interest at that price. Conversely, if it repeatedly fails to break through a resistance level, it suggests a solid seller presence. This is where the psychological aspect of trading comes into play; traders collectively react to these levels based on their experiences and expectations.
Moreover, the strength of support or resistance can change over time. A level that once held strong may eventually break, leading to what is known as a breakout. This is when the price moves beyond a support or resistance level with significant momentum, often indicating a new trend. It's crucial for traders to stay alert and adapt their strategies accordingly. The following table summarizes the characteristics of support and resistance levels:
| Characteristics | Support Levels | Resistance Levels |
|---|---|---|
| Definition | Price level where buying interest is strong enough to overcome selling pressure. | Price level where selling interest is strong enough to overcome buying pressure. |
| Market Psychology | Buyers believe the price is low and start purchasing. | Sellers believe the price is high and start selling. |
| Breakout Implication | A breakout above indicates potential upward momentum. | A breakout below indicates potential downward momentum. |
In conclusion, mastering support and resistance levels is essential for any trader looking to navigate the complex waters of the market. By understanding where these levels lie and what they signify, traders can make more informed decisions, enhancing their chances of success. Remember, every trader has their own unique approach, but the foundational concepts of support and resistance remain universally applicable.
Q: How do I identify support and resistance levels?
A: You can identify support and resistance levels by analyzing historical price data, looking for previous highs and lows, and using tools like moving averages and Fibonacci retracement levels.
Q: What happens when a support or resistance level is broken?
A: When a support level is broken, it may indicate a downward trend, while a broken resistance level can signal an upward trend. Traders often look for confirmation through volume and other indicators.
Q: Can support and resistance levels change over time?
A: Yes, support and resistance levels can change as market conditions evolve. A level that was once strong may weaken, leading to breakouts and new trends.

Trend Lines
Trend lines are essential tools in the arsenal of any technical analyst, acting as a guiding compass in the unpredictable seas of market movements. Imagine you're navigating a boat; without a compass, you could easily drift off course. Similarly, trend lines help traders identify the overall direction of the market, whether it's moving up, down, or sideways. By connecting significant price points, trend lines provide a visual representation of market sentiment and potential future movements.
To draw a trend line, you need to identify at least two significant price points on a chart. For an upward trend, connect the lowest lows, while for a downward trend, connect the highest highs. The more points you connect, the stronger the trend line becomes. This is because a trend line that has been tested multiple times tends to carry more weight, indicating a stronger market sentiment. It's important to remember that trend lines are not set in stone; they can evolve as new price data comes in.
Here's a quick overview of how to effectively use trend lines:
- Identify Key Points: Look for major highs and lows on the chart.
- Connect the Dots: Draw the line through at least two points, ideally three or more for reliability.
- Monitor Breakouts: Pay attention to when the price breaks through a trend line, as this can signal a change in market direction.
Trend lines serve not just as visual aids but also as psychological barriers in trading. Traders often place buy and sell orders around these lines, creating a self-fulfilling prophecy. For example, if a price approaches a well-established upward trend line, many traders might see it as a buying opportunity, pushing the price higher. Conversely, if the price breaks below a downward trend line, it could trigger a wave of selling, reinforcing the downward movement.
Moreover, combining trend lines with other technical indicators can enhance their effectiveness. For instance, using a moving average alongside a trend line can provide additional confirmation of the trend's strength. This synergy between different tools allows traders to make more informed decisions, reducing the risk of false signals and improving overall trading performance.
In conclusion, mastering trend lines can significantly improve your trading strategy. They not only help in visualizing market direction but also aid in understanding market psychology. As you practice drawing and interpreting trend lines, you'll find that they can become an invaluable part of your trading toolkit, guiding you through the complexities of market trends with greater confidence.
Q1: How do I know if a trend line is valid?
A trend line is considered valid if it connects two or more significant price points and has been tested multiple times without being broken. The more touches a trend line has, the more reliable it is.
Q2: Can trend lines predict future price movements?
While trend lines can indicate the direction of price movements, they are not foolproof predictors. They should be used in conjunction with other technical analysis tools for better accuracy.
Q3: What should I do if the price breaks a trend line?
A breakout can indicate a potential change in trend. If the price breaks above a downward trend line, it may signal a bullish reversal, while a break below an upward trend line could suggest a bearish reversal. Always consider other indicators to confirm the trend change.
Frequently Asked Questions
- What is technical analysis?
Technical analysis is a method used to evaluate and forecast the future price movements of assets by analyzing historical market data, primarily focusing on price and volume. It's like trying to predict the weather by looking at past patterns, helping traders make informed decisions based on trends.
- Why is technical analysis important for traders?
Technical analysis is crucial because it helps traders identify market trends and potential entry or exit points. By understanding these trends, traders can make better decisions, much like a sailor navigating the seas by observing the stars.
- What are the main tools used in technical analysis?
The main tools include charts (like line, bar, and candlestick charts), technical indicators (such as moving averages and Relative Strength Index), and patterns. Each tool provides unique insights, helping traders visualize and interpret market movements effectively.
- How do I read candlestick charts?
Candlestick charts display price movements over a specific time frame, with each "candlestick" representing the open, close, high, and low prices. By analyzing the shape and color of the candlesticks, traders can gauge market sentiment and identify potential trend reversals.
- What are support and resistance levels?
Support levels are price points where a downtrend can be expected to pause due to a concentration of buying interest, while resistance levels are where an uptrend may stall due to selling pressure. Think of them as the floor and ceiling of a room, containing the price movement within specific bounds.
- How can I identify market trends?
Market trends can be identified by analyzing price movements and using tools like trend lines and moving averages. An upward trend is characterized by higher highs and higher lows, while a downward trend shows lower highs and lower lows. Sideways trends indicate a market that is consolidating.
- What are trend lines and how do I use them?
Trend lines are straight lines drawn on charts to connect significant price points, helping to visualize the direction of the market. To use them, draw a line connecting the lows in an uptrend or the highs in a downtrend, which can serve as a guide for potential future price movements.
- Can technical analysis guarantee profits?
While technical analysis can significantly improve your trading decisions by providing insights into market trends, it does not guarantee profits. Markets can be unpredictable, and it's essential to combine technical analysis with risk management strategies to protect your investments.
- Is technical analysis suitable for all types of traders?
Yes! Technical analysis can be beneficial for various trading styles, including day trading, swing trading, and long-term investing. Regardless of your approach, understanding market trends can enhance your trading strategy and help you make better decisions.