How to Analyze Market Trends Using On-Balance Volume (OBV)
In the ever-evolving world of trading, making informed decisions is crucial for success. One of the most effective tools at your disposal is the On-Balance Volume (OBV) indicator. This powerful technical analysis tool helps traders understand market trends by analyzing volume flow. But what exactly is OBV, and why should you care? Well, imagine trying to navigate a ship through a stormy sea without a compass. That’s what trading can feel like without the right tools. OBV acts as that compass, guiding you through the tumultuous waters of the stock market.
OBV is based on the simple premise that volume precedes price. When a stock closes higher than its previous close, the day’s volume is added to the OBV. Conversely, if the stock closes lower, the volume is subtracted. This cumulative approach allows traders to see how volume trends correlate with price movements. So, if you’re looking to ride the waves of market trends, understanding OBV is an essential skill that can lead to smarter trading decisions.
As we dive deeper into this article, we will explore the intricacies of OBV, including its calculation, interpretation, and practical applications. Whether you’re a seasoned trader or just starting, mastering OBV can provide you with a significant edge in the market. So, buckle up as we embark on this journey to uncover the secrets of On-Balance Volume!
On-Balance Volume (OBV) is more than just a fancy term thrown around in trading circles; it’s a pivotal indicator that can help you decipher market sentiment. The basic idea behind OBV is that volume is a leading indicator of price movements. When you see a surge in volume, it often signals that a price movement is on the horizon. Think of it like a crowd cheering before a big event; the louder the crowd, the more likely something exciting is about to happen!
But how do we calculate OBV? It’s surprisingly straightforward. The calculation involves keeping a running total of volume based on daily price movements. If the price goes up, you add that day’s volume to your OBV total. If it goes down, you subtract it. This cumulative nature of OBV makes it a unique indicator that reflects the buying and selling pressure in the market.
Now that we’ve established the importance of OBV, let’s get into the nitty-gritty of how to calculate it. The formula is simple:
OBV  Previous OBV + Current Volume (if price increased)
OBV  Previous OBV - Current Volume (if price decreased)
By following this method, you can compute the OBV for any stock. Let’s break it down step-by-step:
- Start with the previous day's OBV (usually set to zero on the first day).
- Check the closing price of the stock for the current day.
- If the closing price is higher than the previous day, add the current day's volume to the previous OBV.
- If the closing price is lower, subtract the current day's volume from the previous OBV.
- Repeat this process for each trading day to build your OBV chart.
Daily OBV calculation requires meticulous tracking of daily closing prices and corresponding volumes. It’s essential to maintain accuracy in your data collection because even a small error can lead to misleading conclusions. You can use various platforms that provide historical data, or if you prefer a more hands-on approach, you can create a simple spreadsheet to log your data. Just remember, consistency is key!
One of the fascinating aspects of OBV is its versatility across different timeframes. Whether you’re a day trader looking for quick gains or a long-term investor eyeing potential growth, OBV can be tailored to fit your strategy. For instance, short-term traders might focus on minute-by-minute OBV changes, while long-term investors may analyze daily or weekly OBV trends. This adaptability allows traders to fine-tune their strategies based on market conditions.
Understanding how to interpret OBV signals is crucial for any trader. A rising OBV indicates that buying pressure is increasing, often leading to higher prices. Conversely, a falling OBV suggests increasing selling pressure, which may result in lower prices. It’s like watching the tide come in and out; when the tide is in, you can expect the waves (prices) to rise, and when it’s out, the waves tend to fall.
Divergences between price and OBV can signal potential reversals in the market. For example, if prices are making new highs but OBV isn’t, it could indicate weakening momentum, suggesting a potential reversal. Spotting these divergences can be a game-changer for your trading strategy. It’s like noticing a storm brewing in the distance; it’s better to prepare for it than to be caught off guard!
Finally, understanding the relationship between OBV and price trends is essential. A rising OBV should confirm an uptrend, while a falling OBV should confirm a downtrend. However, if OBV is moving in the opposite direction of price, it may indicate a potential trend reversal. This relationship helps traders make informed decisions about when to enter or exit trades.
While OBV is a valuable tool, it’s not without its limitations. For instance, it can sometimes produce false signals, especially in choppy markets. Additionally, OBV doesn’t account for sudden news events or market shifts, which can dramatically affect price movements. Therefore, it’s essential to use OBV in conjunction with other indicators to enhance your analysis.
Combining OBV with other technical indicators can significantly enhance your market analysis. Some effective pairings include:
- Moving Averages: Use moving averages to identify trends and confirm OBV signals.
- Relative Strength Index (RSI): Pairing OBV with RSI can help identify overbought or oversold conditions.
- MACD: The Moving Average Convergence Divergence (MACD) can provide additional insights into momentum.
In real-world trading scenarios, OBV can be a game-changer. For example, a trader might notice a rising OBV alongside a stock price that’s been relatively stable. This could indicate that a breakout is imminent, prompting the trader to enter a position before the price surge. Conversely, if a trader sees a declining OBV while the price is rising, it may be wise to consider taking profits or adjusting their position.
Q: What is the primary purpose of OBV?
A: OBV helps traders gauge market sentiment and predict price movements based on volume flow.
Q: Can OBV be used for all types of assets?
A: Yes, OBV can be applied to stocks, ETFs, commodities, and even cryptocurrencies.
Q: How often should I calculate OBV?
A: It depends on your trading strategy; daily calculations are common for most traders.
Q: Is OBV reliable on its own?
A: While OBV is a valuable tool, it’s best used in conjunction with other indicators for more accurate analysis.

Understanding On-Balance Volume (OBV)
On-Balance Volume (OBV) is more than just a technical analysis tool; it's a powerful indicator that leverages the concept of volume flow to forecast potential price movements in the stock market. Imagine you're trying to gauge the mood of a crowd at a concert. If the crowd is roaring and swaying with excitement, you can bet that the energy is high, much like how volume in the market can signal rising interest in a stock. In the same vein, OBV helps traders understand whether the buying or selling pressure is dominating, which is crucial for making informed trading decisions.
The calculation of OBV is relatively straightforward, yet its implications can be profound. It operates on a simple principle: when a stock closes higher than its previous close, the day's volume is added to the OBV. Conversely, if it closes lower, that volume is subtracted. This creates a cumulative total that reflects the total buying and selling pressure over time. Think of it as a running tally of the market's sentiment. If you chart OBV alongside price movements, you can start to see patterns emerge that might indicate future price actions.
For example, when OBV is rising, it suggests that buyers are willing to step in and purchase the stock, which often precedes a price increase. On the flip side, if OBV is falling, it indicates that selling pressure is increasing, often leading to price declines. This relationship between volume and price can be visually represented in a table:
| Price Movement | OBV Movement | Market Sentiment |
|---|---|---|
| Price rises | OBV rises | Positive sentiment, potential bullish trend |
| Price falls | OBV falls | Negative sentiment, potential bearish trend |
| Price rises | OBV falls | Weak bullish signal, potential reversal |
| Price falls | OBV rises | Weak bearish signal, potential reversal |
Understanding OBV is essential for any trader looking to gain an edge in the market. It’s not just about the numbers; it’s about interpreting what those numbers mean in the context of market dynamics. As you delve deeper into OBV, you’ll find that it offers insights into the underlying forces driving price changes. So, the next time you look at a stock chart, remember that the volume is telling a story—one that can help you navigate the sometimes turbulent waters of trading.

Calculating OBV
Calculating On-Balance Volume (OBV) may sound daunting at first, but once you break it down into manageable steps, it becomes a straightforward process. The essence of OBV lies in its ability to combine price movements with volume to provide a clearer picture of market sentiment. To calculate OBV, you need to track the daily closing prices and the corresponding trading volumes of the stock you are analyzing. The formula is simple: if the closing price of the stock on a given day is higher than the previous day's closing price, you add that day's volume to the OBV. Conversely, if the closing price is lower, you subtract the day's volume from the OBV. This cumulative approach creates a running total that reflects the flow of volume in relation to price movement.
Let’s break it down with a simple example to illustrate how OBV is calculated:
| Date | Closing Price | Volume | OBV Calculation | OBV Total |
|---|---|---|---|---|
| Day 1 | $10 | 1000 | - | 1000 |
| Day 2 | $12 | 1500 | Add 1500 | 2500 |
| Day 3 | $11 | 2000 | Subtract 2000 | 500 |
| Day 4 | $13 | 1800 | Add 1800 | 2300 |
In this example, we start with an initial OBV of 1000 on Day 1, which is simply the volume of that day since there’s no previous day to compare. On Day 2, the price increases, so we add the volume of 1500, resulting in an OBV of 2500. On Day 3, the price dips, leading us to subtract the volume of 2000, bringing the OBV down to 500. Finally, on Day 4, the price rises again, and we add 1800, resulting in a total OBV of 2300. This cumulative process reflects how volume is influencing price movements over time.
It’s important to remember that the OBV line can help you visualize trends. A rising OBV line indicates that buyers are willing to push prices higher, while a falling OBV suggests that sellers are dominating the market. By regularly calculating OBV, you can gain insights into potential market trends and make more informed trading decisions.
In conclusion, the calculation of OBV is a powerful method that, when applied correctly, can greatly enhance your market analysis. By understanding how to calculate OBV and interpret the results, you can better predict future price movements and adjust your trading strategies accordingly.

Daily OBV Calculation
Calculating the On-Balance Volume (OBV) on a daily basis is crucial for traders who want to harness the power of volume in predicting price movements. The essence of OBV lies in its ability to correlate volume with price changes, allowing traders to gauge the strength of a trend. To effectively compute daily OBV, you need to track the closing prices and corresponding volumes of the stock you are analyzing. This process isn't as daunting as it sounds; in fact, it can be broken down into a few straightforward steps.
First, you start by establishing a baseline OBV value. Typically, this initial value is set to zero on the first day of your analysis. From there, you will look at each subsequent trading day. If the closing price of the stock is higher than the previous day's closing price, you add the volume of that day to your OBV. Conversely, if the price is lower, you subtract the volume from your OBV. If the price remains unchanged, the OBV stays the same. This simple yet effective calculation allows you to build a cumulative OBV figure that reflects the buying and selling pressure over time.
| Date | Closing Price | Volume | OBV Change | Cumulative OBV |
|---|---|---|---|---|
| Day 1 | $10 | 1000 | 0 | 0 |
| Day 2 | $11 | 1500 | +1500 | 1500 |
| Day 3 | $10.50 | 2000 | -2000 | -500 |
| Day 4 | $12 | 2500 | +2500 | 2000 |
As illustrated in the table above, the daily OBV calculation not only tracks the changes in volume but also provides a cumulative perspective that can be invaluable for traders. For instance, on Day 1, the OBV starts at zero. When the price increases on Day 2, the OBV reflects this uptick by adding the volume of 1500. However, on Day 3, when the price dips, the OBV decreases by 2000, resulting in a negative cumulative OBV. Finally, a price increase on Day 4 leads to another rise in OBV, showcasing the cumulative effect of volume over time.
To further enhance your daily OBV calculations, it’s essential to remain consistent with your data collection. Make sure you record the closing prices and volumes accurately each trading day. Additionally, consider using a spreadsheet or specialized software to automate the calculations, ensuring that you can easily visualize trends over time. By keeping a close eye on your daily OBV, you will be better equipped to make informed trading decisions based on market momentum.

Using OBV in Different Timeframes
The versatility of the On-Balance Volume (OBV) indicator is one of its most appealing features, making it a favorite among traders who operate in various timeframes. Whether you're a day trader looking for quick gains or a long-term investor aiming to capitalize on broader market trends, understanding how to apply OBV across different timeframes is crucial. But how does OBV adapt to these varying strategies? Let's dive into the details!
First off, it's important to recognize that the timeframe you choose can significantly impact your trading decisions. For instance, a short-term trader may focus on minute or hourly charts, while a long-term investor might analyze daily or weekly charts. Each timeframe provides a different perspective on market dynamics, and OBV can help illuminate these shifts.
When using OBV in short timeframes, such as 1-minute or 5-minute charts, traders often look for quick signals to capitalize on rapid price movements. In these cases, a rising OBV indicates that buyers are stepping in, which can suggest a potential upward price movement. Conversely, if the OBV is falling while prices are stable or rising, it could signal underlying weakness, prompting traders to be cautious. This is where the concept of momentum comes into play. A quick glance at the OBV can help traders gauge whether they should enter or exit a position swiftly.
On the other hand, when analyzing longer timeframes, such as daily or weekly charts, OBV can provide insights into more sustained trends. For example, if you notice that OBV is consistently rising alongside price increases over several weeks, this may indicate a strong bullish trend. However, if OBV starts to decline while prices are still climbing, it could suggest that the upward momentum is losing steam, warning traders to prepare for a potential reversal. This divergence between OBV and price can be a powerful signal for long-term investors.
Additionally, it's worth noting that the context of the market plays a vital role in interpreting OBV signals across different timeframes. For instance, during periods of high volatility, short-term OBV signals may become less reliable due to rapid price swings. In such cases, it might be beneficial to look at the longer-term OBV trend to gain a clearer perspective. Therefore, incorporating multiple timeframes into your analysis can provide a more comprehensive view of market conditions.
To summarize, using OBV across different timeframes allows traders to adapt their strategies based on the market's current state. Here’s a quick overview of how OBV can be applied in various timeframes:
| Timeframe | Application | Key Considerations |
|---|---|---|
| Short-term (1-min, 5-min) | Quick entry/exit signals | Watch for rapid price movements and momentum shifts |
| Medium-term (hourly, daily) | Identify trends and reversals | Look for divergences between OBV and price |
| Long-term (weekly, monthly) | Assess overall market strength | Consider broader economic factors and market sentiment |
In conclusion, the On-Balance Volume indicator is a powerful tool that can be tailored to fit your trading style, whether you’re in for the short haul or the long game. By understanding how to effectively utilize OBV across different timeframes, you can make more informed trading decisions and enhance your market analysis. So, the next time you're analyzing a stock, remember to consider the timeframe that aligns with your trading objectives!
- What is the primary purpose of OBV? OBV is used to measure buying and selling pressure as a cumulative indicator, helping traders predict price movements.
- Can OBV be used alone for trading decisions? While OBV is a useful tool, it’s often best used in conjunction with other indicators for more reliable signals.
- How often should I check OBV? It depends on your trading strategy; short-term traders may check it frequently, while long-term investors may monitor it less often.

Interpreting OBV Signals
When it comes to trading, understanding the signals emitted by the On-Balance Volume (OBV) indicator can be a game changer. The OBV is not just a number; it tells a story about the market's sentiment and can provide crucial insights into potential price movements. So, how do we interpret these signals? It's all about recognizing trends and divergences that can indicate bullish or bearish momentum.
One of the key aspects of interpreting OBV signals is to observe the relationship between OBV and price movements. If the OBV is rising while the price is also increasing, it suggests that the upward trend is backed by strong buying pressure. Conversely, if the OBV is falling while the price is rising, this could signal a lack of conviction in the price movement, hinting at a possible reversal. In essence, you want to see OBV confirming the price action to strengthen your trading decisions.
Let's break it down further. Here are some typical scenarios you might encounter:
- Bullish Signal: If the OBV rises alongside an increase in price, this indicates that buyers are in control. This is often seen as a confirmation of a strong upward trend.
- Bearish Signal: Conversely, if the OBV is declining while the price continues to rise, it suggests that the upward movement may be losing strength, signaling a potential reversal.
- Sideways Movement: When both price and OBV are moving sideways, it implies indecision in the market. Traders should be cautious, as this can precede significant price movements.
Another critical aspect of interpreting OBV is to look for divergences. A divergence occurs when the price and OBV are moving in opposite directions. For example, if prices are making new highs but the OBV is failing to follow suit, this is a bearish divergence and may suggest that the price is due for a correction. On the flip side, if prices are making new lows while the OBV is rising, this bullish divergence could indicate a potential bottom and an upcoming price rally.
To illustrate this concept, consider the following table that summarizes the interpretations of different OBV signals:
| Signal Type | Price Movement | OBV Movement | Interpretation |
|---|---|---|---|
| Bullish | Rising | Rising | Strong buying pressure; confirm upward trend. |
| Bearish | Rising | Falling | Weakness in upward movement; potential reversal. |
| Neutral | Sideways | Sideways | Indecision in the market; caution advised. |
| Bearish Divergence | New Highs | Falling | Potential price correction; selling pressure may increase. |
| Bullish Divergence | New Lows | Rising | Possible price rally; buying pressure may increase. |
In summary, interpreting OBV signals requires a keen eye for detail and an understanding of how volume relates to price action. By observing the interplay between OBV and price trends, traders can make more informed decisions. Remember, OBV is a tool that, when used correctly, can enhance your trading strategy and help you navigate the often turbulent waters of the market.
Q: What is On-Balance Volume (OBV)?
A: OBV is a technical analysis tool that uses volume flow to predict changes in stock price. It's calculated by adding volume on up days and subtracting volume on down days.
Q: How do I calculate OBV?
A: To calculate OBV, sum the volume on days when the stock price closes higher than the previous day and subtract the volume on days when it closes lower.
Q: Can OBV be used in different timeframes?
A: Absolutely! OBV can be applied across various timeframes, allowing traders to adapt their strategies based on short-term or long-term market movements.
Q: What are the limitations of OBV?
A: While OBV is a valuable tool, it may not always provide reliable signals, especially in volatile markets where price movements can be erratic.

Bullish and Bearish Divergences
When it comes to trading, understanding market signals is like having a roadmap on a long journey. One of the most powerful tools in your arsenal is the concept of in On-Balance Volume (OBV). These divergences can act as early warning systems, alerting you to potential reversals in price trends that could either make or break your trading strategy. So, what exactly are these divergences, and how can you spot them?
A bullish divergence occurs when the price of a stock is making lower lows, but the OBV is making higher lows. This situation suggests that despite the price dropping, there is an underlying strength in buying volume, indicating that buyers are stepping in and may soon overwhelm sellers. Think of it as a coiled spring; the pressure is building, and a breakout is likely just around the corner. Conversely, a bearish divergence happens when the price is making higher highs while the OBV is making lower highs. This indicates that while the price is climbing, the buying pressure is weakening, suggesting that sellers may soon take control. It’s akin to a car speeding downhill without brakes; it may be moving fast, but it’s only a matter of time before it crashes.
To effectively utilize these divergences, it's essential to keep an eye on the relationship between price and OBV. When you notice these divergences forming, consider the following:
- Always confirm with other technical indicators to avoid false signals.
- Look for volume spikes accompanying divergences to strengthen the signal.
- Be mindful of the overall market context, as external factors can influence price movements.
For practical application, let’s consider an example. Imagine a stock that has been in a downtrend, making consistent lower lows over the past few weeks. However, as you analyze the OBV, you notice that it has been rising. This is a classic bullish divergence. If you were to act on this divergence, you might consider entering a long position, anticipating a price reversal. On the flip side, if you see a stock that has been climbing steadily but the OBV starts to decline, it could be wise to reconsider your position or even look for an exit strategy.
In summary, recognizing bullish and bearish divergences in OBV can provide crucial insights into potential market reversals. They serve as a reminder that price is not the only indicator of market sentiment; volume tells its own story. As you continue to refine your trading strategies, keep these divergences in mind. They may just be the key to unlocking more profitable trades in your journey.
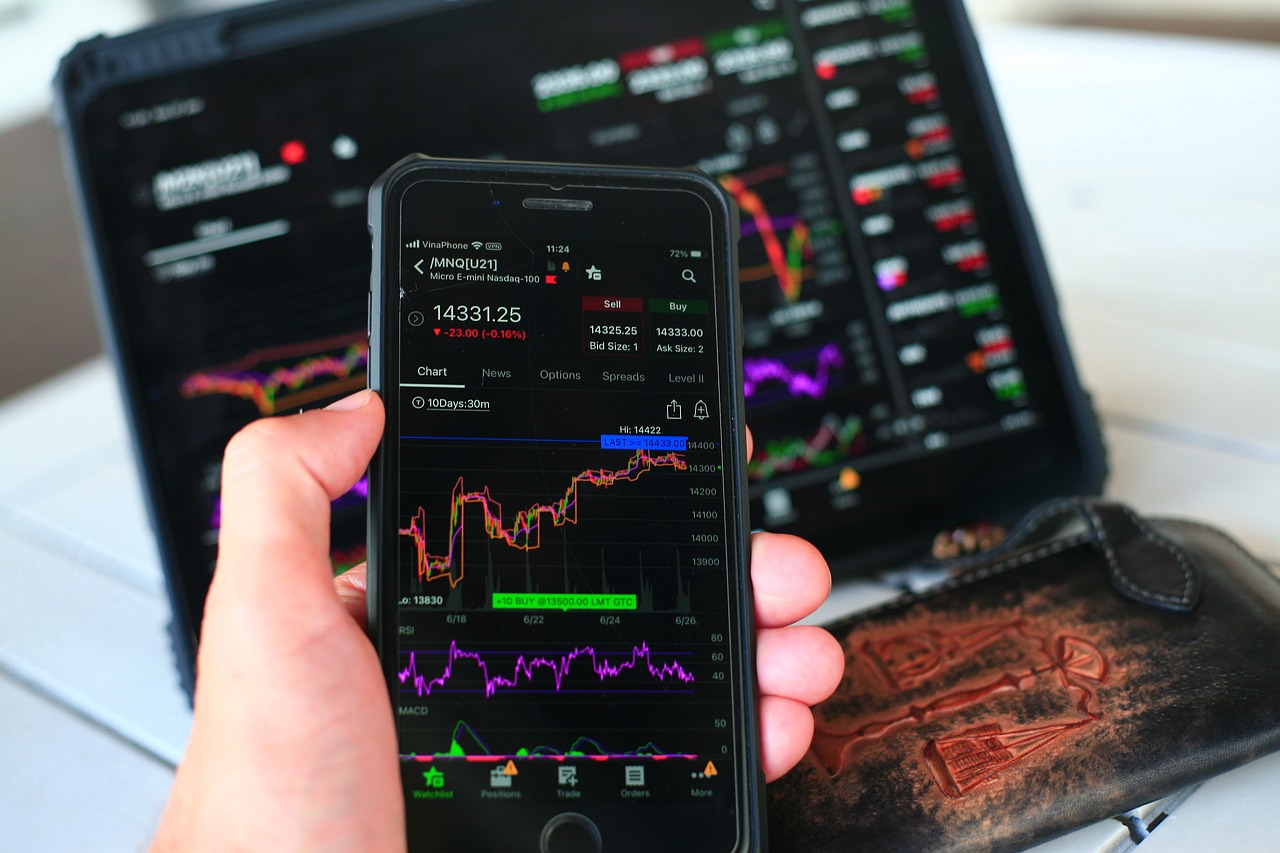
OBV and Price Trends
The relationship between On-Balance Volume (OBV) and price trends is a fascinating aspect of technical analysis that can significantly impact trading decisions. Understanding how these two elements interact is crucial for any trader looking to navigate the often turbulent waters of the stock market. When you think about it, price movements are like the waves of the ocean, while OBV acts as the tide that pulls those waves in different directions. If the tide is strong, it can influence the waves, just as OBV can indicate the strength of price movements.
Typically, a rising OBV suggests that the buying pressure is increasing, indicating that prices are likely to follow suit. Conversely, if OBV is falling, it implies that selling pressure is dominating, which could lead to a decrease in price. This correlation is essential for traders to grasp because it allows them to validate their trading strategies. For instance, if you observe that a stock's price is increasing, but the OBV is declining, it may signal a potential reversal or weakness in the upward trend. In this case, the price is like a balloon being inflated without enough air; eventually, it could pop.
To illustrate the impact of OBV on price trends, consider the following table that summarizes the possible scenarios:
| OBV Trend | Price Trend | Implication |
|---|---|---|
| Rising | Rising | Strong bullish signal; likely continuation of upward trend. |
| Falling | Falling | Strong bearish signal; likely continuation of downward trend. |
| Rising | Falling | Potential divergence; caution advised, possible reversal. |
| Falling | Rising | Potential divergence; caution advised, possible reversal. |
As you can see, the dynamics between OBV and price trends can provide critical insights for traders. It's not just about looking at price charts; you need to consider volume as well. Think of it as a detective examining clues at a crime scene. The more clues (or data points) you have, the clearer the picture becomes. By monitoring OBV alongside price movements, traders can better anticipate market shifts and make informed decisions.
In summary, recognizing the interplay between OBV and price trends is essential for effective trading. It’s about reading the signals the market sends and responding accordingly. Just like a skilled sailor adjusts their sails based on the wind's direction, traders must adapt their strategies based on the signals from OBV. By doing so, they can navigate the complexities of the market with greater confidence and precision.
- What is the primary purpose of OBV? OBV helps traders gauge the strength of price movements by analyzing volume flow.
- How can I use OBV in my trading strategy? Combine OBV signals with price trends to confirm potential buy or sell opportunities.
- Are there any limitations to using OBV? Yes, OBV may not always provide reliable signals in low-volume stocks or during high volatility.
- Can OBV be used for long-term trading? Absolutely! OBV can be applied across various timeframes, making it versatile for both short-term and long-term strategies.

Limitations of OBV
While the On-Balance Volume (OBV) indicator is a powerful tool in the arsenal of a trader, it’s essential to acknowledge that it is not without its limitations. Just like any other technical analysis tool, OBV has its quirks that can lead to misinterpretation or false signals. Understanding these limitations can help traders make more informed decisions and avoid costly mistakes.
One significant limitation of OBV is its reliance on volume data. Volume can be influenced by several external factors, including market sentiment and news events, which may not always correlate with price movements. For instance, a sudden spike in volume might indicate a large player entering the market, but it doesn't necessarily mean that the price will follow suit. In such cases, the OBV may give a bullish signal, while the price could be heading downwards due to underlying negative news.
Another critical aspect to consider is that OBV is a lagging indicator. This means that it reacts to price movements rather than predicting them. As a result, traders may find themselves late to the party when it comes to entering or exiting trades. For example, if a stock's price begins to rise sharply, the OBV may not reflect this increase until after the price has already moved, potentially causing traders to miss out on optimal entry points.
Additionally, OBV can produce false signals during periods of low trading volume. In such scenarios, the indicator may not accurately reflect the true market sentiment, leading traders to make decisions based on misleading data. This is particularly true in thinly traded stocks where a few trades can skew the volume significantly. In these cases, relying solely on OBV can be risky and should be supplemented with other indicators or analysis techniques.
Moreover, OBV does not provide information on the magnitude of price changes. While it can indicate whether the volume is increasing or decreasing, it doesn’t tell traders how significant those changes are in relation to price movement. This can lead to situations where traders might misinterpret the strength of a trend. For instance, a slight increase in OBV might suggest bullish sentiment, but if the price movement is minimal, it may not warrant action.
Lastly, the effectiveness of OBV can vary across different markets and timeframes. What works well in one market condition may not necessarily apply in another. For example, during a strong trending market, OBV may provide more reliable signals, while in a sideways or choppy market, it may lead to confusion and indecision. Therefore, traders should always consider the broader market context when using OBV.
In summary, while OBV can be an invaluable tool for analyzing market trends, it is crucial to be aware of its limitations. By understanding these pitfalls, traders can use OBV more effectively and in conjunction with other indicators to enhance their trading strategies. Always remember that no single indicator can provide a complete picture of the market, and a well-rounded approach is key to successful trading.
- What is the primary purpose of the OBV indicator? The OBV indicator aims to measure the buying and selling pressure based on volume to predict future price movements.
- Can OBV be used for all types of assets? Yes, OBV can be applied to various assets, including stocks, commodities, and cryptocurrencies, but its effectiveness may vary depending on market conditions.
- How can I improve my trading strategy using OBV? Combine OBV with other technical indicators, such as moving averages or RSI, to create a more comprehensive trading strategy.
- Is OBV suitable for short-term trading? OBV can be used for short-term trading, but it is essential to consider the overall market context and other indicators for better accuracy.

Combining OBV with Other Indicators
When it comes to trading, relying solely on one indicator can sometimes lead to misleading conclusions. That's where the magic of combining indicators comes into play, especially when you pair the On-Balance Volume (OBV) with other technical tools. By doing so, you can create a more robust trading strategy that can help you navigate the often unpredictable waters of the market.
For instance, one of the most effective combinations is using OBV alongside the Relative Strength Index (RSI). While OBV focuses on volume trends, RSI measures the speed and change of price movements. By analyzing both, traders can gain insights into whether a stock is overbought or oversold while confirming the strength of the volume behind price movements. Imagine you’re trying to read a book in the dark; OBV is like your flashlight, illuminating the path, while RSI provides the context of the story.
Another powerful pairing is OBV with Moving Averages (MA). Moving averages smooth out price data to identify trends over a specific period. When OBV trends upward while the price is above the moving average, it signals a strong bullish trend. Conversely, if OBV is declining while the price is below the moving average, it may indicate a bearish trend. This combination can help traders make more informed decisions, as they can see not only the direction of the price but also the volume backing that movement.
To illustrate the effectiveness of these combinations, consider the following table that summarizes how OBV interacts with both RSI and Moving Averages:
| Indicator Combination | Signal | Interpretation |
|---|---|---|
| OBV + RSI | Overbought/Oversold | Confirms potential reversal points based on volume and price momentum. |
| OBV + Moving Averages | Trend Confirmation | Validates the strength of a trend based on the direction of both price and volume. |
Additionally, combining OBV with other volume-based indicators, such as the Accumulation/Distribution Line, can further enhance your analysis. The Accumulation/Distribution Line helps you understand whether a stock is being accumulated or distributed, providing insights into market sentiment. When both OBV and the Accumulation/Distribution Line are moving in the same direction, it can reinforce the validity of the trend you’re observing.
In summary, while OBV is a powerful tool on its own, its true potential is unlocked when combined with other indicators. This multi-faceted approach allows traders to confirm signals, reduce false positives, and ultimately make more informed trading decisions. So, the next time you analyze a stock, consider how pairing OBV with other indicators can give you a clearer picture of market trends.
- What is the best indicator to use with OBV? While it depends on your trading style, popular indicators to combine with OBV include RSI and Moving Averages.
- Can OBV be used for day trading? Yes, OBV can be effectively used in day trading strategies, especially when combined with short-term indicators.
- Are there any limitations to using OBV? Yes, OBV can sometimes give false signals, especially in low-volume stocks or during periods of high volatility.

Practical Applications of OBV
The On-Balance Volume (OBV) indicator is not just a theoretical concept; it has real-world applications that can significantly enhance your trading strategy. By understanding how to effectively apply OBV in various market conditions, traders can make more informed decisions, leading to potentially profitable outcomes. One of the most common practical applications of OBV is in identifying buying and selling opportunities. When the OBV line is rising, it suggests that buyers are willing to push the price higher, indicating a bullish trend. Conversely, a declining OBV line may signal that sellers are dominating the market, pointing towards a bearish trend.
For instance, consider a scenario where a stock has been trading sideways for several weeks. If you notice that the OBV continues to rise during this period, it could be a strong indication that the stock is building up momentum for a breakout. This situation is akin to a coiled spring—when the pressure builds up sufficiently, it will eventually release, leading to a significant price movement. Traders who recognize this pattern can position themselves to capitalize on the impending price surge.
Moreover, OBV can be exceptionally useful in confirming price movements. Let’s say a stock price breaks out of a resistance level, but the OBV does not follow suit. This divergence can serve as a warning sign, suggesting that the breakout may not be sustainable. It’s like watching a runner who suddenly accelerates without any visible effort; it raises questions about their stamina. Therefore, combining OBV with price action can provide a more comprehensive view of market dynamics.
Another practical application of OBV is in setting stop-loss orders. When traders observe a significant drop in OBV alongside a price decline, it may indicate that the selling pressure is increasing. In such cases, it could be wise to tighten stop-loss orders to protect profits or minimize losses. This method acts as a safety net, allowing traders to manage risk effectively without being overly reactive to short-term price fluctuations.
To illustrate the effectiveness of OBV in real-world trading, let's take a look at a hypothetical example:
| Date | Closing Price | Volume | OBV |
|---|---|---|---|
| Day 1 | $50 | 1000 | 1000 |
| Day 2 | $52 | 1500 | 2500 |
| Day 3 | $51 | 800 | 1700 |
| Day 4 | $53 | 2000 | 3700 |
In this table, you can see how the OBV changes in response to price movements and trading volume. On Day 2, the price increased while the volume also rose, leading to a significant jump in OBV. However, on Day 3, despite a slight price decline, the OBV still decreased, indicating selling pressure. This information could lead traders to reconsider their positions.
In conclusion, the practical applications of OBV extend beyond simple calculations; they encompass a range of strategies that can significantly improve trading outcomes. By using OBV to confirm trends, identify divergences, and manage risk, traders can navigate the complexities of the market with greater confidence. Remember, the key to successful trading lies in understanding not just the tools at your disposal, but also the market environment in which you operate. So, keep your eyes peeled for those OBV signals, and let them guide you through your trading journey!
Q1: What is the On-Balance Volume (OBV) indicator?
A1: OBV is a technical analysis tool that uses volume flow to predict changes in stock price. It helps traders gauge market trends and potential price movements.
Q2: How do I calculate OBV?
A2: OBV is calculated by summing the volume on days when the price closes higher and subtracting the volume on days when the price closes lower. This cumulative total gives you the OBV value.
Q3: Can OBV be used in all timeframes?
A3: Yes, OBV can be applied across various timeframes. However, the interpretation of signals may vary depending on whether you are trading short-term or long-term.
Q4: What are the limitations of OBV?
A4: While OBV is a valuable tool, it can sometimes provide false signals, especially in volatile markets. It's essential to combine it with other indicators for better accuracy.
Q5: How can I combine OBV with other indicators?
A5: OBV can be effectively combined with indicators like Moving Averages or Relative Strength Index (RSI) to enhance trading decisions and confirm signals.
Frequently Asked Questions
- What is On-Balance Volume (OBV)?
On-Balance Volume (OBV) is a technical analysis tool that uses volume flow to predict changes in stock price. It combines price movement with volume to help traders understand market trends and potential price reversals.
- How do you calculate OBV?
To calculate OBV, sum the volume on days when the stock price closes higher than the previous day, and subtract the volume on days when it closes lower. This gives a cumulative volume figure that reflects buying and selling pressure.
- Can OBV be used for different timeframes?
Absolutely! OBV can be applied across various timeframes, making it a versatile tool for both short-term and long-term traders. Whether you’re day trading or investing for the long haul, OBV can help you adjust your strategies accordingly.
- What do bullish and bearish divergences in OBV indicate?
Bullish divergences occur when the price makes new lows while OBV makes higher lows, suggesting potential upward price movement. Conversely, bearish divergences happen when the price makes new highs while OBV makes lower highs, indicating a possible price decline.
- What are the limitations of using OBV?
While OBV is a valuable tool, it has limitations. It may not provide reliable signals in all market conditions, especially during sideways markets or when there is low trading volume. Traders should use OBV in conjunction with other indicators for more robust analysis.
- How can OBV be combined with other indicators?
Combining OBV with indicators like Moving Averages or Relative Strength Index (RSI) can enhance market analysis. For instance, using OBV alongside a moving average can help confirm trends and provide clearer entry and exit points for trades.
- What are some practical applications of OBV in trading?
Traders can use OBV to identify potential entry points based on volume trends. For example, if OBV is rising while the price is stable, it may indicate accumulation, suggesting a future price increase. Real-world examples include using OBV to time trades during earnings announcements or major news events.


