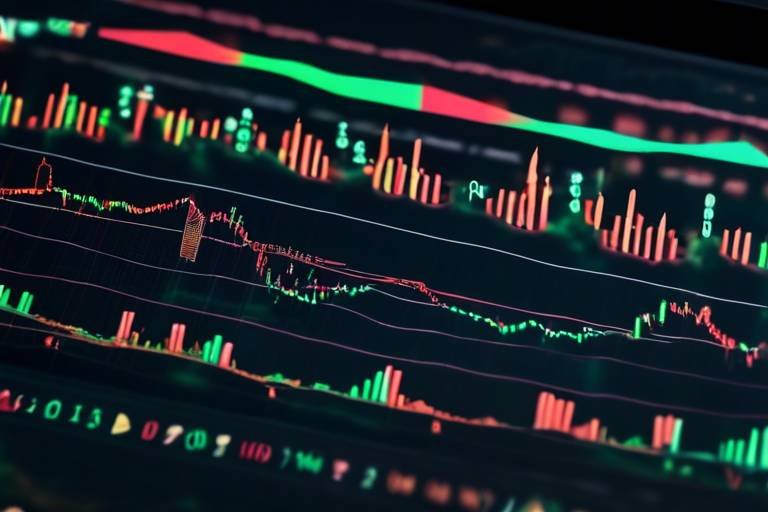
How to Use Charting Techniques to Enhance Trading Success
In the fast-paced world of trading, having the right tools and techniques at your disposal can make all the difference between success and failure. One of the most powerful tools available to traders is charting techniques. These methods allow traders to visualize market data, identify trends, and make informed decisions that can significantly impact their trading outcomes. If you've ever felt overwhelmed by the sheer volume of data or unsure about when to enter or exit a trade, you're not alone. Many traders face these challenges, but understanding and utilizing charting techniques can help demystify the process. By the end of this article, you'll have a solid grasp of various chart types, key patterns, and the importance of combining these techniques with effective risk management strategies.
When it comes to trading, not all charts are created equal. Different chart types serve unique purposes and can provide valuable insights into market trends. The most common chart types include:
- Line Charts: These charts provide a simple view of price movements over time, connecting closing prices with a continuous line. They are excellent for identifying overall trends but lack detail on price fluctuations.
- Bar Charts: Bar charts offer more information by displaying the high, low, opening, and closing prices for a specific time period. This additional data helps traders understand market volatility and price behavior.
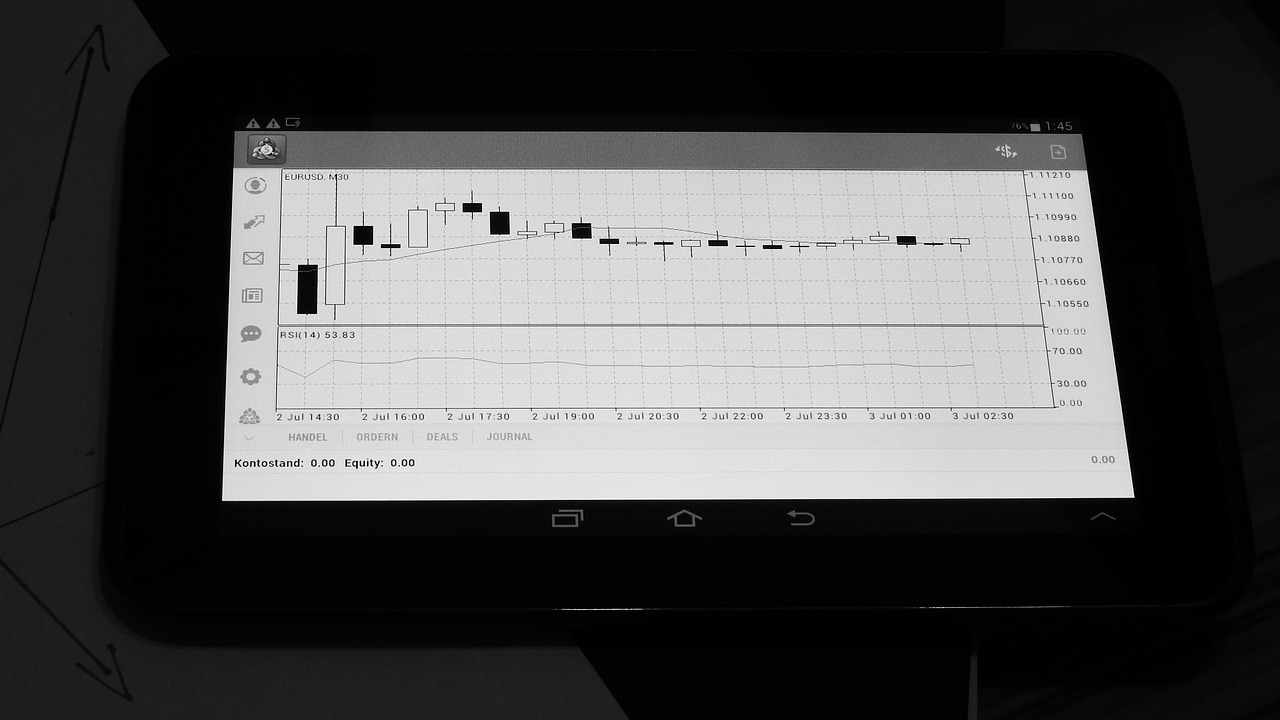
- Candlestick Charts: Often favored by traders, candlestick charts provide a visually appealing way to analyze price movements. Each "candlestick" represents a specific time period, showing the open, high, low, and close, making it easier to spot trends and reversals.
Understanding these chart types is essential for any trader looking to enhance their trading strategies. Each chart type has its strengths and weaknesses, and knowing when to use each can provide a significant edge in the market.
Recognizing chart patterns is crucial for traders aiming to predict future market movements. Patterns can indicate potential reversals or continuations of trends, providing valuable signals for traders. Some popular patterns include:
- Head and Shoulders: This reversal pattern signals a potential trend change, often indicating that an uptrend may be coming to an end.
- Triangles: Triangles can be either continuation or reversal patterns, depending on their formation. They indicate periods of consolidation before a breakout.
- Flags: Flags are continuation patterns that suggest a brief pause in a strong trend before it resumes.
By identifying these patterns, traders can better anticipate market movements and capitalize on trading opportunities.
Reversal patterns are particularly exciting because they signal potential changes in market direction. Patterns like double tops and bottoms can be incredibly valuable for traders. A double top, for instance, occurs after an uptrend and indicates that the price has reached a resistance level twice, suggesting a potential downturn. On the other hand, a double bottom signals that the price has tested a support level twice, hinting at a possible upward reversal. Recognizing these patterns can help traders make strategic decisions about when to enter or exit trades.
Continuation patterns suggest that the current trend is likely to persist. Patterns such as pennants and wedges indicate that the market is consolidating before making a significant move in the direction of the prevailing trend. For example, a pennant forms after a strong price movement and indicates that traders are preparing for the next big move. Understanding these patterns allows traders to align their strategies with ongoing market momentum, enhancing their chances of success.
Incorporating volume analysis with chart patterns can significantly enhance trading decisions. Volume refers to the number of shares or contracts traded in a given period. When you see a price movement accompanied by high volume, it often confirms the strength of that movement. For instance, if a stock breaks out of a resistance level with high volume, it’s a strong signal that the trend is likely to continue. Conversely, if a breakout occurs with low volume, it may indicate a lack of conviction in the move. Thus, understanding how to interpret volume alongside chart patterns can improve the accuracy of trade entries and exits.
Technical indicators complement charting techniques by providing additional data points to consider. Popular indicators like Moving Averages and the Relative Strength Index (RSI) can help traders identify trends and potential reversal points. For example, a Moving Average smooths out price data to identify the direction of the trend, while RSI indicates whether an asset is overbought or oversold. When used effectively, these indicators can enhance trading strategies and lead to more informed decision-making.
Choosing the right time frame is essential for effective trading. Different time frames, such as daily, weekly, and intraday, can significantly impact trading strategies and decision-making processes. For instance, a trader looking at a daily chart may have a different perspective than one focusing on a 5-minute chart. Understanding how various time frames affect market behavior is crucial for aligning your trading approach with your goals.
Understanding the differences between short-term and long-term trading is vital for every trader. Short-term trading, often characterized by quick trades and rapid decision-making, can yield significant profits but also comes with higher risks. On the other hand, long-term trading involves holding positions for extended periods, allowing traders to ride out market fluctuations. Each approach has its advantages and disadvantages, and aligning your strategy with your risk tolerance and financial goals is key to success.
Implementing risk management strategies is crucial for trading success. Without proper risk management, even the best charting techniques can lead to substantial losses. Strategies such as stop-loss orders and position sizing can help traders protect their capital while utilizing charting techniques effectively. A stop-loss order automatically sells a security when it reaches a certain price, limiting potential losses. Position sizing, on the other hand, involves determining how much capital to allocate to a trade based on your overall account size and risk tolerance. By incorporating these strategies, traders can enhance their ability to navigate the markets with confidence.
1. What are the best chart types for beginners?
Line charts and candlestick charts are often recommended for beginners due to their simplicity and the wealth of information they provide.
2. How can I effectively identify chart patterns?
Practice is key! Use historical data to familiarize yourself with patterns, and consider utilizing charting software that highlights these patterns for you.
3. What is the significance of volume in trading?
Volume is crucial as it confirms price movements. High volume during a breakout indicates strong interest and can validate the trend.
4. How do I choose the right time frame for my trading style?
Consider your trading strategy. Short-term traders may prefer lower time frames while long-term traders should focus on daily or weekly charts.

Understanding Chart Types
When it comes to trading, understanding different chart types is like having a map before embarking on a journey. Each chart type serves a unique purpose, offering traders insights that can significantly influence their decision-making process. The three most common chart types you'll encounter are line charts, bar charts, and candlestick charts. Each type has its own strengths and weaknesses, making it essential for traders to choose the right one based on their specific needs and trading style.
Line charts are the simplest of the three, depicting price movements over time using a continuous line. This type of chart is particularly useful for identifying trends and overall market direction. Imagine drawing a line connecting the dots of price points; it gives a clear visual representation of how prices have changed over a period. However, while line charts are great for spotting trends, they may overlook important details such as price fluctuations within a given time frame.
On the other hand, bar charts provide a more detailed view of price movements. Each bar represents a specific time period and displays the opening, closing, high, and low prices. This information can be invaluable for traders looking to understand market volatility. Think of a bar chart as a multi-dimensional view of the market; it not only shows you where the price started and ended but also the extremes it reached during that period. This added detail can help traders make more informed decisions, especially in fast-moving markets.
Now, let’s dive into the most popular type: candlestick charts. These charts are like a storybook of price action. Each candlestick represents price movements within a specific time frame, showing the open, close, high, and low prices. The body of the candlestick is colored to indicate whether the price went up (usually green or white) or down (red or black) during that period. Candlestick patterns can reveal market sentiment and potential reversals, making them a favorite among traders. For example, a long green candlestick indicates strong buying pressure, while a long red candlestick suggests selling pressure. Understanding these patterns can be the difference between a successful trade and a costly mistake.
To summarize, here's a quick comparison of the three chart types:
| Chart Type | Visual Representation | Best For |
|---|---|---|
| Line Chart | A simple line connecting price points | Identifying trends |
| Bar Chart | Vertical bars showing open, close, high, low | Understanding market volatility |
| Candlestick Chart | Colored bodies representing price action | Spotting market sentiment and reversals |
In conclusion, choosing the right chart type is crucial for effective trading. Each type provides unique insights that can help traders make informed decisions. Whether you prefer the simplicity of line charts, the detail of bar charts, or the storytelling nature of candlestick charts, understanding how to read and interpret these charts will enhance your trading strategies and ultimately lead to greater success in the financial markets.

Key Chart Patterns
When it comes to trading, recognizing chart patterns is like having a secret decoder ring that helps you understand the market's language. These patterns act as visual cues, guiding traders through the often turbulent waters of financial markets. By identifying these patterns, traders can anticipate potential market movements and seize trading opportunities before they slip away. Let's delve into some of the most popular chart patterns that every trader should keep an eye on.
One of the most well-known patterns is the head and shoulders formation. This pattern typically indicates a reversal of trends. Imagine a mountain range where the middle peak (the head) is higher than the two surrounding peaks (the shoulders). When this pattern appears, it often signals that the price is about to reverse direction. Conversely, the inverse head and shoulders pattern suggests a potential bullish reversal, with the market preparing to head upwards after a downtrend.
Another significant pattern is the triangle formation, which can be either ascending, descending, or symmetrical. Triangles represent periods of consolidation where the market is undecided, and price action narrows. This tightening of price action can lead to explosive moves once the price breaks out of the triangle. Traders often look for breakout points, using volume to confirm the strength of the move. For instance, if the price breaks above a descending triangle with high volume, it could signal a strong bullish trend ahead.
Flags and pennants are also essential patterns that indicate continuation. Flags resemble a rectangular shape that slopes against the prevailing trend, while pennants look like small symmetrical triangles. Both patterns suggest that the current trend is likely to continue after a brief pause. Traders often use these patterns to time their entries, waiting for a breakout in the direction of the prevailing trend.
To summarize, here are some key chart patterns to watch for:
- Head and Shoulders - Indicates trend reversal.
- Triangles - Shows consolidation and potential breakout.
- Flags and Pennants - Suggest continuation of the current trend.
Understanding and recognizing these patterns can significantly enhance your trading strategy. However, it's essential to combine these visual cues with other analysis techniques to improve your decision-making process. For example, incorporating volume analysis can provide additional confirmation of a pattern's validity. When a chart pattern is accompanied by strong volume, it indicates that the move is likely to be more reliable.
In the world of trading, knowledge is power. By familiarizing yourself with these key chart patterns, you can develop a sharper eye for market movements and make more informed trading decisions. Remember, practice makes perfect; the more you observe and analyze these patterns on your charts, the more intuitive your trading will become.
Q: What is a chart pattern?
A: A chart pattern is a recognizable formation created by the price movements of a security on a chart. These patterns can indicate potential future price movements and help traders make informed decisions.
Q: How can I identify chart patterns?
A: You can identify chart patterns by looking for specific formations on price charts, such as head and shoulders, triangles, flags, and pennants. It's essential to practice and familiarize yourself with these patterns to spot them effectively.
Q: Can chart patterns guarantee success in trading?
A: While chart patterns can provide valuable insights and improve your trading strategy, they do not guarantee success. It's crucial to use them in conjunction with other analysis methods and risk management strategies.
Q: What role does volume play in chart patterns?
A: Volume is a critical factor that can confirm the strength of a chart pattern. A breakout accompanied by high volume is often more reliable than one with low volume, as it indicates strong market interest and momentum.

Reversal Patterns
Reversal patterns are like the alarm bells of the trading world—they signal that a trend is about to change direction. For traders, recognizing these patterns can be the difference between a successful trade and a costly mistake. Imagine you're driving down a highway, and suddenly you see a sign indicating a sharp turn ahead; that’s exactly what reversal patterns do for traders. They provide critical insights that can help anticipate market movements, allowing traders to make informed decisions.
Among the most commonly recognized reversal patterns are the double tops and double bottoms. A double top occurs when the price reaches a peak, pulls back, and then attempts to reach that peak again but fails. This pattern suggests that the upward momentum is weakening, indicating that a downward trend may follow. On the flip side, a double bottom forms after a downtrend, where the price hits a low, bounces back, and then revisits that low but fails to break below it. This pattern signals that buyers are stepping in, and a reversal to an upward trend might be on the horizon.
Another important pattern to watch for is the head and shoulders formation. This pattern consists of three peaks: a higher peak (the head) between two lower peaks (the shoulders). The head and shoulders pattern is a strong indicator of a potential trend reversal from bullish to bearish. Conversely, the inverse head and shoulders pattern can indicate a reversal from bearish to bullish, providing traders with valuable entry points.
Understanding these reversal patterns is not just about recognizing shapes on a chart; it’s about interpreting market psychology. Traders should consider the volume accompanying these patterns, as volume can validate the strength of a reversal. For instance, a double top with increasing volume as the price approaches the second peak is a strong confirmation that the upward trend is likely to reverse. On the other hand, if the volume is low, it may suggest a lack of conviction in the price movement.
| Pattern | Description | Market Implication |
|---|---|---|
| Double Top | Two peaks at approximately the same price level | Potential reversal from bullish to bearish |
| Double Bottom | Two troughs at approximately the same price level | Potential reversal from bearish to bullish |
| Head and Shoulders | Three peaks: a higher peak (head) between two lower peaks (shoulders) | Potential reversal from bullish to bearish |
| Inverse Head and Shoulders | Three troughs: a lower trough (head) between two higher troughs (shoulders) | Potential reversal from bearish to bullish |
In summary, recognizing reversal patterns is an essential skill for traders looking to enhance their trading strategies. By understanding the psychology behind these patterns and incorporating volume analysis, traders can position themselves to capitalize on potential market reversals. So, the next time you’re analyzing a chart, keep an eye out for these telltale signs—they might just lead you to your next profitable trade!
- What are reversal patterns? Reversal patterns are formations on a chart that indicate a potential change in the direction of a trend, signaling traders to prepare for a shift in market momentum.
- How can I identify a double top pattern? A double top pattern is identified by two peaks at roughly the same price level, followed by a decline in price. It suggests that the upward trend may be losing strength.
- What is the significance of volume in reversal patterns? Volume provides confirmation of the strength behind a reversal pattern. Higher volume during the formation of a pattern indicates stronger conviction and increases the likelihood of a successful reversal.
- Can reversal patterns guarantee a successful trade? While reversal patterns can provide valuable insights, they are not guarantees. Traders should always consider additional factors, such as market conditions and risk management strategies, when making trading decisions.

Continuation Patterns
Continuation patterns are like the calm before the storm in the trading world. They occur when the price consolidates after a strong trend, suggesting that the current trend is likely to continue. Imagine you're watching a thrilling movie, and just when the action pauses, you know the climax is about to hit. That's precisely what these patterns signal to traders—they indicate that the market is taking a breather before it resumes its previous direction.
Some of the most common continuation patterns include pennants and wedges. Let's dive into what these patterns look like and how they can guide your trading decisions:
| Pattern | Description | Trading Implication |
|---|---|---|
| Pennant | A small triangle that forms after a strong price movement, indicating consolidation. | Traders often enter the market when the price breaks out of the pennant in the direction of the previous trend. |
| Wedge | A narrowing price range that can slope upwards or downwards, suggesting a potential continuation of the trend. | Traders look for breakouts in the direction of the prevailing trend, confirming the continuation. |
Understanding these patterns is crucial because they help you identify the right moments to enter or exit trades. For instance, if you spot a pennant forming after a bullish trend, it could be the perfect opportunity to buy before the price surges further. On the other hand, if a wedge appears during a downtrend, it might signal that the market is gearing up for another leg down, presenting a chance to sell.
But how do you effectively use these patterns in your trading strategy? First, it’s essential to confirm the pattern with volume. A breakout accompanied by high volume adds credibility to the continuation signal. Conversely, if the breakout occurs on low volume, it might be a false signal, leading to potential losses. Therefore, always keep an eye on the volume when analyzing continuation patterns.
In summary, continuation patterns are invaluable tools in a trader's arsenal. They provide insights into when a trend is likely to continue, allowing you to make informed decisions. By mastering these patterns and incorporating them into your trading strategy, you can significantly enhance your chances of success in the financial markets.
- What is the significance of continuation patterns in trading? Continuation patterns indicate that the current trend is likely to persist, helping traders make informed decisions about entering or exiting trades.
- How can I confirm a continuation pattern? Confirm a continuation pattern by analyzing the volume during the breakout. High volume adds credibility to the pattern.
- Are continuation patterns reliable? While they can be highly effective, no pattern is foolproof. It's crucial to use them in conjunction with other analysis techniques.

Volume Analysis
is an essential component of trading that goes hand in hand with chart patterns. When traders examine price movements, they must also consider the volume of trades that accompany those movements. Why, you ask? Well, volume provides insight into the strength or weakness of a price trend. For instance, a price increase accompanied by high volume is generally seen as a strong signal, while the same increase with low volume might raise a red flag. Think of it this way: if a tree falls in the forest and no one is around to hear it, does it make a sound? Similarly, if a stock moves but no one is trading it, how significant is that movement?
Incorporating volume into your trading strategy can help you make more informed decisions. Here are some key points to consider:
- Confirmation of Trends: A price trend backed by strong volume is likely to continue, while a trend with weak volume may reverse.
- Identifying Reversals: Sudden spikes in volume can indicate potential reversals, signaling traders to adjust their positions.
- Volume Patterns: Patterns such as increasing volume during a price rise and decreasing volume during a price decline can provide valuable insights into market sentiment.
To illustrate the significance of volume analysis, let’s consider a simple example. Imagine a stock that has been trading steadily at $50. One day, the price suddenly jumps to $60, but the volume of trades is only half of its average. In this case, you might want to be cautious. The lack of volume suggests that the price increase could be a fluke rather than a genuine trend. On the other hand, if the same stock jumps to $60 with double the average volume, that’s a different story. Here, the surge in volume signifies strong interest, making the price movement more credible.
To further enhance your understanding, let’s take a look at a simple
| Price Movement | Volume Level | Interpretation |
|---|---|---|
| Price Increase | High | Strong bullish signal; trend likely to continue. |
| Price Increase | Low | Weak signal; potential for reversal. |
| Price Decrease | High | Strong bearish signal; trend likely to continue. |
| Price Decrease | Low | Weak signal; potential for reversal. |
In conclusion, volume analysis is a powerful tool that can significantly enhance your trading strategy. By understanding how volume interacts with price movements, you can better anticipate market trends and make more informed decisions. Remember, the next time you analyze a chart, don’t just look at the price; pay attention to the volume as well. It’s the lifeblood of the market, and ignoring it could mean missing out on crucial trading opportunities!
Q: What is volume in trading?
A: Volume refers to the number of shares or contracts traded in a security or market during a given period. It indicates the activity level in that security.
Q: Why is volume important in trading?
A: Volume helps traders gauge the strength of a price movement. High volume can indicate strong interest and confidence in a trend, while low volume may suggest uncertainty.
Q: How can I analyze volume effectively?
A: To analyze volume effectively, look for patterns in volume alongside price movements, and consider using volume indicators like On-Balance Volume (OBV) or Volume Oscillator to assist in your analysis.

Technical Indicators
When it comes to trading, relying solely on chart patterns can sometimes leave you feeling like you're navigating a ship without a compass. This is where come into play, acting as your guiding star in the often turbulent waters of the financial markets. These indicators are mathematical calculations based on the price, volume, or open interest of a security. They provide additional data points that help traders make informed decisions, enhancing their trading strategies.
Among the most popular technical indicators are the Moving Averages and the Relative Strength Index (RSI). Each of these indicators serves a unique purpose and can significantly improve your trading effectiveness when used correctly. For example, moving averages smooth out price data to help identify trends over a specific period. They can be particularly useful in determining entry and exit points. The RSI, on the other hand, measures the speed and change of price movements, helping traders identify overbought or oversold conditions in the market.
Let’s break down how these indicators can be utilized effectively:
| Indicator | Purpose | How to Use |
|---|---|---|
| Moving Averages | Identify trends | Use crossover points to signal potential buy/sell opportunities |
| RSI | Gauge market momentum | Look for values above 70 (overbought) or below 30 (oversold) |
Using these indicators in conjunction with your charting techniques can provide a more comprehensive view of market conditions. For instance, if you notice a bullish chart pattern and the RSI indicates that the asset is oversold, this could be a strong signal to enter a long position. Conversely, if a bearish pattern emerges alongside a high RSI, it might be wise to consider exiting your position or even shorting the asset.
However, it's essential to remember that no indicator is foolproof. They should be used as part of a broader trading strategy that includes risk management and market analysis. Over-reliance on any single indicator can lead to poor trading decisions. Instead, consider using a combination of indicators to confirm signals. For example, pairing moving averages with volume analysis can help validate the strength of a trend, providing a clearer picture of market dynamics.
In summary, technical indicators are invaluable tools in a trader's arsenal. They help clarify market conditions, confirm trends, and ultimately enhance trading strategies. By integrating these indicators with your charting techniques, you can navigate the complexities of the financial markets more effectively and make more informed trading decisions.
- What are technical indicators? Technical indicators are mathematical calculations based on price and volume data that help traders analyze market trends and make informed decisions.
- How do I choose the right technical indicators? The right indicators depend on your trading style and strategy. It's often beneficial to combine multiple indicators for more robust analysis.
- Can technical indicators guarantee trading success? No, while technical indicators provide valuable insights, they should be part of a comprehensive trading strategy that includes risk management.
- What is the best way to learn about technical indicators? Start by reading trading books, taking online courses, and practicing on demo accounts to understand how indicators work in real-time.

Time Frames and Their Importance
When it comes to trading, the time frame you choose can significantly influence your strategy and outcomes. Imagine you're a photographer; the lens you select determines how you capture the scene. Similarly, in trading, your time frame dictates how you perceive market movements, helping you make informed decisions. Different traders have different preferences, and understanding these can lead to enhanced trading success.
There are various time frames to consider, each with its own unique characteristics. Here are the most common time frames used in trading:
- Intraday: This includes time frames such as 1-minute, 5-minute, and 15-minute charts. Intraday trading is all about quick decisions, making it ideal for traders who thrive on rapid market movements.
- Daily: Daily charts provide a broader perspective, allowing traders to analyze trends over a 24-hour period. This time frame is popular among swing traders who hold positions for several days.
- Weekly: Weekly charts are perfect for long-term traders who want to grasp the overall market sentiment without getting bogged down by daily fluctuations.
Understanding the impact of these time frames is crucial. For instance, an intraday trader might see a price spike on a 5-minute chart that could be a mere blip in the larger context of a daily chart. Conversely, a long-term trader might ignore a short-term correction that's irrelevant to their strategy. By aligning your trading style with the appropriate time frame, you can enhance your decision-making process.
Now, let’s dive deeper into how these time frames affect trading strategies:
| Time Frame | Best Suited For | Advantages | Disadvantages |
|---|---|---|---|
| Intraday | Day Traders | Quick profits, high engagement | High stress, requires constant monitoring |
| Daily | Swing Traders | Balance of analysis and action | Less frequent trades, potential missed opportunities |
| Weekly | Position Traders | Less time commitment, long-term trends | Slow to react to market changes |
In addition to the type of trader you are, your risk tolerance and trading goals should also influence your choice of time frame. If you're someone who prefers a hands-on approach and enjoys the thrill of making multiple trades throughout the day, an intraday strategy might be your best bet. On the other hand, if you have a more patient demeanor and are looking for longer-term growth, daily or weekly charts may suit you better.
Ultimately, the key is to experiment with different time frames and find what resonates with you. Remember, even the best traders started somewhere and learned through trial and error. Don't hesitate to adjust your strategy as you gain more experience and insights into how different time frames impact your trading performance.
1. How do I choose the right time frame for my trading style?
Start by assessing your trading goals, risk tolerance, and the amount of time you can dedicate to monitoring the markets. Experiment with different time frames to see which aligns best with your strategy.
2. Can I use multiple time frames in my trading strategy?
Absolutely! Many traders use a technique called multi-time frame analysis, where they analyze the same asset across different time frames to gain a comprehensive view of market trends and potential entry or exit points.
3. Do time frames affect the accuracy of trading signals?
Yes, different time frames can yield varying signals. Shorter time frames may produce more signals, but they can also lead to noise, while longer time frames might provide clearer trends but fewer opportunities.
Short-Term vs. Long-Term Trading
When it comes to trading, the choice between short-term and long-term strategies can feel like a game of chess. Each approach has its own set of rules, advantages, and challenges, making it essential for traders to understand these differences to align their strategies with their personal goals and risk tolerance. Short-term trading, often referred to as day trading, involves executing trades within a single day or over a few days. This method is all about capitalizing on small price movements, requiring traders to be quick on their feet and have a firm grasp of market trends. Think of it like sprinting; it’s fast-paced, thrilling, but also exhausting.
On the other hand, long-term trading is more like a marathon. It involves holding onto investments for months or even years, allowing traders to ride out market fluctuations and benefit from overall growth. This approach typically requires less daily attention and can be less stressful for those who prefer a more laid-back strategy. However, it demands patience and a solid understanding of the underlying assets, as the market can be unpredictable in the short term.
To illustrate the differences further, let’s break down some key factors that differentiate these two trading styles:
| Factor | Short-Term Trading | Long-Term Trading |
|---|---|---|
| Time Horizon | Hours to days | Months to years |
| Market Analysis | Technical analysis | Fundamental analysis |
| Risk Level | Higher risk, high reward | Lower risk, steady growth |
| Time Commitment | High, requires constant monitoring | Low, periodic review |
| Fees and Commissions | Higher due to frequent trading | Lower, fewer transactions |
Ultimately, the decision between short-term and long-term trading should be based on individual preferences, lifestyle, and financial goals. If you thrive on excitement and can handle the stress of rapid trades, short-term trading might be your playground. However, if you prefer a more stable approach and have the patience to let your investments grow over time, long-term trading could be the way to go.
In conclusion, both strategies have their merits and pitfalls. The key is to find a balance that suits your personality and financial objectives. Many traders even find success by combining elements of both strategies, allowing them to adapt to changing market conditions while maximizing their potential profits.
- What is the best approach for beginners? Beginners might find long-term trading less stressful and more manageable as they learn the ropes of the market.
- Can I switch from short-term to long-term trading? Absolutely! Many traders adjust their strategies based on their experiences and market conditions.
- How do I manage risk in short-term trading? Utilizing stop-loss orders and proper position sizing can help mitigate risks.

Risk Management Strategies
When it comes to trading, risk management is not just an option; it's a necessity. It's like wearing a seatbelt in a car—while you hope you won't need it, you're grateful for it when you do. Effective risk management strategies help traders safeguard their capital and ensure longevity in the market. One of the most fundamental strategies is the use of stop-loss orders. A stop-loss order automatically sells a security when it reaches a certain price, limiting potential losses. This way, traders can set their maximum acceptable loss before entering a trade, which allows for more disciplined decision-making.
Another essential strategy is position sizing. This involves determining how much of a particular asset to buy or sell based on your overall account size and risk tolerance. For example, if you have a $10,000 trading account and decide that you’re willing to risk 1% on a single trade, your maximum loss would be $100. This means that if a trade goes against you, you can only lose $100 before you reevaluate your strategy. Calculating position size can be done using the formula:
| Account Size | Risk Percentage | Maximum Loss | Trade Size |
|---|---|---|---|
| $10,000 | 1% | $100 | Determined by entry and stop-loss levels |
Furthermore, diversifying your portfolio is another critical risk management strategy. Just as you wouldn’t put all your eggs in one basket, diversifying your investments across different asset classes can help mitigate risks. If one asset class underperforms, others may compensate for the loss, providing a more stable overall return. This can include a mix of stocks, bonds, and commodities, depending on your risk appetite.
Additionally, keeping an eye on market conditions is vital. Economic indicators, geopolitical events, and market sentiment can all influence asset prices significantly. By staying informed and adjusting your trading strategy accordingly, you can better manage your risk. For instance, during periods of high volatility, you might choose to reduce your position sizes or tighten your stop-loss orders to protect your capital.
Lastly, it’s essential to maintain a trading journal. Documenting your trades, including the rationale behind each decision, the outcome, and the emotions you experienced, can provide invaluable insights. Over time, this practice can help you identify patterns in your trading behavior and refine your risk management strategies accordingly. After all, learning from past experiences is one of the best ways to improve future performance.
- What is the best way to manage risk in trading?
Using a combination of stop-loss orders, position sizing, and diversification is often considered the best approach to managing risk. - How much of my capital should I risk on a single trade?
Many traders recommend risking no more than 1-2% of your total capital on any single trade to protect your account from significant losses. - Why is a trading journal important?
A trading journal helps you track your trades, evaluate your strategies, and learn from your successes and mistakes, ultimately improving your trading performance.
Frequently Asked Questions
- What are the most common types of charts used in trading?
The most common types of charts used in trading are line charts, bar charts, and candlestick charts. Each of these chart types serves a unique purpose and provides different insights into market trends. For example, line charts are great for visualizing price movements over time, while candlestick charts offer more detailed information about price action within specific time frames.
- How can I identify key chart patterns?
Identifying key chart patterns involves looking for specific formations that indicate potential market movements. Popular patterns include head and shoulders, triangles, and flags. To recognize these patterns, traders often use a combination of visual analysis and technical indicators to confirm their findings. It’s like spotting a hidden treasure map; once you know what to look for, the journey becomes much clearer!
- What are reversal patterns and how do I use them?
Reversal patterns, such as double tops and bottoms, signal potential changes in market trends. To use them effectively, traders should look for these formations on their charts and consider them as indicators for making strategic trading decisions. Think of them as warning signs on a road; they alert you to potential changes ahead, allowing you to adjust your course accordingly.
- What role does volume analysis play in trading?
Volume analysis is crucial because it provides additional context to chart patterns. By examining the volume alongside price movements, traders can confirm trends and enhance the accuracy of their trade entries and exits. It’s like having a second pair of eyes; it helps verify what you’re seeing and adds depth to your trading decisions.
- How do technical indicators complement charting techniques?
Technical indicators, such as Moving Averages and the Relative Strength Index (RSI), complement charting techniques by providing additional data points. They help traders analyze market conditions and identify potential entry or exit points. Using these indicators is akin to having a well-equipped toolbox; they give you the right tools to tackle various trading scenarios effectively.
- Why is choosing the right time frame important in trading?
Choosing the right time frame is essential because it significantly impacts your trading strategy and decision-making process. Different time frames, such as daily, weekly, and intraday, can lead to different trading outcomes. It’s like picking the right lens for a camera; the perspective changes how you see the market and influences your trading decisions.
- What are some effective risk management strategies?
Effective risk management strategies include using stop-loss orders and determining position sizes based on your capital and risk tolerance. These strategies help protect your investments while allowing you to utilize charting techniques effectively. Think of risk management as wearing a seatbelt in a car; it’s a safety measure that keeps you secure while navigating the twists and turns of trading.