How to Analyze Market Cycles for Better Trading
Understanding market cycles is crucial for anyone looking to enhance their trading strategies. Market cycles are essentially the natural ebb and flow of financial markets, reflecting the collective emotions, behaviors, and decisions of investors. By analyzing these cycles, traders can gain valuable insights into when to enter or exit trades, ultimately leading to improved outcomes. Imagine riding a wave; if you can anticipate its rise and fall, you can catch the perfect moment to surf. In the same way, recognizing market cycles can help you ride the waves of financial success.
Market cycles are recurring patterns in financial markets that can significantly impact trading decisions. They are influenced by a variety of factors including economic indicators, investor sentiment, and overall market conditions. By recognizing these cycles, traders can anticipate market movements and make informed decisions based on historical trends. Think of market cycles as the heartbeat of the economy; understanding its rhythm can help you stay in tune with potential opportunities. Traders who grasp these cycles are often better equipped to navigate the unpredictable nature of the markets and capitalize on profitable trades.
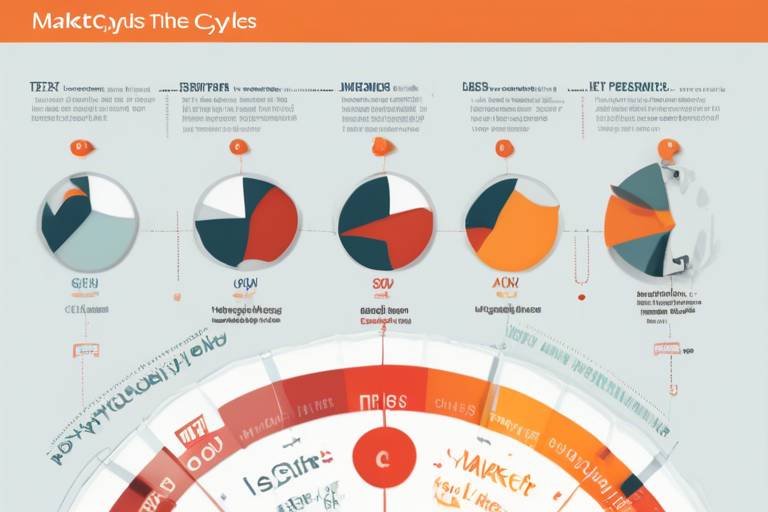
Market phases can be categorized into four main segments: accumulation, markup, distribution, and markdown. Each of these phases has distinct characteristics that can guide traders in their decision-making process. Identifying these phases is like reading a map; it helps you navigate the complex landscape of trading. For instance, during the accumulation phase, savvy investors are quietly buying undervalued assets, setting the stage for future price increases. Understanding these phases can enhance a trader's ability to enter and exit positions strategically, ultimately leading to more successful trades.
During the accumulation phase, the market is often characterized by low volatility and increasing trading volume. This is the time when informed investors are purchasing undervalued assets, anticipating that prices will rise in the future. Recognizing this phase can help traders identify optimal entry points for long-term investments. It’s akin to planting a seed; with the right conditions, it will grow into something fruitful. Traders who can spot the accumulation phase are positioned to capitalize on upcoming price movements and can benefit significantly from the subsequent markup phase.
The accumulation phase exhibits specific characteristics that traders should look out for. These include:
- Low volatility in price movements
- Increasing trading volume, indicating growing interest
- Price stability, as investors accumulate positions
By recognizing these signs, traders can position themselves to take advantage of the potential price increases that follow.
To maximize opportunities during the accumulation phase, traders can implement several effective strategies. These include:
- Dollar-cost averaging: This involves investing a fixed amount of money at regular intervals, regardless of the asset's price, which can help mitigate risks.
- Utilizing technical indicators: Tools like moving averages can confirm bullish trends and provide a clearer picture of market sentiment.
By employing these strategies, traders can make informed decisions and enhance their chances of success in the market.
Following the accumulation phase is the markup phase, where prices begin to rise, and market enthusiasm grows. This is often the most exciting time for traders, as the potential for profits increases significantly. Understanding this phase allows traders to maximize their gains by riding the upward trend. It’s like being on a rollercoaster; once you’re at the top, it’s time to enjoy the ride down, but with caution. Traders who can recognize the transition into the markup phase can position themselves to benefit from the upward momentum.
Market corrections are a natural part of the trading landscape and are essential to understand. They provide opportunities for traders to buy at lower prices, essentially allowing them to "stock up" before the next potential rise. Recognizing the signs of corrections can lead to more strategic trading decisions. It’s crucial to differentiate between healthy corrections that provide buying opportunities and severe corrections that may signal deeper issues in the market.
Corrections can be categorized as:
- Healthy corrections: These are typically short-term pullbacks that occur in a longer-term uptrend, providing excellent buying opportunities.
- Severe corrections: These often indicate a more significant shift in market sentiment and may require a reevaluation of trading strategies.
Understanding the differences between these types of corrections can help traders navigate market downturns and adjust their strategies accordingly.
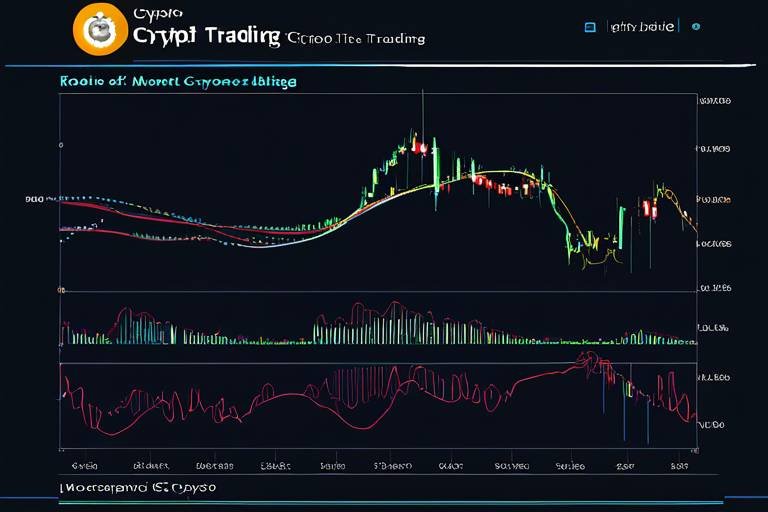
Technical analysis is a crucial tool for analyzing market cycles. By studying charts and patterns, traders can gain insights into potential price movements and market sentiment. It’s like having a treasure map; the more clues you gather, the closer you get to finding the treasure. Key indicators such as moving averages and the relative strength index (RSI) provide valuable information about market trends, helping traders make informed decisions.
Some of the essential indicators to consider include:
- Moving Averages: These help smooth out price data to identify trends over a specific period.
- Relative Strength Index (RSI): This momentum oscillator measures the speed and change of price movements, indicating overbought or oversold conditions.
Utilizing these indicators can significantly enhance a trader’s decision-making process and improve their chances of success.
Recognizing chart patterns is another vital aspect of technical analysis. Patterns like head and shoulders or double tops can signal potential reversals or continuations in market trends. Mastering these patterns is akin to learning the language of the market; it allows traders to communicate effectively with the price movements. By honing in on these patterns, traders can significantly improve their trading success and make more informed decisions.
- What are market cycles? Market cycles are the recurring patterns of price movements in financial markets influenced by various factors.
- How can I identify the accumulation phase? Look for low volatility, increasing volume, and stable prices to identify the accumulation phase.
- What is the importance of technical analysis? Technical analysis helps traders understand market trends and make informed decisions based on price movements.

Understanding Market Cycles
Market cycles are like the heartbeat of the financial world, pulsating with rhythm and predictability. Just as seasons change, so do the markets, and understanding these cycles is crucial for anyone looking to navigate the often tumultuous waters of trading. By recognizing the patterns that emerge over time, traders can anticipate market movements and make informed decisions based on historical trends. It's almost like having a secret map that leads you to treasure, isn't it?
At their core, market cycles consist of four primary phases: accumulation, markup, distribution, and markdown. Each phase has its own unique characteristics, much like the different stages of a plant's growth. In the accumulation phase, savvy investors buy undervalued assets, setting the stage for future price increases. The markup phase follows, where optimism reigns and prices begin to soar. However, the excitement doesn't last forever; eventually, the market reaches a peak, leading to the distribution phase, where investors start to cash out. Finally, the markdown phase hits, often marked by a decline in prices as the market cools down.
Understanding these phases isn't just for the experts; it's essential for anyone who wants to succeed in trading. For instance, during the accumulation phase, prices are typically low, and the market experiences low volatility. This is a prime time for traders to enter the market, as they can purchase assets at a bargain. On the flip side, recognizing the distribution phase can help traders avoid getting caught in the hype and selling at the right time, maximizing their profits.
To effectively analyze market cycles, traders should pay attention to various indicators and signals. For example, observing trading volume can provide insights into the strength of a market phase. High volume during accumulation could indicate strong buying interest, while low volume during markdown might suggest a lack of selling pressure. Additionally, employing technical analysis tools can help traders identify trends and potential reversals, further enhancing their ability to navigate the cycles.
Ultimately, understanding market cycles is about being proactive rather than reactive. By equipping yourself with the knowledge of these phases, you can position yourself to make smarter trading decisions. It's like being a surfer waiting for the perfect wave; you need to know when to paddle out and when to ride the wave to shore. So, keep your eyes peeled for those cycles, and you'll be one step closer to mastering the art of trading.

Identifying Market Phases
Understanding market phases is crucial for any trader looking to enhance their trading strategy. Market phases can be broadly categorized into four distinct segments: accumulation, markup, distribution, and markdown. Each phase represents a unique period in the market cycle, characterized by specific investor behaviors and price movements. By identifying these phases, traders can better time their entries and exits, ultimately leading to improved trading outcomes.
The accumulation phase is where the savvy investor thrives. During this stage, prices are often low, and informed traders begin to buy undervalued assets. This phase is marked by a sense of caution among the general public, as many investors are still skeptical about the market's potential. However, those who recognize the signs of accumulation can seize the opportunity to build their positions before the market shifts.
Next, we move into the markup phase, which is characterized by rising prices and increasing market enthusiasm. As more investors become aware of the upward trend, buying pressure intensifies, pushing prices even higher. This phase can be likened to a snowball effect; as more people join in, the momentum builds, creating a powerful upward trajectory that savvy traders can ride for profit.
Once the market reaches a certain peak, it transitions into the distribution phase. Here, early investors start to sell their holdings to take profits, and market sentiment begins to shift. This phase can be tricky, as it often leads to increased volatility. Traders must be vigilant during this time, as recognizing the signs of distribution can help them avoid potential losses.
Finally, we encounter the markdown phase, where prices begin to decline, and fear takes hold of the market. This phase can be likened to a rollercoaster ride—what goes up must come down. During markdown, many investors panic and sell, leading to further price drops. However, astute traders can view this as an opportunity to buy at lower prices, positioning themselves for the next accumulation phase.
To summarize, recognizing these market phases is essential for effective trading. Understanding when to buy and sell can significantly impact a trader's profitability. By keeping an eye on market indicators and sentiment, traders can navigate these phases with confidence. Below is a table that highlights the characteristics of each market phase:
| Market Phase | Characteristics |
|---|---|
| Accumulation | Low prices, cautious investors, increasing volume |
| Markup | Rising prices, growing enthusiasm, increased buying |
| Distribution | Peak prices, profit-taking, heightened volatility |
| Markdown | Declining prices, fear and panic selling, potential buying opportunities |
By mastering the identification of these market phases, traders can position themselves strategically, making informed decisions that lead to greater success in their trading endeavors.
1. What are market phases?
Market phases refer to the different stages that financial markets go through, including accumulation, markup, distribution, and markdown. Each phase has distinct characteristics that can influence trading strategies.
2. How can I identify the accumulation phase?
The accumulation phase is often identified by low volatility, increasing trading volume, and the presence of informed investors buying undervalued assets.
3. What should I do during the markdown phase?
During the markdown phase, it can be wise to assess your positions carefully. While many investors may panic and sell, this phase can also present buying opportunities for savvy traders who recognize the potential for future gains.

Accumulation Phase
The is a critical time in the market where savvy investors take advantage of undervalued assets. Imagine a fisherman patiently waiting for the perfect catch; this is how traders should approach this phase. It’s all about timing and recognizing the right moment to dive in. During this phase, prices are generally low, and the market sentiment is often pessimistic. However, this is the golden opportunity for astute traders to position themselves for future gains.
Understanding the accumulation phase can help traders identify prime entry points for long-term investments. It’s like planting seeds in a garden, knowing that with the right care, they’ll blossom into something beautiful. The key here is to look for signs that indicate the market is ready to turn around. These signs often include lower volatility and increasing trading volume. When you see these indicators, it’s like hearing the first notes of a symphony; you know something great is about to unfold.
During the accumulation phase, you’ll notice a few distinct characteristics:
- Low Volatility: Prices tend to fluctuate less, indicating a period of consolidation.
- Increasing Trading Volume: As smart investors begin to buy, the trading volume starts to rise, signaling growing interest.
- Pessimistic Market Sentiment: The general mood is often negative, which can deter less experienced traders.
Recognizing these signs can position traders to capitalize on upcoming price movements, much like a surfer waiting for the perfect wave. When the conditions are just right, you can ride the wave of opportunity to success.
Effective strategies during the accumulation phase can significantly enhance your trading outcomes. Here are a couple of approaches to consider:
- Dollar-Cost Averaging: This involves investing a fixed amount of money at regular intervals, regardless of the asset's price. It’s a way to spread out your risk and can lead to better overall pricing.
- Utilizing Technical Indicators: Tools like moving averages and MACD can help confirm bullish trends, giving you the confidence to make informed decisions.
By employing these strategies, traders can navigate the accumulation phase with greater assurance, setting themselves up for long-term success. Think of it as preparing for a marathon; the right training and strategy can make all the difference when it’s time to race.
As you dive into the world of trading, remember that the accumulation phase is not just about buying low; it’s about understanding the market’s pulse and positioning yourself wisely. With patience and the right strategies, you can turn this phase into a profitable venture.
Q1: What is the accumulation phase in trading?
A1: The accumulation phase is a period where investors buy undervalued assets before a potential price increase, characterized by low volatility and increasing trading volume.
Q2: How can I identify the accumulation phase?
A2: Look for signs such as low price fluctuations, rising trading volume, and a general negative market sentiment. These indicators suggest that savvy investors are starting to accumulate assets.
Q3: What strategies should I use during the accumulation phase?
A3: Strategies like dollar-cost averaging and using technical indicators can help you make informed decisions during the accumulation phase.
Q4: Why is understanding the accumulation phase important?
A4: Understanding this phase allows traders to identify optimal entry points for long-term investments, ultimately leading to better trading outcomes.

Characteristics of Accumulation
The accumulation phase is a critical period in the market cycle that often goes unnoticed by many traders. This phase is where the groundwork for future price increases is laid. During accumulation, savvy investors and institutions begin to purchase undervalued assets, often leading to a significant shift in market sentiment. One of the most striking characteristics of this phase is the low volatility that typically accompanies it. Prices tend to move sideways, creating a calm before the storm. This relative stability can be deceptive, as it often masks the underlying buying pressure that is building up.
Another defining feature of the accumulation phase is the increasing trading volume. As more investors recognize the potential in undervalued assets, trading activity begins to pick up. This surge in volume is a telltale sign that a shift in market dynamics is on the horizon. Traders who are alert to these changes can position themselves advantageously. It's like watching a pot of water slowly come to a boil; the heat is on, but the real action is just around the corner.
In addition to low volatility and increased volume, traders should also look for positive sentiment indicators. These might include favorable news coverage, analyst upgrades, or increasing interest on social media platforms. When you start to see these signs, it's a good indication that the market is entering the accumulation phase. It's crucial to understand that this phase is not just about buying; it's about recognizing the right moment to enter the market. Timing is everything, and being able to identify these characteristics can set you up for success.
To summarize, the key characteristics of the accumulation phase include:
- Low Volatility: Prices remain stable, creating a false sense of security.
- Increasing Trading Volume: As more investors buy in, volume begins to rise, signaling potential price movements.
- Positive Sentiment Indicators: Look for news and social media activity that suggests growing interest in the asset.
Recognizing these characteristics can empower traders to make informed decisions. By understanding the accumulation phase, traders can identify optimal entry points for long-term investments, ultimately enhancing their trading strategies. Remember, the accumulation phase is the calm before the storm, and being prepared can make all the difference in your trading journey.
- What is the accumulation phase? The accumulation phase is a market cycle phase where undervalued assets are bought by investors, leading to potential price increases.
- How can I identify the accumulation phase? Look for low volatility, increasing trading volume, and positive sentiment indicators to identify this phase.
- Why is understanding the accumulation phase important? Recognizing this phase allows traders to make informed decisions about entry points for long-term investments.

Strategies for Accumulation
When it comes to the accumulation phase, having a solid strategy is like having a treasure map; it guides you to potential profits while minimizing risks. One of the most effective strategies during this phase is dollar-cost averaging. This approach involves consistently investing a fixed amount of money into an asset, regardless of its price. By doing so, you can take advantage of lower prices during market dips, ultimately lowering your average purchase cost over time. Imagine you're buying apples: some days they’re on sale, and other days they’re not. If you buy a little each week, you end up paying a fair price overall.
Another strategy worth considering is the use of technical indicators. Indicators such as the Moving Average Convergence Divergence (MACD) and the Relative Strength Index (RSI) can help you confirm bullish trends. For instance, if the RSI shows that an asset is oversold, it might indicate that it’s a good time to buy. Think of these indicators as your trading compass; they help steer you in the right direction when navigating through market fluctuations.
Moreover, keeping an eye on trading volume can provide additional insights. High trading volume during the accumulation phase often signals strong interest from institutional investors, which can lead to significant price increases. It’s like watching a crowd gather at a concert; the more people you see, the more likely it is that something exciting is about to happen.
Lastly, consider setting price alerts for the assets you’re interested in. Many trading platforms allow you to set notifications for specific price levels. This way, you won’t miss a buying opportunity when the price dips to your desired level. It’s like having a personal assistant who whispers in your ear when it’s time to act!
By implementing these strategies—dollar-cost averaging, utilizing technical indicators, monitoring trading volume, and setting price alerts—you can position yourself to make informed decisions during the accumulation phase. Remember, the goal is to gather as much knowledge as possible to enhance your trading prowess.
- What is the accumulation phase? The accumulation phase is when investors buy undervalued assets, leading to potential price increases.
- How can I identify the accumulation phase? Look for low volatility and increasing trading volume, which typically indicate that savvy investors are entering the market.
- What is dollar-cost averaging? It’s an investment strategy where you consistently invest a fixed amount of money into an asset over time, regardless of its price.
- What technical indicators should I use? Key indicators include the Moving Average Convergence Divergence (MACD) and the Relative Strength Index (RSI).

Markup Phase
The is an exhilarating time for traders, characterized by a surge in prices and a palpable sense of excitement in the market. After the accumulation phase, where investors quietly scoop up undervalued assets, the markup phase is like the grand reveal of a magician's trick—it’s when the hard work starts to pay off. During this phase, the demand for assets increases significantly, pushing prices higher and creating a buzz that attracts even more investors. This is the moment when traders can really capitalize on the momentum generated by earlier accumulation.
As prices begin to rise, the market sentiment shifts from skepticism to optimism. The key here is to recognize that the markup phase doesn't just happen overnight; it develops gradually as more traders become aware of the potential for profit. This is where understanding market psychology becomes crucial. Investors who have been waiting on the sidelines may finally decide to jump in, further fueling the upward trend. The excitement is contagious, and before you know it, everyone wants a piece of the action.
To navigate this phase effectively, traders should be on the lookout for specific indicators and patterns that signal the strength of the upward movement. For instance, rising trading volumes often accompany price increases, indicating that the demand is genuine and not just a temporary spike. Additionally, it’s essential to monitor the overall market sentiment through news and social media, as positive coverage can amplify the enthusiasm surrounding a particular asset or market segment.
Here are a few key strategies to consider during the markup phase:
- Momentum Trading: This strategy involves buying assets that are trending upward, riding the wave of momentum. Traders often use technical indicators like the Relative Strength Index (RSI) to identify overbought conditions, which can help them determine when to enter or exit trades.
- Trailing Stops: Implementing trailing stops can help protect profits as prices rise. By setting a stop-loss order that moves up with the price, traders can lock in gains while still allowing for potential further increases.
- Market Sentiment Analysis: Keeping an eye on news articles, social media chatter, and analyst reports can provide insights into the overall sentiment. Positive sentiment can indicate that the markup phase is likely to continue, while negative news might signal a potential reversal.
Understanding the markup phase is not just about recognizing rising prices; it’s about grasping the underlying dynamics that drive those prices up. By combining technical analysis with an awareness of market psychology, traders can position themselves to maximize profits during this thrilling phase of market cycles. The key is to remain vigilant and adaptable, ready to seize opportunities as they arise while being mindful of the risks involved.
Q1: How long does the markup phase typically last?
A1: The duration of the markup phase can vary significantly depending on market conditions and investor sentiment. It can last from a few weeks to several months, but the key is to remain attentive to signs of a potential reversal.
Q2: What indicators are best for identifying the markup phase?
A2: Traders often look for increasing trading volumes, rising prices, and positive market sentiment. Technical indicators like moving averages and the RSI can also provide valuable insights during this phase.
Q3: Can the markup phase occur in bear markets?
A3: Yes, it is possible for a markup phase to occur within a bear market, often referred to as a bear market rally. However, these rallies may be short-lived, so caution is advised.

Recognizing Market Corrections
Market corrections can feel like a rollercoaster ride—one moment you're soaring high, and the next, you're plummeting down. But fear not! Understanding these corrections is crucial for any trader looking to seize opportunities in the market. So, what exactly is a market correction? In simple terms, it's a decline in the price of an asset, typically defined as a drop of 10% or more from its recent peak. Recognizing these moments can empower you to make smarter trades and buy at lower prices, maximizing your potential for profit.
It's essential to differentiate between the two primary types of corrections: healthy and severe. Healthy corrections are like a breath of fresh air for the market, allowing overvalued assets to cool off and reset before continuing their upward trajectory. On the other hand, severe corrections can send shockwaves through the market, often resulting in panic selling and a more prolonged downturn. Knowing the difference can help you navigate these turbulent waters with confidence.
To identify market corrections, keep an eye out for certain indicators. For instance, sudden spikes in trading volume can signal a shift in market sentiment, while a series of lower highs and lower lows on price charts might indicate that a correction is underway. Additionally, pay attention to the overall economic landscape; external factors such as geopolitical events or changes in monetary policy can trigger corrections. By staying informed and vigilant, you can position yourself to take advantage of these market fluctuations.
Now, you might be wondering, how do I prepare for a market correction? Here are some strategies to consider:
- Set Stop-Loss Orders: Protect your investments by placing stop-loss orders to limit potential losses during downturns.
- Diversify Your Portfolio: Spread your investments across various asset classes to minimize risk.
- Stay Informed: Regularly monitor market news and trends to anticipate potential corrections.
By recognizing the signs of market corrections and understanding their implications, you can turn potential pitfalls into profitable opportunities. So, the next time the market takes a dip, remember that it could be your chance to buy low and ride the wave back up!
1. What is a market correction?
A market correction is typically defined as a decline of 10% or more in the price of an asset from its recent peak. It represents a temporary downturn in the market.
2. How can I identify a market correction?
Look for sudden changes in trading volume, a series of lower highs and lows on price charts, and consider external economic factors that may influence market sentiment.
3. What should I do during a market correction?
Consider setting stop-loss orders, diversifying your portfolio, and staying informed about market trends to navigate corrections effectively.

Types of Corrections
When it comes to trading, understanding the different types of market corrections is crucial for making informed decisions. Corrections are essentially price declines that occur within a broader trend, and they can be classified into two main categories: healthy corrections and severe corrections. Each type has its own characteristics and implications for traders, and recognizing these differences can enhance your trading strategy.
Healthy corrections are often seen as a natural part of market dynamics. They typically occur after a strong price increase and represent a temporary pullback. In these situations, the market may lose about 10% to 20% of its value before resuming its upward trajectory. Healthy corrections can be likened to a runner taking a breather after a sprint; they allow the market to consolidate gains and prepare for the next leg of growth.
On the other hand, severe corrections can be more alarming. These are characterized by significant price declines, often exceeding 20%, and can lead to long-term bearish sentiments. Severe corrections may be triggered by various factors such as economic downturns, geopolitical instability, or drastic changes in market sentiment. They can feel like a sudden storm disrupting a calm day at the beach, leaving traders scrambling to adjust their positions.
To better illustrate the differences, consider the following table that outlines the key features of healthy and severe corrections:
| Type of Correction | Price Decline | Duration | Market Sentiment |
|---|---|---|---|
| Healthy Correction | 10% - 20% | Short-term | Generally Positive |
| Severe Correction | Exceeds 20% | Long-term | Bearish |
Recognizing these types of corrections allows traders to adjust their strategies accordingly. For instance, during a healthy correction, traders might see an opportunity to buy assets at lower prices, anticipating a rebound. In contrast, during a severe correction, it may be prudent to reassess positions and consider risk management strategies to protect capital.
In summary, understanding the types of corrections in the market is essential for any trader looking to navigate the complexities of financial trading effectively. By identifying whether a correction is healthy or severe, you can make more informed decisions that align with your trading goals.
- What is a market correction? A market correction is a decline in the price of an asset or market index, typically defined as a drop of 10% or more from its recent peak.
- How long do corrections usually last? Healthy corrections can last from a few days to several weeks, while severe corrections may extend for months or longer.
- Should I buy during a correction? It depends on the type of correction. Healthy corrections may present buying opportunities, while severe corrections may require caution and reevaluation of your investment strategy.

Using Technical Analysis
When it comes to trading, is like having a map in uncharted waters. It guides traders through the often turbulent seas of the market, helping them make sense of price movements and trends. By studying past price action, traders can identify patterns that may repeat themselves, enabling them to predict future movements. This is crucial because, in the world of trading, timing is everything. The better you understand market cycles through technical analysis, the more likely you are to make profitable trades.
One of the most effective aspects of technical analysis is its reliance on charts. These visual representations of price movements over time can reveal a wealth of information. For instance, a simple line chart can show you the overall trend, while more complex charts like candlestick charts can provide insights into market sentiment and volatility. By analyzing these charts, traders can spot potential entry and exit points, helping them capitalize on market cycles.
Moreover, there are several key indicators that traders often use to enhance their technical analysis. These indicators serve as tools to understand market conditions better and can provide signals about when to buy or sell. Some of the most popular indicators include:
- Moving Averages: These smooth out price data to identify the direction of the trend over a specific period. They can help traders see whether the market is in an uptrend or downtrend.
- Relative Strength Index (RSI): This momentum oscillator measures the speed and change of price movements. It ranges from 0 to 100 and can indicate whether an asset is overbought or oversold.
- Bollinger Bands: These bands expand and contract based on market volatility, providing insights into potential price breakouts or reversals.
Understanding how to interpret these indicators can significantly enhance a trader's decision-making process. For instance, if the RSI indicates that an asset is oversold, it might be a good time to consider buying, especially if it aligns with other signals from moving averages or chart patterns.
Speaking of chart patterns, recognizing these formations can be a game-changer. Patterns such as head and shoulders or double tops can signal potential reversals in the market. For example, a head and shoulders pattern often suggests that an uptrend is nearing its end, while a double bottom indicates a potential reversal from a downtrend. Mastering these patterns requires practice and a keen eye, but once you do, it can significantly improve your trading success.
To sum it up, technical analysis is an invaluable tool for traders looking to navigate market cycles effectively. By utilizing charts, key indicators, and recognizing chart patterns, traders can make informed decisions that align with market trends. However, it’s important to remember that no analysis is foolproof. Always combine technical analysis with other forms of research and risk management strategies to enhance your trading outcomes.
Q: What is technical analysis?
A: Technical analysis is a method used to evaluate and predict the future price movements of an asset by analyzing past price data and market trends.
Q: How can I start using technical analysis?
A: Begin by familiarizing yourself with various chart types and key indicators. Practice analyzing historical price movements and gradually incorporate these tools into your trading strategy.
Q: Is technical analysis suitable for all types of trading?
A: While technical analysis can be beneficial for various trading styles, it's particularly useful for short-term traders and day traders who rely on quick price movements.
Q: Can technical analysis guarantee profits?
A: No analysis method can guarantee profits. Technical analysis provides insights based on historical data, but market conditions can change rapidly, and risk management is essential.

Key Indicators
This article explores the importance of understanding market cycles, offering strategies to analyze them effectively for improved trading decisions and outcomes.
Market cycles are recurring patterns in financial markets. Recognizing these cycles helps traders anticipate market movements and make informed trading decisions based on historical trends.
Market phases include accumulation, markup, distribution, and markdown. Each phase has distinct characteristics, and identifying them can enhance a trader's ability to enter and exit positions strategically.
During the accumulation phase, savvy investors buy undervalued assets, leading to potential price increases. Understanding this phase can help traders identify entry points for long-term investments.
The accumulation phase is characterized by low volatility and increasing trading volume. Recognizing these signs can position traders to capitalize on upcoming price movements.
Effective strategies during the accumulation phase include dollar-cost averaging and utilizing technical indicators to confirm bullish trends, ensuring traders make informed decisions.
The markup phase follows accumulation, marked by rising prices and increased market enthusiasm. Understanding this phase allows traders to maximize profits by riding the upward trend.
Market corrections are essential to understand as they provide opportunities for traders to buy at lower prices. Recognizing the signs of corrections can lead to more strategic trading decisions.
Corrections can be categorized as healthy or severe. Understanding the differences helps traders navigate market downturns and adjust their strategies accordingly.
Technical analysis is a crucial tool for analyzing market cycles. By studying charts and patterns, traders can gain insights into potential price movements and market sentiment.
When it comes to trading, understanding is like having a compass in the wilderness; they guide you towards informed decisions. These indicators help traders gauge market sentiment, identify trends, and predict potential price movements. Some of the most impactful indicators include:
- Moving Averages: These smooth out price data to identify the direction of the trend. A simple moving average (SMA) can show you the average price over a specific period, while the exponential moving average (EMA) gives more weight to recent prices, making it more responsive to new information.
- Relative Strength Index (RSI): This momentum oscillator measures the speed and change of price movements. It ranges from 0 to 100, with readings above 70 indicating overbought conditions and below 30 suggesting oversold conditions.
- MACD (Moving Average Convergence Divergence): This indicator shows the relationship between two moving averages of a security's price. It helps identify potential buy and sell signals through crossovers and divergences.
Utilizing these indicators can significantly enhance a trader’s decision-making process. For instance, if the RSI indicates an asset is oversold, it might be a good time to consider buying. On the other hand, if the MACD shows a bearish crossover, it may signal a time to sell or avoid entering a position.
Moreover, combining multiple indicators can provide a more comprehensive view of the market. For example, using moving averages alongside the RSI can help confirm trends and reduce the chances of false signals. Just like a chef combines various ingredients to create a delicious dish, traders should blend different indicators to concoct the perfect trading strategy.
Q1: How do I choose the right indicators for my trading strategy?
A1: The right indicators depend on your trading style and the market you are analyzing. It’s essential to test different combinations and see what works best for you.
Q2: Can I rely solely on technical indicators for trading decisions?
A2: While indicators are helpful, it’s crucial to consider other factors, such as market news and economic indicators, to make well-rounded trading decisions.
Q3: How often should I check my indicators?
A3: It depends on your trading style. Day traders may check indicators frequently, while long-term investors might look at them less often.

Chart Patterns
Chart patterns are like the breadcrumbs left behind by traders in the market, providing crucial clues about future price movements. When you look at a price chart, you're not just seeing numbers; you're witnessing the collective psychology of all market participants. Recognizing these patterns can be the key to unlocking profitable trading opportunities. Some of the most common patterns include head and shoulders, double tops, and triangles. Each of these patterns tells a story about what traders are feeling and where they might be headed next.
For instance, the head and shoulders pattern is often seen as a reversal signal. It resembles a person with a head and two shoulders, indicating that the market is likely to shift direction after a bullish trend. Conversely, a double top pattern, which looks like two peaks, suggests that the market is struggling to break through a resistance level, hinting at a potential downturn. Recognizing these patterns not only helps traders make informed decisions but also enhances their ability to predict market behavior.
Let's dive deeper into some of these patterns:
| Pattern Name | Description | Implication |
|---|---|---|
| Head and Shoulders | A reversal pattern that signals a change in trend direction. | Potential bearish reversal after an uptrend. |
| Double Top | Formed after an uptrend, indicating resistance at a certain price level. | Potential bearish reversal. |
| Triangles | Can be ascending, descending, or symmetrical, indicating consolidation. | Continuation or reversal depending on breakout direction. |
Understanding these patterns is essential for any trader looking to enhance their market analysis skills. But it's not just about recognizing the patterns; it's also about understanding the context in which they appear. For example, a triangle pattern could indicate a period of consolidation before a significant price movement. Traders should pay attention to volume during these formations, as an increase in volume can confirm the breakout direction.
Moreover, combining chart patterns with other technical indicators can create a more robust trading strategy. For instance, if a trader identifies a head and shoulders pattern and simultaneously notices a bearish divergence in the Relative Strength Index (RSI), this could provide a stronger signal to exit a long position or enter a short position. In essence, the synergy between chart patterns and other analytical tools can significantly improve trading success.
What are chart patterns?
Chart patterns are formations created by the price movements of a security on a chart, which can indicate potential future price movements based on historical behavior.
How can I identify chart patterns?
You can identify chart patterns by analyzing price charts, looking for specific formations such as head and shoulders, double tops, or triangles, and confirming these patterns with volume and other technical indicators.
Are chart patterns reliable?
While chart patterns can provide valuable insights into market behavior, they are not foolproof. It's essential to use them in conjunction with other analysis methods and risk management strategies.
Frequently Asked Questions
- What are market cycles?
Market cycles are the recurring patterns in financial markets that reflect the natural ebb and flow of prices over time. Understanding these cycles helps traders anticipate potential market movements, enabling them to make more informed trading decisions based on historical trends.
- How can I identify different market phases?
Market phases include accumulation, markup, distribution, and markdown. Each phase has its own characteristics. For example, during the accumulation phase, savvy investors buy undervalued assets, while the markup phase is characterized by rising prices and increased enthusiasm. By recognizing these phases, traders can better time their entries and exits.
- What strategies can I use during the accumulation phase?
During the accumulation phase, effective strategies include dollar-cost averaging and utilizing technical indicators to confirm bullish trends. These methods help traders identify optimal entry points for long-term investments, allowing them to capitalize on potential price increases.
- What are market corrections, and why are they important?
Market corrections are temporary price declines that provide opportunities for traders to buy assets at lower prices. Recognizing the signs of corrections is crucial, as they can lead to strategic trading decisions that maximize profits when markets eventually rebound.
- What types of market corrections should I be aware of?
Corrections can be categorized as healthy or severe. Healthy corrections typically indicate a short-term pullback in an overall uptrend, while severe corrections can signal deeper issues in the market. Understanding these differences helps traders navigate downturns more effectively.
- How does technical analysis help in analyzing market cycles?
Technical analysis involves studying charts and patterns to gain insights into potential price movements and market sentiment. By utilizing key indicators like moving averages and the relative strength index (RSI), traders can enhance their decision-making process and better understand market dynamics.
- What are some key indicators I should focus on?
Key indicators include moving averages, which help identify trends, and the relative strength index (RSI), which indicates overbought or oversold conditions. By focusing on these indicators, traders can make more informed decisions about when to enter or exit trades.
- What chart patterns should I look for in trading?
Recognizing chart patterns like head and shoulders, double tops, or flags can signal potential reversals or continuations in market trends. Mastering these patterns is essential for improving trading success and making timely decisions based on market behavior.