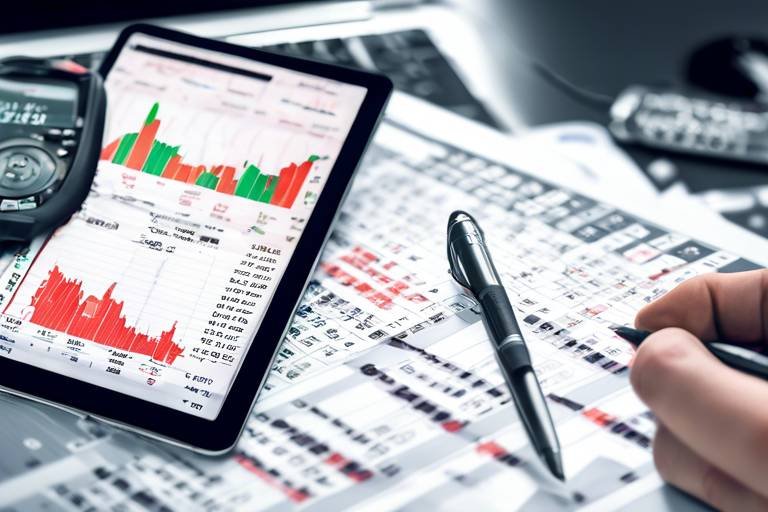
How to Analyze Price Movements Using Technical Indicators
In the fast-paced world of trading, understanding price movements is crucial for making informed decisions. Technical indicators serve as your compass, guiding you through the often turbulent waters of financial markets. These indicators are not just random numbers; they are powerful tools that help traders identify trends, reversals, and optimal entry or exit points. By leveraging these indicators, you can enhance your trading strategy and increase your chances of success. So, how do you effectively analyze price movements using these technical indicators? Let’s dive in!
Technical indicators are essentially mathematical calculations derived from price and volume data. They are designed to help traders make sense of market behavior by revealing patterns that may not be immediately apparent. Think of them as a magnifying glass that allows you to see the underlying trends and movements in the market. By analyzing these indicators, traders can identify whether a market is trending, consolidating, or reversing, which is vital information for making strategic decisions.
There are a plethora of technical indicators available, each serving a distinct purpose. They can be broadly categorized into four main types: trend indicators, momentum indicators, volatility indicators, and volume indicators. Understanding these categories is essential, as they provide unique insights into price movements and help traders tailor their strategies accordingly. Here's a brief overview of each type:
- Trend Indicators: These indicators help determine the direction of the market.
- Momentum Indicators: These measure the speed of price changes and signal potential reversals.
- Volatility Indicators: These assess the degree of price fluctuations over time.
- Volume Indicators: These analyze trading volume alongside price movements to gauge market strength.
Trend indicators are essential for any trader looking to identify the market's direction. They provide valuable insights that can significantly influence trading decisions. Two popular trend indicators are moving averages and the Average Directional Index (ADX). Moving averages smooth out price data over a specified period, making it easier to identify trends. The ADX, on the other hand, measures the strength of a trend, regardless of whether it’s upward or downward. A rising ADX indicates a strengthening trend, while a falling ADX suggests a weakening trend.
Moving averages are one of the most commonly used tools in technical analysis. They help filter out the noise from random price fluctuations, allowing traders to focus on the underlying trend. There are two main types of moving averages: simple moving averages (SMA) and exponential moving averages (EMA). The SMA calculates the average price over a specific number of periods, while the EMA gives more weight to recent prices, making it more responsive to new information. Both types can be incredibly helpful in gauging market direction.
The ADX is a unique tool that quantifies the strength of a trend. Unlike other indicators that may only indicate the direction of a trend, the ADX provides a numerical value that traders can use to assess trend strength. An ADX value above 25 typically indicates a strong trend, while a value below 20 suggests a weak trend. By keeping an eye on the ADX, traders can make more informed decisions about when to enter or exit trades.
Momentum indicators are designed to measure the speed of price changes. They can be particularly useful for identifying potential reversals in the market. For instance, the Relative Strength Index (RSI) and the Stochastic Oscillator are two popular momentum indicators. The RSI ranges from 0 to 100 and indicates whether an asset is overbought or oversold. Similarly, the Stochastic Oscillator compares a particular closing price to a range of prices over a specified period, providing insights into potential price reversals.
Volatility indicators assess how much the price of an asset fluctuates over time. Understanding volatility is crucial for risk management and position sizing. Tools like Bollinger Bands and the Average True Range (ATR) provide valuable insights into market volatility. Bollinger Bands consist of a moving average and two standard deviation lines, which expand and contract based on market conditions. This helps traders identify potential breakout or reversal opportunities. The ATR, on the other hand, measures the average range between high and low prices over a set period, guiding traders in their risk management strategies.
Bollinger Bands are a versatile tool that can help traders visualize market volatility. When the bands are narrow, it indicates low volatility, while wide bands suggest high volatility. Traders often look for price movements that break through the bands as potential trading signals. For example, if the price breaks above the upper band, it may indicate a bullish breakout, while a break below the lower band could suggest a bearish reversal.
The ATR is another essential tool for assessing market volatility. By calculating the average range between high and low prices, the ATR provides traders with a clearer picture of how much an asset's price typically fluctuates. A higher ATR indicates greater volatility, which can be a double-edged sword; while it presents more opportunities, it also increases risk. Understanding the ATR can help traders make better decisions regarding position sizing and stop-loss placements.
Volume indicators are crucial for analyzing the strength of price movements. They provide insights into market dynamics by examining trading volume alongside price movements. Indicators like On-Balance Volume (OBV) and the Chaikin Money Flow (CMF) help traders confirm trends and identify potential reversals. For instance, if a price increase is accompanied by high volume, it suggests strong buying interest, reinforcing the bullish trend.
Q: What are technical indicators?
A: Technical indicators are mathematical tools that help traders analyze price movements and market trends based on historical data.
Q: How do I choose the right indicators for my trading strategy?
A: The choice of indicators depends on your trading style, market conditions, and personal preferences. It's essential to experiment and find what works best for you.
Q: Can I rely solely on technical indicators for trading decisions?
A: While technical indicators are valuable tools, it's crucial to combine them with other forms of analysis, such as fundamental analysis and market sentiment.

Understanding Technical Indicators
Technical indicators are not just fancy tools; they are the bread and butter of successful trading strategies. Think of them as your personal market detectives, using mathematical calculations based on price and volume data to uncover hidden trends and potential opportunities. By analyzing these indicators, traders can make informed decisions that could lead to profitable outcomes. The beauty of technical indicators lies in their ability to simplify complex market dynamics into understandable signals.
So, how do these indicators work? They primarily focus on three key aspects: trends, momentum, and volatility. Each indicator serves a unique purpose, and together, they create a comprehensive picture of market behavior. For instance, while some indicators might tell you that a market is trending upwards, others might indicate that the momentum is slowing down, suggesting a potential reversal. This interplay of information is crucial for traders aiming to navigate the often turbulent waters of financial markets.
To give you a clearer idea, let’s break down the core functionalities of technical indicators:
- Trend Identification: Indicators like moving averages help traders spot whether the market is in an uptrend, downtrend, or sideways movement.
- Momentum Measurement: Tools such as the Relative Strength Index (RSI) gauge how quickly prices are changing, which can signal potential reversals.
- Volatility Assessment: Indicators like Bollinger Bands reveal how much prices are fluctuating, providing insights into potential breakout scenarios.
Understanding these functionalities can dramatically improve a trader's ability to make sound decisions. However, it’s essential to remember that no single indicator is foolproof. The market is influenced by numerous factors, and relying solely on one tool can lead to misguided conclusions. Instead, traders often use a combination of indicators to corroborate their findings and enhance their analysis.
In summary, technical indicators are invaluable in the trading world, offering insights that help traders decipher the often chaotic nature of financial markets. By mastering these tools, traders can increase their chances of making informed decisions, ultimately leading to better trading outcomes.

Types of Technical Indicators
When it comes to trading, understanding the different types of technical indicators is crucial for making informed decisions. These indicators serve as the compass for traders navigating the often turbulent waters of financial markets. Each type of indicator offers unique insights, and knowing how to leverage them can be the difference between a successful trade and a missed opportunity. Let's dive into the four primary categories of technical indicators: trend indicators, momentum indicators, volatility indicators, and volume indicators.
First up, we have trend indicators. These are like the weather vanes of the market, helping traders determine the overall direction of price movements. They signal whether the market is trending upwards, downwards, or sideways. Some popular trend indicators include moving averages and the Average Directional Index (ADX). For instance, moving averages smooth out price data over a specific period, allowing traders to spot trends more easily. On the other hand, the ADX measures the strength of a trend, regardless of its direction, providing valuable insight into market dynamics.
Next, we delve into momentum indicators. Think of these as the speedometers of price changes. They help traders gauge how quickly prices are moving and identify potential reversals. The Relative Strength Index (RSI) and the Stochastic Oscillator are two widely used momentum indicators. For example, the RSI can indicate overbought or oversold conditions, alerting traders to possible trend reversals and allowing them to make more strategic decisions.
Moving on to volatility indicators, these tools assess the degree of price fluctuations over time. They are essential for understanding market risk and adjusting trading strategies accordingly. Tools like Bollinger Bands and the Average True Range (ATR) fall into this category. Bollinger Bands consist of a moving average and two standard deviation lines, which expand and contract based on market conditions. This helps traders identify potential breakout or reversal opportunities. Similarly, the ATR measures the average range between high and low prices over a set period, providing insights into market volatility and aiding in risk management.
Finally, we have volume indicators. These indicators analyze trading volume alongside price movements, offering a deeper understanding of market strength. Indicators like On-Balance Volume (OBV) and the Chaikin Money Flow (CMF) help traders confirm trends and identify potential reversals. For instance, a rising OBV suggests that buying pressure is increasing, which can be a strong confirmation of an upward price trend. Conversely, a declining OBV may signal a weakening trend, prompting traders to reassess their positions.
In summary, the world of technical indicators is rich and varied, each type serving its unique purpose in helping traders decode market movements. By understanding and applying these indicators effectively, traders can enhance their decision-making process and improve their chances of success in the financial markets.

Trend Indicators
When it comes to navigating the often turbulent waters of financial markets, serve as your compass, guiding you toward potential opportunities. These indicators are essential tools for traders who want to determine the market's direction, whether it’s heading up, down, or moving sideways. Understanding how to utilize these indicators can significantly enhance your trading strategy, allowing you to make informed decisions that align with market trends.
Among the most popular trend indicators are moving averages and the Average Directional Index (ADX). Each of these tools brings its own unique perspective to the table, helping traders not only identify the prevailing trend but also assess its strength. For instance, moving averages smooth out price data over a specified period, which can make it easier to spot trends without the noise of daily price fluctuations. Think of it as a way to clear the fog on a misty morning, revealing the path ahead more clearly.
Moving averages come in various forms, but the two most commonly used are the Simple Moving Average (SMA) and the Exponential Moving Average (EMA). The SMA calculates the average price over a set number of periods, while the EMA gives more weight to recent prices, making it more responsive to new information. This responsiveness can be crucial for traders looking to catch trends early. For example, when the price crosses above the moving average, it can signal a potential buying opportunity, while a cross below may indicate a sell signal.
On the other hand, the Average Directional Index (ADX) takes trend analysis a step further by measuring the strength of a trend, irrespective of its direction. The ADX is usually plotted along with two additional lines, known as the +DI and -DI, which indicate whether the trend is upward or downward. A rising ADX value suggests a strengthening trend, while a declining ADX indicates a weakening trend. This information can be invaluable for traders as it helps them decide whether to enter or exit a position based on the strength of the market movement.
To illustrate how these indicators work together, consider the following table:
| Indicator | Purpose | Key Features |
|---|---|---|
| Simple Moving Average (SMA) | Identify market direction | Smooths price data over a specific period |
| Exponential Moving Average (EMA) | Identify market direction | More responsive to recent price changes |
| Average Directional Index (ADX) | Measure trend strength | Indicates whether the trend is strong or weak |
In summary, trend indicators are indispensable tools for traders looking to harness the power of market movements. By understanding how to effectively use moving averages and the ADX, you can gain a clearer picture of market trends, making it easier to navigate your trading journey. Whether you're a seasoned trader or just starting out, mastering these indicators can provide you with the edge you need to succeed.
What are trend indicators?
Trend indicators are tools used by traders to determine the direction of price movements in the market. They help identify whether a market is trending upward, downward, or sideways.
How do moving averages work?
Moving averages calculate the average price of an asset over a specific time period, smoothing out price fluctuations to help traders spot trends.
What is the Average Directional Index (ADX)?
The ADX is a trend strength indicator that measures the strength of a trend without indicating its direction, helping traders assess whether to enter or exit positions based on trend strength.

Moving Averages
When it comes to analyzing price movements, are like the comforting blanket of technical indicators. They help smooth out the noise in price data, allowing traders to see the underlying trend more clearly. Imagine trying to spot a pattern in a chaotic painting; moving averages act as your lens, bringing the important strokes into focus. There are two main types of moving averages that traders often rely on: the Simple Moving Average (SMA) and the Exponential Moving Average (EMA).
The Simple Moving Average is calculated by taking the average price of an asset over a specific number of periods. For example, if you're looking at a 20-day SMA, you would add up the closing prices of the last 20 days and divide by 20. This method gives equal weight to all prices in the calculation, which can sometimes lag behind the current price action. However, it's great for identifying longer-term trends.
On the other hand, the Exponential Moving Average gives more weight to recent prices, making it more responsive to new information. This characteristic can be particularly beneficial in fast-moving markets. Traders often use the EMA to spot short-term trends, helping them to make quicker decisions. For instance, a common strategy is to look for crossovers between a short-term EMA and a long-term EMA. When the short-term EMA crosses above the long-term EMA, it can signal a bullish trend, while the opposite crossover may indicate a bearish trend.
To illustrate the differences between these two types, consider the following table:
| Indicator | Calculation Method | Weighting | Best Use |
|---|---|---|---|
| Simple Moving Average (SMA) | Average of prices over a specified period | Equal weight | Long-term trend identification |
| Exponential Moving Average (EMA) | Weighted average, more emphasis on recent prices | More weight on recent prices | Short-term trend identification |
Both moving averages can be powerful tools when used in conjunction with other indicators. For example, many traders look for convergence and divergence between price and moving averages to confirm trends or signal potential reversals. When the price is consistently above the moving average, it typically indicates a strong uptrend. Conversely, if the price is below the moving average, it may suggest a downtrend.
However, relying solely on moving averages can lead to missed opportunities, especially in volatile markets. It’s crucial to combine them with other technical indicators to enhance your analysis. This multi-faceted approach can help you make more informed trading decisions and potentially increase your profitability.
1. What is the main purpose of using moving averages in trading?
Moving averages are primarily used to identify trends and potential reversal points in the market. They help traders smooth out price data and eliminate noise, making it easier to spot significant movements.
2. How do I choose the right period for a moving average?
The choice of period depends on your trading style. Shorter periods (e.g., 10 or 20 days) are better for day trading or short-term strategies, while longer periods (e.g., 50 or 200 days) are suited for longer-term investments.
3. Can moving averages be used in any market?
Yes, moving averages can be applied to any financial market, including stocks, forex, and cryptocurrencies. They are versatile tools that can help traders in various market conditions.
4. Are moving averages effective on their own?
While moving averages are useful, they are most effective when used in conjunction with other technical indicators and analysis methods. This helps confirm signals and reduces the likelihood of false positives.

Average Directional Index (ADX)
The is a powerful tool in the arsenal of traders, designed to measure the strength of a trend, regardless of its direction. It's like having a compass in the vast ocean of financial markets; it tells you not just where the wind is blowing, but how strong that wind is. Understanding the ADX can significantly enhance your trading strategy by helping you identify whether to enter a trade, hold your position, or exit before the tide turns against you.
Typically, the ADX is plotted as a single line on a chart, with values ranging from 0 to 100. A common interpretation is:
| ADX Value | Trend Strength |
|---|---|
| 0 - 25 | No Trend |
| 25 - 50 | Strong Trend |
| 50 - 75 | Very Strong Trend |
| 75 - 100 | Extreme Trend |
When the ADX is below 25, it typically indicates a weak trend or no trend at all. This is a cautionary signal for traders, suggesting that the market might be in a consolidation phase, where price movements are unpredictable and could lead to losses if trades are entered without proper analysis. As the ADX climbs above 25, it signifies a strengthening trend, allowing traders to confidently position themselves in the direction of the market.
One of the most effective ways to use the ADX is in conjunction with two additional lines, known as the +DI (Positive Directional Indicator) and -DI (Negative Directional Indicator). These two indicators help traders determine the direction of the trend. When the +DI line crosses above the -DI line, it indicates a potential buying opportunity, while a cross below suggests a selling opportunity. This combination can provide a clearer picture of market dynamics:
- +DI above -DI: Consider buying.
- -DI above +DI: Consider selling.
Moreover, the ADX does not indicate the trend's direction; it solely measures its strength. Therefore, it’s essential to combine the ADX with other indicators to get a complete picture. For instance, using the ADX alongside moving averages can provide a robust framework for making informed trading decisions. Think of it as a marriage between strength and direction — one tells you how strong the trend is, while the other guides you on where to go.
In summary, the ADX is an invaluable tool for traders looking to navigate the complexities of financial markets. By understanding how to interpret its values and using it in conjunction with other indicators, you can make more informed trading decisions, ultimately leading to greater success in your trading endeavors. So, the next time you analyze price movements, remember to check the ADX — it might just be the key to unlocking your trading potential!
Q1: What does a high ADX value indicate?
A high ADX value (above 25) indicates a strong trend, whether it's upward or downward. It suggests that traders can confidently enter trades in the direction of the trend.
Q2: Can I use ADX for short-term trading?
Yes! The ADX can be used for short-term trading strategies. However, it’s crucial to combine it with other indicators for better accuracy.
Q3: Does ADX provide buy or sell signals?
No, the ADX itself does not provide direct buy or sell signals; it only measures trend strength. You should use it in conjunction with +DI and -DI for directional signals.
Q4: What is the best period to set the ADX?
The default setting for ADX is usually 14 periods, but traders can adjust this based on their trading style and the market they are analyzing.

Momentum Indicators
Momentum indicators are essential tools for traders looking to gauge the strength of price movements. These indicators help determine whether a trend is likely to continue or if a reversal is imminent. Think of momentum indicators as the pulse of the market; they measure the speed and change of price movements, giving traders crucial insights into potential buying or selling opportunities. By understanding momentum, traders can make more informed decisions, ensuring they are not just chasing the market but rather riding the waves of price action.
One of the most popular momentum indicators is the Relative Strength Index (RSI). This indicator operates on a scale from 0 to 100 and is typically used to identify overbought or oversold conditions in a market. When the RSI exceeds 70, it suggests that an asset may be overbought, indicating a potential price correction. Conversely, an RSI below 30 indicates that an asset may be oversold, suggesting a possible price rebound. Traders often use this information to time their entries and exits effectively, ensuring they capitalize on market movements.
Another widely used momentum indicator is the Stochastic Oscillator. This tool compares a particular closing price of an asset to its price range over a specified period. The Stochastic Oscillator also operates on a scale from 0 to 100, with values above 80 indicating overbought conditions and values below 20 indicating oversold conditions. Traders often look for divergences between the Stochastic Oscillator and price movements, as these can signal potential reversals. For instance, if prices are making new highs but the Stochastic Oscillator is not, it may suggest that the upward momentum is weakening.
| Indicator | Scale | Overbought Level | Oversold Level |
|---|---|---|---|
| Relative Strength Index (RSI) | 0 - 100 | Above 70 | Below 30 |
| Stochastic Oscillator | 0 - 100 | Above 80 | Below 20 |
Traders often find that combining momentum indicators with other types of technical analysis can enhance their trading strategies. For example, using momentum indicators alongside trend indicators can provide a clearer picture of market conditions. When a momentum indicator signals overbought conditions in an uptrend, it might be a cue to lock in profits. Conversely, if an oversold condition appears during a downtrend, it could signal a potential bounce that traders may want to take advantage of.
In conclusion, momentum indicators are invaluable tools in a trader's toolkit. They provide insights into the strength of price movements and help traders identify potential reversals or continuations. By understanding how to effectively use indicators like the RSI and Stochastic Oscillator, traders can enhance their ability to navigate the complexities of financial markets. So, the next time you analyze price movements, remember to check the momentum—it's the heartbeat of your trading strategy!
- What are momentum indicators? Momentum indicators are tools that measure the speed of price changes in a market, helping traders identify potential reversals or continuations in trends.
- How do I use RSI in trading? The RSI can be used to identify overbought or oversold conditions. An RSI above 70 indicates overbought, while below 30 indicates oversold.
- What is the Stochastic Oscillator? The Stochastic Oscillator compares a security's closing price to its price range over a specific period, helping to identify potential trend reversals.
- Can I use momentum indicators with other indicators? Yes! Combining momentum indicators with trend indicators can provide deeper insights into market conditions and improve trading decisions.

Volatility Indicators
When it comes to trading, understanding volatility is crucial. Volatility indicators provide traders with insights into the degree of price fluctuations over time, enabling them to make informed decisions based on market conditions. Imagine trying to navigate a stormy sea without knowing how rough the waters will get; that's what trading without volatility indicators feels like. By measuring price swings, these indicators help traders gauge the risk associated with their trades and tailor their strategies accordingly.
Two of the most popular volatility indicators are Bollinger Bands and the Average True Range (ATR). Each serves a unique purpose and can be incredibly effective when used correctly. Let’s dive deeper into these tools and see how they can enhance your trading strategy.
Bollinger Bands consist of a moving average and two standard deviation lines that fluctuate based on market conditions. This setup allows traders to visualize price volatility in a dynamic way. When the bands expand, it indicates increased volatility, while contraction suggests a period of lower volatility. Think of it as a rubber band: when stretched, it signals that something significant is likely to happen, whether it's a breakout or a reversal.
Traders often look for price action near the bands to make decisions. For instance, if the price touches the upper band, it may suggest that the asset is overbought, while touching the lower band could indicate that it is oversold. However, it’s essential to remember that these signals should not be taken in isolation. Always consider other indicators and market context to confirm your analysis.
The Average True Range (ATR) is another vital tool for measuring market volatility. It calculates the average range between high and low prices over a specified period, providing a clearer picture of how much an asset typically moves. A higher ATR value indicates greater volatility, which can be both a blessing and a curse for traders. It’s like driving on a winding road; the sharper the turns, the more cautious you need to be.
Using ATR effectively involves understanding its implications for risk management and position sizing. For example, if the ATR is high, you may want to reduce your position size to manage risk better. Conversely, in a low-volatility environment, you might feel more confident to increase your exposure. Thus, ATR not only helps you gauge market conditions but also guides your trading decisions in real-time.
While Bollinger Bands and ATR are powerful on their own, combining them can yield even better insights. For instance, if you notice that the price is nearing the upper Bollinger Band while the ATR is rising, it could indicate a potential breakout. On the other hand, if the price is at the lower band with a declining ATR, it might suggest that the market is stabilizing, and a reversal could be on the horizon.
In summary, volatility indicators like Bollinger Bands and ATR serve as essential tools in a trader's arsenal. By understanding how to interpret these indicators, you can enhance your market analysis, manage risk more effectively, and ultimately improve your trading performance. Remember, the key is to use these indicators in conjunction with other analysis methods for the best results.
- What are volatility indicators?
Volatility indicators are tools that measure the degree of price fluctuations in a market, helping traders assess risk and make informed decisions. - How do I use Bollinger Bands?
Bollinger Bands can be used to identify overbought or oversold conditions by observing price movements relative to the bands. - What does a high ATR indicate?
A high ATR value indicates greater market volatility, suggesting that price movements may be larger and more unpredictable. - Can I rely solely on volatility indicators for trading decisions?
While volatility indicators provide valuable insights, they should be used in conjunction with other indicators and market analysis for more accurate trading decisions.

Bollinger Bands
Bollinger Bands are a powerful tool in the world of technical analysis, designed to provide traders with insights into market volatility and potential price movements. Developed by John Bollinger in the 1980s, these bands consist of three lines: a simple moving average (SMA) in the middle, flanked by two standard deviation lines above and below. This setup creates a channel that adapts to price fluctuations, offering traders a visual representation of volatility. But how do these bands work, and what can they tell us about market conditions?
The central line, the SMA, acts as a trend indicator, while the upper and lower bands represent the standard deviations from this average. When the price approaches the upper band, it suggests that the asset might be overbought, while touching the lower band indicates a potential oversold condition. This is where the magic happens: traders often look for potential reversal points when prices hit these bands, making it a strategic tool for entering or exiting trades.
One of the key features of Bollinger Bands is their ability to expand and contract based on market conditions. During periods of low volatility, the bands tighten, indicating that the market may be preparing for a significant price movement. Conversely, when volatility is high, the bands widen, signaling a more chaotic market environment. This dynamic nature allows traders to adjust their strategies based on current market conditions, enhancing their decision-making process.
While Bollinger Bands are incredibly useful, they are most effective when used in conjunction with other indicators. For instance, combining them with momentum indicators like the Relative Strength Index (RSI) can provide a more comprehensive view of market conditions. By analyzing price movements in relation to the bands and additional indicators, traders can better determine the likelihood of a price reversal or continuation.
To illustrate how Bollinger Bands work in practice, consider the following table that summarizes key aspects:
| Element | Description |
|---|---|
| Middle Band | Simple Moving Average (SMA) representing the average price over a specified period. |
| Upper Band | SMA + (Standard Deviation x 2), indicating potential resistance levels. |
| Lower Band | SMA - (Standard Deviation x 2), indicating potential support levels. |
In conclusion, Bollinger Bands are an essential tool for traders looking to analyze price movements and volatility. Their unique structure not only helps identify potential entry and exit points but also provides a visual representation of market conditions. By understanding how to interpret these bands and combining them with other indicators, traders can enhance their market strategies and make more informed decisions.
- What do Bollinger Bands indicate? Bollinger Bands indicate volatility and potential price reversals based on the distance between the bands and the price movements.
- How do I use Bollinger Bands effectively? Use Bollinger Bands in conjunction with other indicators, such as RSI or MACD, to confirm signals and improve your trading strategy.
- Can Bollinger Bands predict future price movements? While Bollinger Bands help identify potential reversals, they do not guarantee future price movements. Always consider other factors and indicators.

Average True Range (ATR)
The is a powerful tool in the arsenal of traders, designed to measure market volatility. Unlike other indicators that focus solely on price direction, ATR provides a comprehensive view of how much an asset's price fluctuates over a specific period. This makes it invaluable for traders looking to manage risk and make informed decisions. But how does it work? Essentially, ATR calculates the average of the true ranges over a set number of periods, typically 14 days. The true range itself is defined as the greatest of the following three values:
- The difference between the current high and the current low
- The difference between the previous close and the current high
- The difference between the previous close and the current low
This multi-faceted approach allows ATR to capture not only the current price action but also the extremes of price movement, giving traders a clearer picture of market dynamics. For instance, if the ATR value is rising, it indicates increasing volatility, which could signal that a breakout or reversal is imminent. Conversely, a declining ATR suggests that the market is consolidating, and traders may want to adopt a more cautious approach.
One of the most appealing aspects of ATR is its versatility. It can be applied across various time frames, from intraday trading to long-term investing, making it a favorite among different types of traders. Additionally, ATR is often used in conjunction with other indicators to enhance trading strategies. For example, a trader might decide to enter a position when the ATR is above a certain threshold, indicating that the market is ripe for potential profit-taking opportunities.
To illustrate how ATR can be utilized in trading, consider the following table that compares ATR values with potential trading actions:
| ATR Value | Market Condition | Suggested Action |
|---|---|---|
| Low (0-1) | Low Volatility | Consider waiting for clearer signals |
| Medium (1-2) | Moderate Volatility | Look for potential entry points |
| High (2+) | High Volatility | Prepare for breakout or reversal |
In summary, the Average True Range is not just another technical indicator; it’s a vital component of a trader's toolkit. By understanding how to interpret ATR values, traders can better navigate the complexities of the market and make strategic decisions that align with their risk tolerance and trading style.
1. What is the Average True Range (ATR)?
ATR is a volatility indicator that measures the average price range of an asset over a specified period, helping traders gauge market fluctuations.
2. How do I calculate ATR?
ATR is calculated by averaging the true ranges over a set number of periods, typically using a 14-day period for most analyses.
3. Can ATR be used for all types of trading?
Yes, ATR can be applied across various trading styles, including day trading, swing trading, and long-term investing.
4. What does a high ATR indicate?
A high ATR value suggests increased volatility, which can signal potential trading opportunities such as breakouts or reversals.
5. Should I use ATR alone for trading decisions?
While ATR is a valuable tool, it’s best used in combination with other indicators and analysis methods to enhance trading strategies.

Volume Indicators
When it comes to trading, understanding the volume of trades is just as crucial as analyzing price movements. Volume indicators provide traders with insight into the strength or weakness of a price trend by examining the number of shares or contracts traded in a specific period. Essentially, they help answer the burning question: "Is this trend backed by strong interest?" If a price movement occurs alongside high volume, it typically signals a stronger trend, while low volume may suggest a lack of conviction. This interplay between price and volume can be the key to making more informed trading decisions.
Two of the most popular volume indicators are the On-Balance Volume (OBV) and Chaikin Money Flow (CMF). Each of these indicators serves a unique purpose and can provide significant insights into market dynamics. Let's take a closer look at each:
| Indicator | Description | Application |
|---|---|---|
| On-Balance Volume (OBV) | OBV uses volume flow to predict changes in stock price. It adds volume on up days and subtracts volume on down days. | Traders look for divergences between OBV and price movements to identify potential reversals. |
| Chaikin Money Flow (CMF) | CMF combines price and volume to measure the buying and selling pressure over a specified period. | Values above zero indicate buying pressure, while values below zero suggest selling pressure. |
Both OBV and CMF can be incredibly useful when analyzing market trends. For instance, if you notice that the price of a stock is increasing but the OBV is declining, it could be a red flag that the upward movement lacks support from buyers. Conversely, if both the price and OBV are rising, it suggests a robust buying interest, reinforcing the bullish trend.
Another essential aspect of volume indicators is their ability to help traders identify potential reversals. Imagine you're watching a stock that's been on a downward spiral. Suddenly, you see a spike in volume as the price begins to rise. This could indicate that buyers are stepping in, possibly signaling a reversal. It's like watching a movie where the plot twist is revealed in the final act—only in trading, you want to catch that twist before it happens!
In conclusion, volume indicators are invaluable tools in a trader's arsenal. By analyzing the relationship between price and volume, traders can gain significant insights into market strength, potential reversals, and overall trends. Remember, in the world of trading, it's not just about what the price is doing; it's about understanding the story behind those movements. So, the next time you analyze a chart, don't forget to check the volume—it's the unsung hero of technical analysis!
- What are volume indicators? Volume indicators are tools that analyze the number of trades in a specific period to assess the strength of price movements.
- Why are volume indicators important? They help traders confirm trends, identify potential reversals, and understand the market's conviction behind price movements.
- How do I use On-Balance Volume (OBV)? Look for divergences between OBV and price movements to signal potential reversals or confirmations of trends.
- What does a high Chaikin Money Flow (CMF) indicate? A high CMF value suggests strong buying pressure, while a low value indicates selling pressure.
Frequently Asked Questions
- What are technical indicators?
Technical indicators are mathematical calculations based on price and volume data. They assist traders in identifying trends, reversals, and potential entry or exit points in the market. Think of them as tools that help you read the market's pulse!
- How do trend indicators work?
Trend indicators, like moving averages and the Average Directional Index (ADX), help traders determine the market's direction. They indicate whether the market is trending upward or downward, allowing traders to align their strategies with the prevailing trend.
- What is the difference between simple and exponential moving averages?
Simple moving averages (SMA) calculate the average price over a specific period, giving equal weight to all prices. In contrast, exponential moving averages (EMA) give more weight to recent prices, making them more responsive to recent market changes.
- What do momentum indicators tell us?
Momentum indicators, such as the Relative Strength Index (RSI) and the Stochastic Oscillator, measure the speed of price changes. They help traders identify potential reversals by signaling overbought or oversold conditions in the market.
- How do Bollinger Bands indicate market volatility?
Bollinger Bands consist of a moving average and two standard deviation lines. They expand and contract based on market conditions, helping traders identify potential breakout or reversal opportunities. When the bands are tight, it indicates low volatility; when they widen, it suggests increased volatility.
- What is the Average True Range (ATR)?
The Average True Range (ATR) measures market volatility by calculating the average range between high and low prices over a set period. A higher ATR indicates greater volatility, which can guide traders in their risk management and position sizing strategies.
- Why are volume indicators important?
Volume indicators analyze trading volume alongside price movements, providing insights into market strength. Indicators like On-Balance Volume (OBV) and the Chaikin Money Flow (CMF) help traders confirm trends and spot potential reversals, making them crucial for effective trading decisions.
- Can I use multiple indicators at once?
Absolutely! Many traders use a combination of indicators to get a more comprehensive view of the market. Just remember to avoid overcomplicating your analysis; too many indicators can lead to confusion rather than clarity.