The Basics of Crypto Margin Trading and Technical Analysis
Welcome to the fascinating world of crypto margin trading and technical analysis! If you've ever wondered how some traders seem to make profits while others struggle, you're in the right place. Margin trading is like a high-stakes game of poker, where players can leverage their bets to amplify their winnings—or losses. But before you dive into this thrilling arena, it’s crucial to understand the underlying principles and tools that can help you navigate the turbulent waters of cryptocurrency trading.
In this article, we will explore the fundamental concepts of margin trading and technical analysis, providing insights into their mechanisms, benefits, risks, and strategies for successful trading in the cryptocurrency market. Think of this guide as your roadmap; it will illuminate the path ahead, helping you avoid pitfalls and seize opportunities in the ever-evolving landscape of digital currencies. So, buckle up as we embark on this enlightening journey!
Margin trading allows traders to borrow funds to increase their position size, amplifying potential profits and losses. Imagine you're at a carnival, and you want to ride the biggest roller coaster. Instead of paying for a single ticket, you decide to pool your money with friends to buy multiple tickets. This is similar to margin trading—by borrowing funds, you can control a larger position than your initial investment. However, just like that roller coaster, margin trading can be thrilling but also comes with its fair share of risks.
The mechanics behind margin trading involve using a broker or trading platform that offers leverage. This means you can open a position worth more than your account balance. For instance, if you have $1,000 and use 10x leverage, you can control a position worth $10,000. While this can lead to significant profits, it can also magnify your losses, making it essential to have a solid understanding of the risks involved.
Familiarity with specific terms is crucial for effective margin trading. Here are some essential terms you should know:
- Leverage: The ability to control a larger position with a smaller amount of capital.
- Margin Call: A notification from your broker that you need to deposit more funds to maintain your position.
- Liquidation: The process of closing your position when your account balance falls below the required margin level.
Leverage is a key concept in margin trading that enables traders to control larger positions with smaller amounts of capital. Think of it as using a lever to lift a heavy object; with the right leverage, you can move mountains—or in this case, make substantial trades. However, it’s important to understand that while leverage can amplify your gains, it can also escalate your losses. For instance, if you invest $1,000 with 10x leverage and the market moves against you by just 10%, you could lose your entire investment!
Different trading platforms offer various types of leverage. Here’s a quick overview:
| Type of Leverage | Description | Advantages | Disadvantages |
|---|---|---|---|
| Fixed Leverage | Constant leverage ratio across all trades. | Predictable risk management. | Less flexibility in volatile markets. |
| Variable Leverage | Leverage ratio can change based on market conditions. | Potentially higher returns in favorable conditions. | Increased risk if market turns. |
| Cross-Margin | Uses all available funds in your account to maintain positions. | Can prevent liquidation for small losses. | Higher risk of losing entire account balance. |
Understanding how to calculate leverage is essential for managing risk. The formula is simple: Leverage Total Position Size / Equity. For example, if you have $1,000 in your account and you take a position worth $5,000, your leverage is 5x. This calculation helps you gauge the level of risk you’re taking on with each trade.
Margin calls and liquidation are critical aspects of margin trading. A margin call occurs when your account equity falls below the required margin level, prompting your broker to ask for additional funds. If you fail to meet this request, your position may be liquidated, meaning your assets will be sold off to cover your losses. To mitigate risks associated with these events, it’s wise to set stop-loss orders and closely monitor your positions.
Technical analysis involves analyzing price charts and market data to predict future price movements. It’s akin to reading the weather forecast before planning a picnic; you want to know what’s coming so you can prepare accordingly. In the world of crypto trading, technical analysis helps traders make informed decisions based on historical data and market trends.
Chart patterns are vital indicators of market trends. Familiarizing yourself with popular chart patterns like head and shoulders, triangles, and flags can significantly enhance your trading strategy. Each pattern tells a story about market sentiment and potential future movements. For instance, a head and shoulders pattern often signals a reversal, indicating it might be time to exit a position or prepare for a new entry.
Technical indicators provide valuable insights into market conditions. Commonly used indicators like moving averages, Relative Strength Index (RSI), and Moving Average Convergence Divergence (MACD) can help traders identify trends and potential reversal points. By incorporating these indicators into your trading strategy, you can make more informed decisions and improve your chances of success.
1. What is margin trading?
Margin trading allows you to borrow funds to increase your trading position, amplifying both potential profits and losses.
2. What is leverage?
Leverage is the ratio of your total position size to your equity, allowing you to control larger amounts of capital with a smaller investment.
3. What happens during a margin call?
A margin call occurs when your account equity falls below the required level, prompting your broker to request additional funds to maintain your position.
4. How can I mitigate risks in margin trading?
You can mitigate risks by setting stop-loss orders, using lower leverage, and continuously monitoring your positions.
In conclusion, understanding the basics of crypto margin trading and technical analysis can significantly enhance your trading experience. By arming yourself with knowledge and strategies, you can navigate the complexities of the cryptocurrency market with confidence and skill.
Understanding Margin Trading
Margin trading is like borrowing a friend’s skateboard to perform tricks that you wouldn’t normally be able to do with just your own. In the world of cryptocurrency, margin trading allows traders to borrow funds to increase their position size, which can lead to amplified profits but also amplified losses. It’s a double-edged sword that can either elevate your trading game or bring you crashing down if not handled carefully.
At its core, margin trading involves using borrowed funds from a broker or exchange to trade larger amounts than you could with your own capital alone. Imagine you have $1,000 in your trading account, but with a leverage of 2:1, you can control $2,000 worth of a cryptocurrency. This means that your potential profits are doubled, but so are your potential losses. Therefore, understanding the mechanics behind margin trading is crucial before diving into this high-stakes arena.
One of the fascinating aspects of margin trading is the concept of margin accounts. When you open a margin account, you agree to the terms set by the exchange, which usually include interest rates on borrowed funds and specific requirements for maintaining your position. The funds you borrow are used to buy more assets, but you must also maintain a certain level of equity in your account, known as the maintenance margin. If your account equity falls below this level, you may face a margin call, requiring you to deposit more funds or risk liquidation of your assets.
To illustrate this further, let’s break down how margin trading works with a simple example:
| Initial Investment | Leverage Ratio | Controlled Position | Potential Profit (10% Increase) | Potential Loss (10% Decrease) |
|---|---|---|---|---|
| $1,000 | 2:1 | $2,000 | $200 | $200 |
In this example, with a $1,000 investment and a leverage of 2:1, you control a $2,000 position. If the asset price increases by 10%, your profit would be $200, giving you a total of $1,200. Conversely, if the price drops by 10%, you would incur a loss of $200, leaving you with just $800. This stark contrast emphasizes the risks involved in margin trading.
Additionally, margin trading is not just about the potential for higher returns; it also requires a strong understanding of market movements and the ability to react quickly to changes. Traders often rely on various strategies and tools to make informed decisions, which brings us to the importance of technical analysis in margin trading. By analyzing price charts and market data, traders can identify trends, support and resistance levels, and potential reversal points, which are crucial for making profitable trades.
In conclusion, margin trading can be a powerful tool for traders looking to maximize their profits in the cryptocurrency market. However, it is essential to approach it with caution and a comprehensive understanding of the risks involved. As the saying goes, “With great power comes great responsibility.” So, before you leap into the exhilarating world of margin trading, make sure you are well-prepared and informed.

Key Terminology in Margin Trading
When diving into the world of crypto margin trading, it's essential to familiarize yourself with some key terminology that can significantly impact your trading experience. Understanding these terms will not only enhance your knowledge but also empower you to make informed decisions. Let's break down some of the most critical concepts you'll encounter.
First up is leverage. This term refers to the ability to control a larger position in the market with a smaller amount of capital. Imagine you have a small boat (your capital) and you want to sail a massive ship (your trading position). Leverage allows you to use that small boat to command the ship, but beware: if the waters get rough, both the boat and the ship could be at risk!
Another important term is margin call. This occurs when the equity in your margin account falls below the required maintenance margin. Think of it as a warning bell ringing in your trading journey. If you receive a margin call, you’ll need to deposit more funds or close some positions to avoid liquidation. It's like being told to either add more fuel to your car or risk running out of gas on a long drive.
Speaking of which, liquidation is a term that every trader should know. This happens when your account balance drops below the necessary margin requirement, prompting the broker to close your positions to prevent further losses. It's akin to a safety net that kicks in when you're about to fall off a tightrope—nobody wants to hit the ground hard!
To further illustrate these concepts, let's look at the following table that summarizes the key terms and their meanings:
| Term | Definition |
|---|---|
| Leverage | The use of borrowed funds to increase the potential return on investment. |
| Margin Call | A notification from the broker to add funds or close positions due to insufficient equity. |
| Liquidation | The process of closing positions automatically to prevent further losses. |
Additionally, it's worth noting that margin trading can be a double-edged sword. While it offers the potential for amplified profits, it also comes with increased risks. Therefore, understanding these terms is crucial for navigating the often-turbulent waters of cryptocurrency trading.
In summary, being well-versed in key terminologies like leverage, margin calls, and liquidation can set the foundation for a successful trading journey. Always remember that knowledge is power, especially when it comes to trading in volatile markets!
- What is the main benefit of margin trading? Margin trading allows traders to amplify their potential profits by controlling larger positions with less capital.
- What happens if I can't meet a margin call? If you fail to meet a margin call, your broker may liquidate your positions to cover the losses.
- Can I lose more than my initial investment? Yes, with margin trading, it's possible to lose more than your initial investment due to the risks involved.

Leverage Explained
When diving into the world of crypto margin trading, one of the most crucial concepts to grasp is leverage. Simply put, leverage allows traders to control a larger position in the market than they could with their own capital alone. Imagine you want to buy a car worth $20,000, but you only have $2,000. If a bank offers you a loan to cover the rest, that’s similar to how leverage works in trading. By using borrowed funds, you can amplify your potential gains, but be warned: it also magnifies your losses!
Let’s break it down a bit more. In the realm of crypto trading, leverage is typically expressed as a ratio. For example, if you use 10x leverage, you can control a position worth $10,000 with just $1,000 of your own money. This means that a mere 10% increase in the asset's price can yield a 100% return on your initial investment. Sounds enticing, right? However, it’s essential to understand that the opposite is also true; a 10% decrease could wipe out your entire investment. This duality of leverage is what makes it both exciting and perilous.
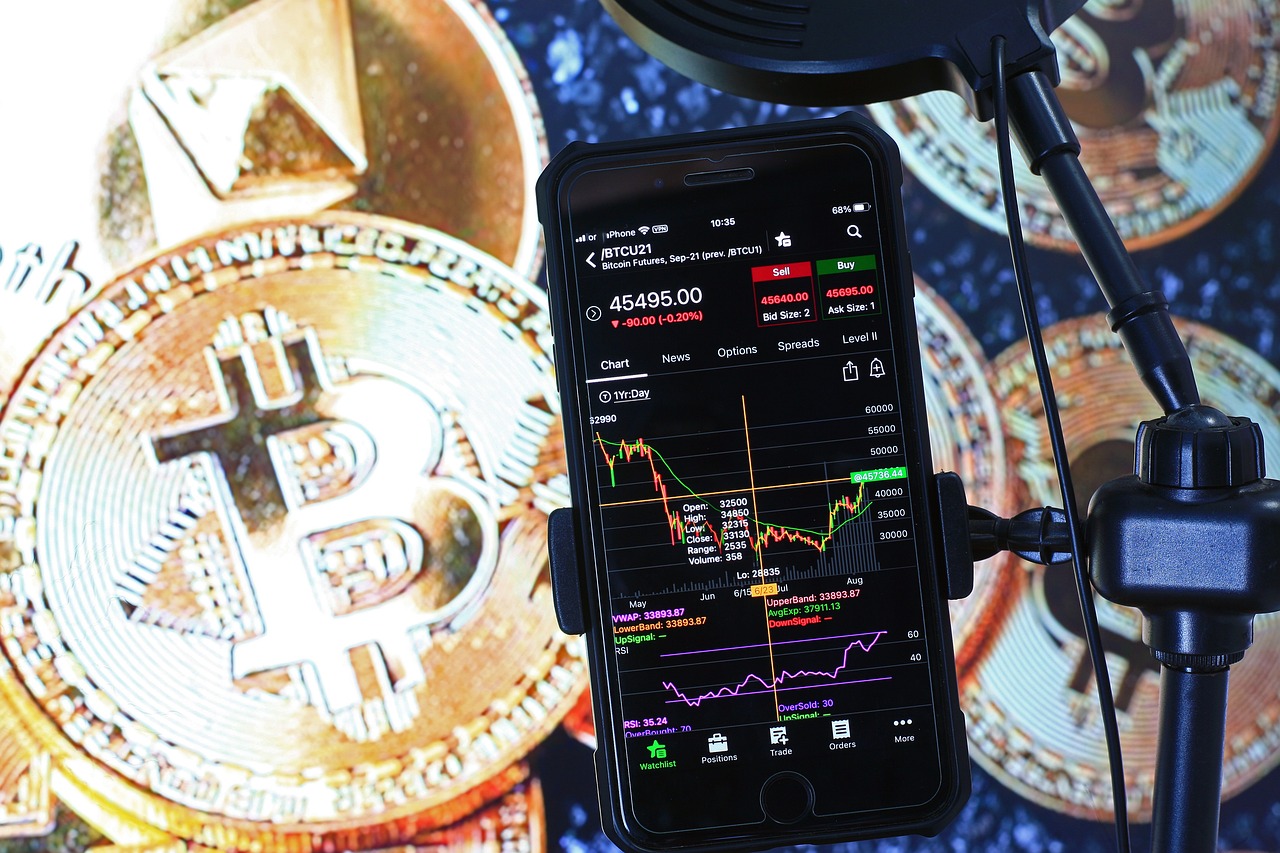
To put it into perspective, let’s consider a practical example. Suppose you decide to trade Bitcoin (BTC) at a price of $50,000. If you invest $1,000 with 10x leverage, you are effectively controlling a position of $10,000. If BTC rises to $55,000, your profit would be calculated as follows:
| Initial Investment | Position Size | Price Increase | Profit |
|---|---|---|---|
| $1,000 | $10,000 | $5,000 | $1,000 (100% Return) |
On the flip side, if Bitcoin’s price drops to $45,000, your loss would similarly be significant, potentially leading to a margin call or liquidation. This brings us to an essential point: while leverage can enhance your profits, it can also lead to devastating losses if not managed properly.
In summary, leverage is a double-edged sword in crypto margin trading. It enables traders to amplify their positions and potential profits but also increases the risk of substantial losses. Understanding how leverage works, including its implications on risk and reward, is vital for anyone looking to navigate the volatile waters of cryptocurrency trading. Always remember: with great power comes great responsibility! So, before jumping in, ensure you have a solid grasp of how to manage your risk effectively.
- What is the maximum leverage I can use in crypto trading? The maximum leverage varies by platform, but it can range from 2x to as high as 100x in some cases. Always check the specific terms of the exchange you are using.
- How can I manage risk when using leverage? You can manage risk by setting stop-loss orders, diversifying your investments, and only using a small percentage of your capital for leveraged trades.
- What happens during a margin call? A margin call occurs when your account equity falls below a certain threshold, prompting the broker to require you to deposit more funds or close some positions to reduce your leverage.

Types of Leverage
When diving into the world of margin trading, understanding the available is crucial. Leverage essentially allows traders to control larger positions than their actual investment would typically permit. However, not all leverage is created equal, and different trading platforms offer various types that can significantly impact your trading experience and outcomes.
There are three primary types of leverage that traders encounter: fixed leverage, variable leverage, and cross-margin leverage. Each type has its own unique characteristics and implications for risk management. Let's break them down:
- Fixed Leverage: This type of leverage remains constant regardless of market conditions. For instance, if a trader uses a fixed leverage of 10:1, they can control a position worth $1,000 with just $100. Fixed leverage is straightforward and easy to understand, making it a popular choice for beginners.
- Variable Leverage: Unlike fixed leverage, variable leverage can change based on market conditions or the trader's account balance. This means that as a trader's account equity fluctuates, their leverage ratio might also adjust. While this can offer more flexibility, it also introduces additional risk, as a sudden market downturn could lead to significant losses.
- Cross-Margin Leverage: This type allows traders to use the total equity across their account to support their positions. Essentially, it means that if one position is losing, the equity from other profitable positions can be used to maintain the losing position. This can be beneficial, but it also means that a loss in one area could impact the entire account, leading to potential liquidation.
To help visualize these types of leverage, consider the following table:
| Type of Leverage | Definition | Advantages | Disadvantages |
|---|---|---|---|
| Fixed Leverage | Constant leverage ratio throughout trading | Simple to manage; predictable | Limited flexibility in volatile markets |
| Variable Leverage | Leverage ratio changes based on account equity | Adapts to market conditions | Can lead to unexpected margin calls |
| Cross-Margin Leverage | Uses total account equity for margin | Can sustain losing positions with gains elsewhere | Risk of total account liquidation |
In conclusion, choosing the right type of leverage is essential for successful margin trading. Each type comes with its own set of advantages and risks, and understanding these can help traders make informed decisions that align with their risk tolerance and trading strategies. Always remember, while leverage can amplify profits, it can also magnify losses, so tread carefully!

Calculating Leverage
Understanding how to calculate leverage is crucial for any trader looking to navigate the often tumultuous waters of margin trading. Leverage allows you to control a larger position than your initial investment would typically permit. But how do you figure out just how much leverage you're using? It’s simpler than you might think!
Let’s break it down with a straightforward formula:
Leverage Total Position Size / Equity
In this formula, Total Position Size refers to the total value of the assets you are trading, while Equity is the amount of your own capital that you are putting at risk. For example, if you wish to control a position worth $10,000 and you have $1,000 of your own money, your leverage would be:
Leverage $10,000 / $1,000 10x
This means you are using 10 times leverage on your position. While this can amplify your profits, it also magnifies your risks. If the market moves against your position, your losses will also be multiplied. Therefore, it’s vital to approach leverage with caution.
To illustrate this further, let’s consider a practical example:
| Initial Investment | Total Position Size | Leverage Used | Potential Profit (10% increase) | Potential Loss (10% decrease) |
|---|---|---|---|---|
| $1,000 | $10,000 | 10x | $1,000 | $1,000 |
| $500 | $5,000 | 10x | $500 | $500 |
| $2,000 | $20,000 | 10x | $2,000 | $2,000 |
In the table above, you can see how a trader with a $1,000 investment can control a $10,000 position using 10x leverage. If the market moves in their favor by 10%, they stand to gain $1,000. However, if it moves against them by the same percentage, they also risk losing $1,000. This duality of leverage makes it a double-edged sword.
Moreover, it’s essential to keep in mind that different exchanges may have varying maximum leverage limits. Some platforms might offer up to 100x leverage, while others stick to lower ratios. Always check your trading platform’s guidelines to understand the leverage options available to you.
In conclusion, calculating leverage is a fundamental skill for any margin trader. By understanding how to assess your leverage ratio, you can make more informed decisions and better manage your risk. Remember, while the potential for higher profits is enticing, the risks associated with higher leverage are equally significant. Always trade responsibly!
- What is the maximum leverage I can use? – This varies by trading platform. Always check their specific rules.
- How does leverage affect my margin call? – Higher leverage increases the risk of a margin call if the market moves against you.
- Can I calculate leverage for different types of trades? – Yes, the same formula applies regardless of the asset class.

Margin Calls and Liquidation
Margin trading can be an exhilarating ride, but it's not without its risks. One of the most critical concepts you need to grasp is the idea of margin calls and liquidation. So, what exactly are these terms, and why should you care? Well, think of margin calls as a warning signal, much like the check engine light in your car. It’s a sign that something needs your immediate attention, or else you could be in for a bumpy ride.
A margin call occurs when the equity in your trading account falls below a certain threshold, which is typically set by your broker. This threshold is known as the maintenance margin. When your account balance dips below this level, your broker will notify you, requiring you to either deposit more funds or close some positions to reduce your risk. Ignoring this call is like ignoring that check engine light; it can lead to serious consequences.
Now, what happens if you ignore the margin call? This is where liquidation comes into play. Liquidation is the process where your broker sells off your assets to cover the losses incurred due to your declining equity. Imagine you've invested in a beautiful piece of art, but when it comes time to pay the bills, you have to sell it at a loss. That’s essentially what liquidation feels like in the trading world. It’s not just about losing your investment; it’s about the emotional toll it can take on you as a trader.
To put it simply, here are some key points to remember about margin calls and liquidation:
- Margin Call: A warning to add funds or reduce positions.
- Liquidation: Automatic selling of your assets to cover losses.
- Risk Management: Always maintain an emergency fund to avoid these situations.
Understanding these concepts is crucial for any trader. It’s not just about maximizing profits; it’s about protecting your capital. You should always have a plan in place to manage your risks effectively. This might include setting stop-loss orders or diversifying your investments to reduce exposure. Remember, in the world of crypto margin trading, it’s not just about how much you can make, but also how much you can afford to lose.
In conclusion, margin calls and liquidation are integral parts of margin trading that every trader must understand. By staying informed and proactive, you can navigate these waters more safely and keep your trading journey as smooth as possible. So, the next time you hear that dreaded margin call, don’t panic—take it as an opportunity to reassess your strategy and make informed decisions moving forward.
- What is a margin call? A margin call is a notification from your broker that your account equity has fallen below the required maintenance margin.
- What happens during liquidation? Liquidation is the process where your broker sells your assets to cover losses when your account equity is insufficient.
- How can I avoid margin calls? To avoid margin calls, maintain sufficient funds in your account and consider using stop-loss orders.
- Is margin trading suitable for beginners? Margin trading can be risky, so it’s generally recommended that beginners first gain experience with regular trading before venturing into margin trading.
Introduction to Technical Analysis
Technical analysis is like the crystal ball of the trading world. Instead of gazing into a mystical orb, traders analyze price charts and market data to forecast future price movements. This approach is particularly vital in the cryptocurrency market, where volatility reigns supreme. By understanding the patterns and trends that emerge from historical data, traders can make informed decisions that could lead to significant profits.
At its core, technical analysis is built on the premise that all market information is reflected in the price. This means that by studying price movements, traders can gain insights into market sentiment and potential future actions. Imagine trying to predict the weather: you wouldn't just look at the sky; you'd analyze past weather patterns, temperatures, and wind conditions. Similarly, technical analysis requires a keen eye for detail and an understanding of various indicators that can signal price movements.
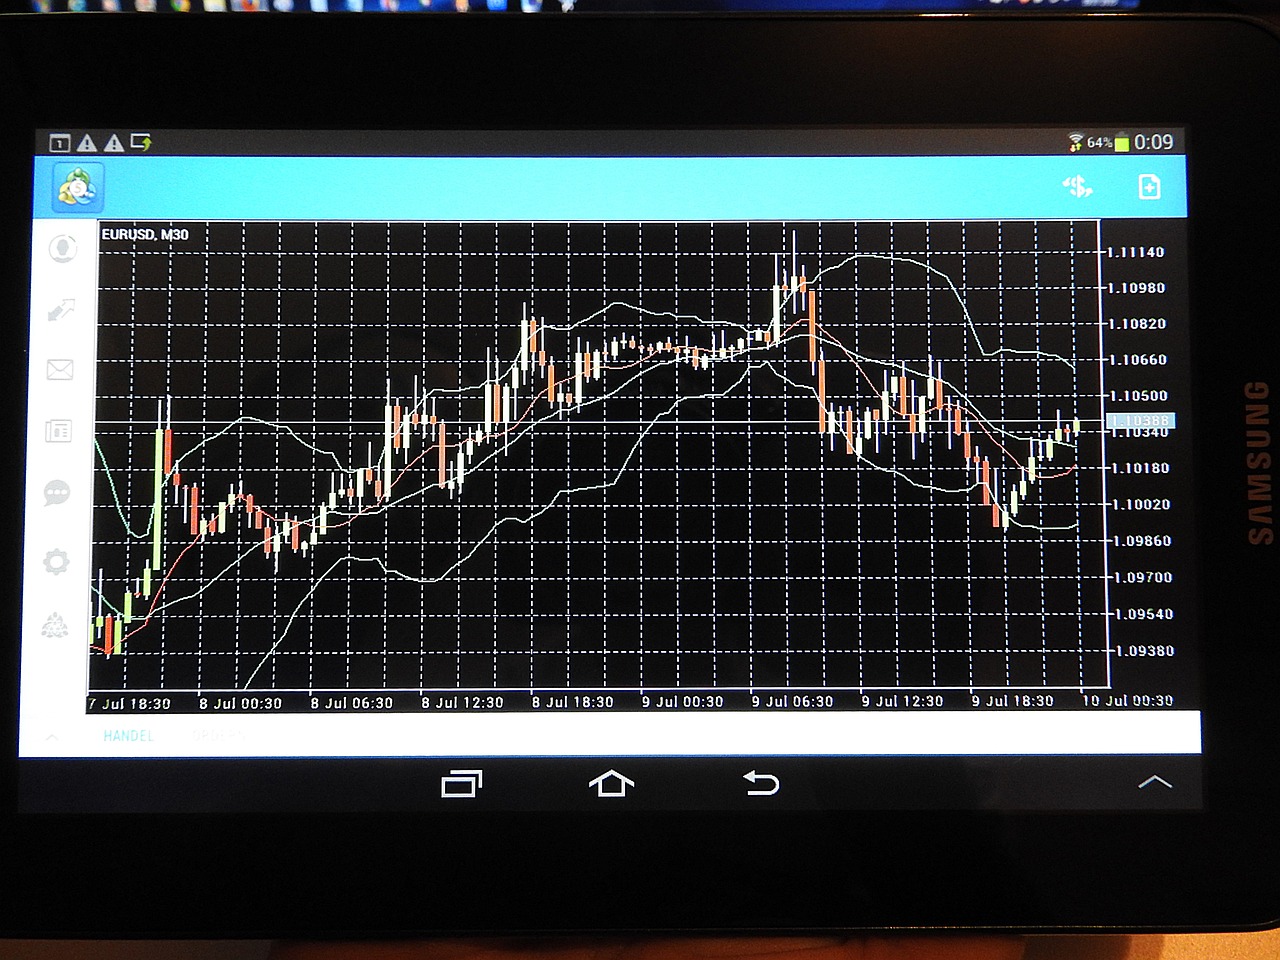
One of the fundamental tools in technical analysis is the price chart. These charts visually represent price movements over time, allowing traders to identify trends, reversals, and support and resistance levels. Traders often use different types of charts, such as line charts, bar charts, and candlestick charts, each providing unique insights. For instance, candlestick charts can reveal not just the price at the opening and closing but also the highs and lows within a specific time frame, giving a fuller picture of market dynamics.
In addition to charts, traders utilize various technical indicators to enhance their analysis. These indicators are mathematical calculations based on price and volume data, helping traders gauge market conditions and make decisions. Some popular indicators include:
- Moving Averages (MA): These smooth out price data to identify trends over a specific period, helping traders determine the direction of the market.
- Relative Strength Index (RSI): This momentum oscillator measures the speed and change of price movements, indicating overbought or oversold conditions.
- Moving Average Convergence Divergence (MACD): This indicator shows the relationship between two moving averages, helping traders spot potential buy and sell signals.
Understanding these tools is crucial for traders looking to navigate the ever-changing waters of crypto trading. By combining chart patterns and technical indicators, traders can develop a robust trading strategy that not only identifies entry and exit points but also manages risk effectively.
However, it's important to remember that technical analysis is not foolproof. It requires practice, patience, and a willingness to adapt. Market conditions can change rapidly, and what worked yesterday may not work today. Therefore, continuous learning and staying updated with market trends are essential for any trader serious about their craft.
- What is technical analysis? Technical analysis is the study of past market data, primarily price and volume, to forecast future price movements.
- How do I start with technical analysis? Begin by learning about different types of charts and indicators, and practice analyzing them using historical data.
- Can technical analysis guarantee profits? No, while it can improve decision-making, it does not guarantee profits due to market unpredictability.
Chart Patterns
Chart patterns are essential tools in the arsenal of any crypto trader, acting as visual representations of market psychology and price movements. They serve as a roadmap, helping traders navigate the often turbulent waters of the cryptocurrency market. By recognizing these patterns, traders can make informed decisions about when to enter or exit a trade. Just like a seasoned sailor reads the winds and tides, a skilled trader interprets these patterns to forecast potential price actions.
Some of the most common chart patterns include:
- Head and Shoulders: This pattern signifies a reversal trend. It consists of three peaks: a higher peak (the head) between two lower peaks (the shoulders). When the price breaks below the neckline, it often signals a bearish trend.
- Triangles: These patterns can be ascending, descending, or symmetrical. They indicate a period of consolidation before the price breaks out in either direction. Traders often look for a breakout point to make their move.
- Flags and Pennants: These short-term continuation patterns indicate a brief pause in the prevailing trend. Flags appear as rectangular shapes, while pennants resemble small symmetrical triangles. They typically precede a strong price movement in the direction of the trend.
Understanding these patterns can significantly enhance a trader's ability to predict market movements. For instance, the Head and Shoulders pattern is often viewed as a reliable indicator of a reversal, while triangles are seen as a sign of consolidation. Traders often use these patterns in conjunction with other technical indicators to confirm their predictions and make well-informed decisions.
It's important to note that while chart patterns can provide valuable insights, they are not foolproof. Market conditions can change rapidly, and external factors such as news events or regulatory changes can impact price movements unexpectedly. Therefore, it's crucial for traders to remain adaptable and consider multiple factors before making trading decisions.
To further illustrate the significance of chart patterns, let's take a look at a table summarizing some key characteristics:
| Chart Pattern | Type | Signal |
|---|---|---|
| Head and Shoulders | Reversal | Bearish |
| Ascending Triangle | Continuation | Bullish |
| Descending Triangle | Continuation | Bearish |
| Flags | Continuation | Trend Direction |
In summary, chart patterns are more than just shapes on a graph; they are reflections of trader behavior and market sentiment. By mastering these patterns, you can gain a competitive edge in the crypto trading arena. Remember, however, that successful trading is not solely about recognizing patterns but also about understanding the broader market context and managing risk effectively.
What are chart patterns in trading?
Chart patterns are formations created by the price movements of an asset on a chart. They help traders identify potential future price movements based on historical data.
How reliable are chart patterns?
While chart patterns can provide valuable insights, they are not guaranteed predictors of future price movements. It's essential to combine them with other analysis techniques and risk management strategies.
Can I use chart patterns in all markets?
Yes, chart patterns can be applied in various financial markets, including stocks, forex, and cryptocurrencies. However, the specific characteristics of each market may influence the patterns' reliability.

Technical Indicators
When it comes to navigating the tumultuous waters of crypto trading, serve as your compass, guiding you through the fog of market volatility. These indicators are mathematical calculations based on the price, volume, or open interest of a security, and they help traders make informed decisions. Think of them as the breadcrumbs left behind by price movements that can lead you to a treasure trove of trading opportunities. By analyzing these indicators, you can gain insights into market trends, identify potential entry and exit points, and ultimately enhance your trading strategies.
Among the myriad of technical indicators available, some stand out due to their widespread usage and effectiveness. For instance, Moving Averages smooth out price data to create a trend-following indicator. They can help you determine the direction of the market and identify potential reversals. Another popular indicator is the Relative Strength Index (RSI), which measures the speed and change of price movements. It ranges from 0 to 100 and is typically used to identify overbought or oversold conditions in a market. When the RSI is above 70, it indicates that a security may be overbought, while an RSI below 30 suggests it may be oversold.
Additionally, the Moving Average Convergence Divergence (MACD) is another powerful tool that traders rely on. This indicator consists of two moving averages and helps identify changes in the strength, direction, momentum, and duration of a trend in a stock's price. By observing the relationship between these moving averages, traders can spot potential buy or sell signals.
To give you a clearer picture, here’s a simple table summarizing these popular technical indicators:
| Indicator | Description | Usage |
|---|---|---|
| Moving Averages | Smooths out price data to identify trends | Trend direction, potential reversals |
| Relative Strength Index (RSI) | Measures speed and change of price movements | Identifying overbought or oversold conditions |
| Moving Average Convergence Divergence (MACD) | Shows changes in trend strength, direction, and momentum | Spotting buy/sell signals |
Using these indicators effectively requires practice and an understanding of their limitations. It’s essential to remember that no indicator is foolproof; they are merely tools that can help you make more informed decisions. Combining multiple indicators can provide a more comprehensive view of the market, but it’s vital to avoid overcomplicating your strategy. Simplicity often leads to clarity, and clarity is key in the fast-paced world of crypto trading.
In conclusion, technical indicators are invaluable for traders looking to make sense of the chaotic cryptocurrency market. By familiarizing yourself with these tools and integrating them into your trading strategy, you can enhance your decision-making process and improve your chances of success. So, as you embark on your trading journey, remember to keep your eyes on the indicators—they might just lead you to your next big opportunity!
- What are technical indicators? Technical indicators are mathematical calculations based on price and volume data used to forecast future price movements.
- How do I choose the right indicators? It depends on your trading style and strategy. Start with a few popular ones and see how they fit into your approach.
- Can I rely solely on technical indicators for trading? While they are helpful, it's best to combine them with fundamental analysis and market news for a well-rounded strategy.
Frequently Asked Questions
- What is crypto margin trading?
Crypto margin trading is a method that allows traders to borrow funds to increase their position size in the market. This means you can control larger amounts of cryptocurrency than you actually own, potentially amplifying both your profits and losses. It's like leveraging a small amount of money to make bigger bets in the trading game!
- How does leverage work in margin trading?
Leverage is the magic ingredient in margin trading. It allows you to control a larger position with a smaller amount of capital. For example, if you use 10x leverage, you can trade $10,000 worth of cryptocurrency with just $1,000 of your own money. However, remember that while leverage can boost your profits, it can also magnify your losses, so tread carefully!
- What are margin calls and how can I avoid them?
A margin call occurs when your account equity falls below a certain level, prompting your broker to ask for additional funds to maintain your position. To avoid margin calls, make sure to monitor your positions closely and set stop-loss orders to limit potential losses. Think of it as a safety net that helps you avoid falling too deep into the trading abyss!
- What are some common chart patterns used in technical analysis?
Chart patterns are like roadmaps that help traders navigate market trends. Some popular patterns include head and shoulders, triangles, and flags. Recognizing these patterns can give you insights into potential price movements, helping you make more informed trading decisions. It's like being able to read the signs on your trading journey!
- Which technical indicators should I use for crypto trading?
There are numerous technical indicators available, but some of the most commonly used ones are moving averages, the Relative Strength Index (RSI), and the Moving Average Convergence Divergence (MACD). These indicators can provide valuable insights into market conditions and help enhance your trading strategies. Think of them as your trusty tools in the trader's toolbox!
- What risks should I be aware of when trading on margin?
Trading on margin comes with significant risks, including the potential for large losses that can exceed your initial investment. Additionally, market volatility can lead to rapid price changes, triggering margin calls or liquidation of your positions. Always ensure you have a solid risk management strategy in place to protect your investment!