How to Utilize Technical Analysis for Portfolio Management
In today's fast-paced financial markets, making informed investment decisions is more crucial than ever. One of the most effective ways to achieve this is through technical analysis, a method that allows investors to evaluate securities by analyzing market activity statistics. By understanding the nuances of technical analysis, you can enhance your portfolio management strategies and optimize your asset allocation. So, how exactly can you leverage technical analysis to make smarter investment choices? Let's dive deeper into this fascinating subject.
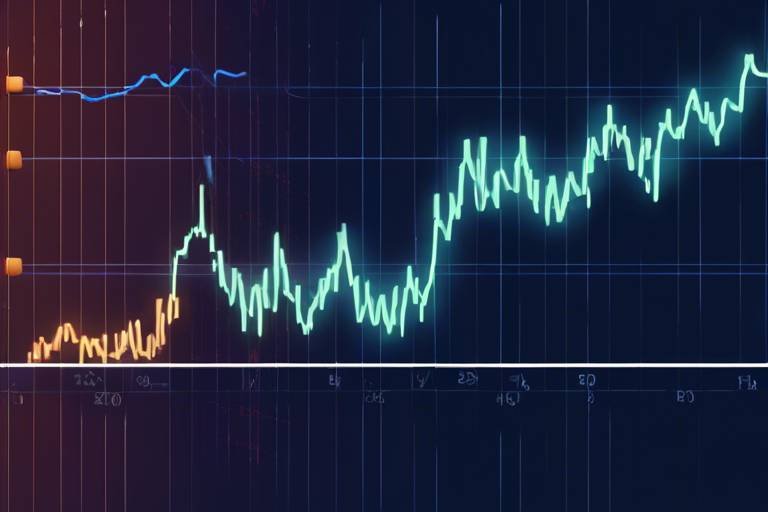
At its core, technical analysis is about deciphering the language of the market. It involves examining price movements, volume, and historical data to identify potential trends and forecast future price actions. Think of it as reading a map that guides you through the often-treacherous terrain of stock trading. By understanding price patterns and market signals, investors can gain valuable insights into when to buy or sell securities.
To effectively conduct technical analysis, investors utilize a variety of tools designed to simplify the data interpretation process. These tools include charts, indicators, and oscillators. Each of these elements plays a vital role in painting a clearer picture of market dynamics. For instance, charts allow you to visualize price movements over time, while indicators provide quantifiable metrics to assess market momentum. By mastering these tools, you can make more informed investment decisions based on historical data and emerging patterns.
Recognizing chart patterns is essential for predicting future price movements. These formations can indicate potential reversals or continuations in market trends, serving as crucial signals for portfolio managers. Here are some common chart patterns to look out for:
- Head and Shoulders: This pattern indicates a potential shift in trend direction, making it a vital signal for investors to identify.
- Support and Resistance Levels: These levels help investors pinpoint price points where stocks may reverse direction, aiding in strategic entry and exit points.
Technical indicators, such as moving averages and the Relative Strength Index (RSI), provide quantifiable data that help investors gauge market momentum and potential reversals. These indicators serve as a compass, guiding you through the market's ups and downs. By incorporating these tools into your analysis, you can better assess whether a security is overbought or oversold, enabling you to make more calculated investment decisions.
Integrating technical analysis with fundamental analysis creates a balanced approach to portfolio management. While fundamental analysis focuses on the intrinsic value of an asset, technical analysis emphasizes market trends and price movements. By combining these two methodologies, investors can capitalize on market trends while considering the underlying value of their assets. This dual approach allows you to navigate the complexities of the market more effectively.
Effective timing of market entries and exits can significantly impact portfolio performance. Technical analysis provides strategies to optimize these critical decisions. For example, using moving averages can help you identify when to enter a position, while RSI can signal when it's time to exit. By honing your timing skills through technical analysis, you can enhance your investment returns.
Implementing risk management techniques informed by technical analysis is crucial for protecting your portfolio from significant losses while maximizing potential gains. By setting stop-loss orders based on technical indicators, you can limit your exposure to adverse market movements. This proactive approach to risk management can make all the difference in maintaining a healthy portfolio.
While technical analysis is a powerful tool, it does have its limitations. One major drawback is its reliance on historical data, which may not always accurately predict future market behavior. Additionally, market anomalies can skew results, leading to potential misinterpretations. It's essential for investors to remain aware of these limitations when making decisions based on technical analysis.
Market sentiment can influence price movements in ways that technical analysis may not predict. Factors such as news events, economic indicators, and investor psychology can all play a significant role in market dynamics. This highlights the need for a comprehensive approach to portfolio management that considers both technical and fundamental factors.
Investors must be vigilant about false signals and market noise that can mislead technical analysis. Just as a sailor must navigate through foggy waters, investors need to filter out distractions to make sound decisions. Combining multiple strategies and tools can help mitigate the risks associated with misleading signals, ensuring more effective portfolio management.
Q: What is the primary goal of technical analysis?
A: The primary goal of technical analysis is to evaluate securities and forecast future price movements based on historical market data.
Q: Can technical analysis be used for all types of investments?
A: While technical analysis is commonly used for stocks, it can also be applied to other assets like commodities, currencies, and cryptocurrencies.
Q: Is technical analysis foolproof?
A: No, technical analysis is not foolproof. It has limitations and should be used in conjunction with other analysis methods, such as fundamental analysis.
Q: How can I start learning technical analysis?
A: You can start learning technical analysis by reading books, taking online courses, and practicing on trading platforms to gain hands-on experience.

Understanding Technical Analysis
Technical analysis is a fascinating approach to evaluating securities, and it revolves around the idea that market activity—the movements of prices over time—holds the key to predicting future price behaviors. Instead of getting bogged down by a company's fundamentals, like earnings reports or economic indicators, technical analysts focus on price charts and trading volumes. This method can be likened to reading a map; just as a map guides you to your destination based on geographical features, technical analysis helps investors navigate the complex world of trading by revealing patterns and trends that may not be immediately obvious.
At its core, technical analysis operates on the principle that all relevant information is already reflected in the price of a security. This means that by studying historical price movements, investors can glean insights into potential future performance. Imagine trying to predict the weather: while you could look at current conditions, historical weather patterns give you a clearer picture of what to expect. Similarly, technical analysis provides a framework for understanding how prices have behaved in the past, which can inform future investment decisions.
One of the key aspects of technical analysis is the use of charts. These visual representations of price movements allow investors to spot trends and potential reversals at a glance. For instance, a line chart shows the closing prices over a specific time frame, while candlestick charts provide more detailed information, including opening, closing, high, and low prices for each period. By analyzing these charts, investors can identify patterns that may indicate future price movements.
Furthermore, technical analysis employs various tools and indicators that enhance the decision-making process. These include:
- Moving Averages: These smooth out price data to identify trends over a specific period.
- Relative Strength Index (RSI): This momentum oscillator measures the speed and change of price movements to identify overbought or oversold conditions.
- Bollinger Bands: These help investors understand volatility by showing price levels relative to a moving average.
In summary, technical analysis is not merely about crunching numbers; it's a dynamic and engaging way to understand market behavior. By tapping into historical price data and employing various analytical tools, investors can make more informed decisions, enhancing their portfolio management strategies. However, while technical analysis provides valuable insights, it should be used in conjunction with other methods, like fundamental analysis, to create a comprehensive investment strategy.

Key Tools for Technical Analysis
When diving into the world of technical analysis, it's crucial to arm yourself with the right tools. Think of these tools as your trusty compass and map in the vast ocean of market data. They guide you through the waves of price movements, helping you make informed decisions about your investments. The primary tools that investors utilize include charts, indicators, and oscillators. Each of these tools plays a significant role in revealing patterns and trends that might not be immediately obvious. Let's explore these tools in more detail.
Charts are the backbone of technical analysis. They visually represent price movements over time, allowing investors to spot trends at a glance. The most common types of charts include line charts, bar charts, and candlestick charts. Each type has its unique way of displaying price data, but candlestick charts are particularly popular among traders because they provide more information, such as opening and closing prices, and can indicate market sentiment. Here’s a quick overview of these chart types:
| Chart Type | Description |
|---|---|
| Line Chart | Connects closing prices over a specified time period, providing a simple view of price trends. |
| Bar Chart | Displays opening, closing, high, and low prices for a specific time frame, offering a more detailed view than line charts. |
| Candlestick Chart | Similar to bar charts but uses colored "candles" to represent price movements, indicating bullish or bearish trends. |
Next up are indicators, which are mathematical calculations based on price and volume data. They serve as additional layers of analysis that can confirm trends or signal potential reversals. Some popular indicators include:
- Moving Averages: These smooth out price data to identify trends over a specific period, helping to filter out market noise.
- Relative Strength Index (RSI): This momentum oscillator measures the speed and change of price movements, indicating overbought or oversold conditions.
- Bollinger Bands: These bands expand and contract based on market volatility, providing insights into potential price breakouts.
Finally, we have oscillators. These tools are particularly useful in identifying overbought or oversold conditions in the market. Unlike indicators that may lag behind price movements, oscillators fluctuate between a fixed range, allowing traders to spot potential reversals more effectively. The most common oscillators include the Stochastic Oscillator and the MACD (Moving Average Convergence Divergence), both of which can provide valuable insights when used in conjunction with other technical analysis tools.
In summary, utilizing these key tools—charts, indicators, and oscillators—can significantly enhance your technical analysis skills. By understanding how to interpret these tools, you can make more informed investment decisions, navigate market trends with confidence, and ultimately optimize your portfolio management strategy. Remember, the goal is to combine these tools effectively, creating a comprehensive approach that considers various market signals.
- What is the best tool for beginners in technical analysis?
For beginners, starting with candlestick charts and basic indicators like moving averages can be very helpful. They provide a solid foundation for understanding price movements and trends.
- Can technical analysis predict future price movements?
While technical analysis can provide insights based on historical data and trends, it cannot guarantee future price movements. It's essential to combine it with other analysis methods.
- How often should I update my technical analysis?
Regularly updating your analysis is crucial, especially in fast-moving markets. Daily or weekly reviews can help you stay informed about significant changes.

Chart Patterns
When it comes to technical analysis, chart patterns are like the road signs of the financial market. They provide critical insights into potential future price movements based on historical trends. By recognizing these patterns, investors can predict whether a security is likely to reverse its direction or continue on its current path. Understanding chart patterns is essential for any portfolio manager aiming to make informed investment decisions.
Chart patterns can be broadly categorized into two types: continuation patterns and reversal patterns. Continuation patterns signal that a trend will likely continue, while reversal patterns indicate a potential change in trend direction. Here’s a brief overview of some common chart patterns:
| Pattern | Type | Description |
|---|---|---|
| Head and Shoulders | Reversal | Indicates a potential trend reversal from bullish to bearish. |
| Double Top | Reversal | Signals a bearish reversal after an uptrend. |
| Flags and Pennants | Continuation | Indicates a brief consolidation before the previous trend resumes. |
| Triangles | Continuation | Can signal a continuation or reversal, depending on the breakout direction. |
Among these, the head and shoulders pattern is particularly significant. This pattern forms after an uptrend and consists of three peaks: a higher peak (the head) between two lower peaks (the shoulders). When this pattern completes, it often signals a reversal, which is crucial for portfolio managers to recognize in order to protect their investments from potential downturns.
Another vital concept in chart patterns is the identification of support and resistance levels. These levels are price points where a stock tends to reverse direction. Support is the price level where buying interest is strong enough to overcome selling pressure, while resistance is where selling interest overcomes buying pressure. Recognizing these levels can help investors determine optimal entry and exit points, enhancing their overall portfolio strategy.
In summary, mastering chart patterns is essential for anyone serious about portfolio management. By understanding these visual cues, investors can make more informed decisions, anticipate market movements, and ultimately enhance their investment strategies. So, when you're analyzing charts, remember that each pattern tells a story—one that can guide you toward better investment outcomes.

Head and Shoulders
The pattern is one of the most recognized and significant reversal signals in technical analysis. Imagine standing on a mountain, where the peaks and valleys represent the fluctuating prices of a stock. The head and shoulders pattern forms when a stock rises to a peak (the head), followed by a higher peak (the right shoulder), and then falls to create a low (the neckline). This formation is crucial for portfolio managers to identify, as it often indicates a potential shift from a bullish trend to a bearish trend.
Understanding this pattern is like mastering the art of reading nature's signs. Just as a seasoned hiker can predict a storm by observing the clouds, savvy investors can anticipate market shifts by recognizing the head and shoulders formation. The left shoulder forms as the price rises, creating a peak, followed by a decline. Then, the price surges again to form the head, which is the highest point. After another decline, the price rises again but only reaches a peak lower than the head, forming the right shoulder. This sequence of movements signals that the market may be losing momentum, suggesting that a reversal could be on the horizon.
To visualize this pattern, consider the following table that outlines the key components:
| Component | Description |
|---|---|
| Left Shoulder | The initial peak followed by a decline. |
| Head | The highest peak in the pattern, followed by another decline. |
| Right Shoulder | A peak that is lower than the head, indicating weakening momentum. |
| Neckline | A support line drawn at the lowest point between the shoulders, crucial for confirming the pattern. |
Once the head and shoulders pattern is established, the next step is to draw the neckline, which connects the lows formed after the left shoulder and the head. A breakout below this neckline is the ultimate confirmation of the reversal, signaling a potential sell opportunity. For investors, identifying this pattern can be likened to spotting a red flag in the distance; it’s a warning that something significant may be about to happen. Thus, recognizing this formation not only aids in making informed decisions but also enhances the overall strategy of portfolio management.
However, while this pattern is powerful, it’s essential to consider the context in which it appears. Market conditions, volume, and other technical indicators should also be analyzed to ensure a robust decision-making process. Relying solely on the head and shoulders pattern without corroborating evidence can lead to misinterpretations. Therefore, combining this pattern with other tools and indicators can help investors navigate the complexities of the market more effectively.
- What does the head and shoulders pattern signify? It signifies a potential reversal from a bullish to a bearish trend.
- How do I confirm the head and shoulders pattern? Confirmation comes when the price breaks below the neckline after the right shoulder forms.
- Can this pattern appear in any time frame? Yes, the head and shoulders pattern can appear in various time frames, from minutes to months.

Support and Resistance Levels
When diving into the world of technical analysis, one of the most crucial concepts to grasp is that of . These levels act like invisible barriers in the market, influencing price movements and providing insight into where a stock might change direction. Think of them as the floor and ceiling of a room: the floor (support) prevents the price from falling too low, while the ceiling (resistance) stops it from rising too high. Understanding these levels can significantly enhance your investment strategies and decision-making process.
Support levels are price points where buying interest is strong enough to overcome selling pressure, leading to a potential price increase. Conversely, resistance levels are where selling interest is robust enough to counteract buying pressure, causing the price to potentially decrease. Identifying these levels can be a game-changer for portfolio managers aiming to optimize their entry and exit points. So, how can you pinpoint these levels?
There are several methods to determine support and resistance levels, including:
- Historical Price Points: Look at past price movements. If a stock has consistently bounced off a certain price level, that’s a strong indicator of support or resistance.
- Moving Averages: These can act as dynamic support and resistance levels. For example, the 50-day and 200-day moving averages are commonly watched by traders.
- Trend Lines: Drawing lines along the highs and lows of price movements can help visualize potential support and resistance levels.
To illustrate this concept further, let's consider a simple table that summarizes how support and resistance levels can impact trading decisions:
| Level Type | Market Behavior | Trading Strategy |
|---|---|---|
| Support | Price tends to bounce back up | Consider buying or adding to positions |
| Resistance | Price tends to pull back down | Consider selling or taking profits |
Utilizing support and resistance levels effectively requires a keen eye and a bit of practice. Start by analyzing charts and noting where these levels appear. Over time, you'll develop an intuition for when to enter or exit trades based on these critical price points. Remember, though, that while support and resistance levels are powerful tools, they are not foolproof. Prices can break through these levels, especially in volatile markets, so always combine this analysis with other technical indicators for a more rounded approach.
In summary, understanding support and resistance levels is an essential skill for any investor looking to enhance their portfolio management strategy. By recognizing these key price points, you can make more informed decisions, potentially increasing your chances of success in the market.
- What is the difference between support and resistance?
Support is a price level where buying interest is strong enough to prevent the price from falling further, while resistance is where selling interest is strong enough to prevent the price from rising further. - How can I identify support and resistance levels?
You can identify these levels by analyzing historical price movements, using moving averages, and drawing trend lines on charts. - Are support and resistance levels always accurate?
No, support and resistance levels are not foolproof. Prices can break through these levels, particularly in volatile market conditions.

Technical Indicators
When it comes to navigating the complex waters of financial markets, serve as vital tools that help investors make sense of price movements and market trends. Think of these indicators as your navigational compass, guiding you through the stormy seas of stock trading. They provide quantifiable data that can reveal underlying momentum, potential reversals, and overall market sentiment. Among the most popular indicators are moving averages, Relative Strength Index (RSI), and Bollinger Bands, each offering unique insights into market behavior.
Let’s dive deeper into some of these critical technical indicators:
- Moving Averages: This indicator smooths out price data by creating a constantly updated average price. It helps in identifying the direction of the trend. For instance, if the 50-day moving average crosses above the 200-day moving average, it signals a potential bullish trend, often referred to as a "golden cross."
- Relative Strength Index (RSI): The RSI is a momentum oscillator that measures the speed and change of price movements. It ranges from 0 to 100 and is typically used to identify overbought or oversold conditions. An RSI above 70 may indicate that a stock is overbought, while below 30 suggests it is oversold.
- Bollinger Bands: These bands consist of a middle band (the moving average) and two outer bands that are standard deviations away from this average. They help traders assess volatility and price levels. When the price touches the upper band, it may indicate an overbought condition, while touching the lower band may signal an oversold condition.
Using these indicators in concert can provide a more comprehensive view of market dynamics. For example, if the RSI indicates an overbought condition while the price approaches the upper Bollinger Band, it may reinforce the idea that a price correction is imminent. However, it's essential to remember that no single indicator is foolproof. Each has its strengths and weaknesses, and relying on them exclusively can lead to misguided decisions.
Moreover, the effectiveness of these indicators can vary based on market conditions. In trending markets, indicators like moving averages can provide reliable signals, while in sideways or choppy markets, they may generate false signals. Therefore, combining multiple indicators and considering broader market context can enhance the reliability of your analysis.
In summary, technical indicators are indispensable tools for investors looking to make informed decisions. By understanding how to interpret these indicators, you can better navigate the complexities of the market, improve your timing for entries and exits, and ultimately, optimize your portfolio management strategy.

Incorporating Technical Analysis into Portfolio Strategy
Integrating technical analysis into your portfolio strategy is like adding a secret ingredient to your favorite recipe—it can elevate your investment game to a whole new level. By blending the insights gained from technical analysis with fundamental analysis, you can create a well-rounded approach that not only captures market trends but also considers the intrinsic value of your assets. Imagine being able to ride the waves of market movements while still holding onto the solid foundation of a company’s financial health. That’s the beauty of combining these two methodologies!
One of the primary benefits of incorporating technical analysis is the ability to time your market entries and exits effectively. Think of it as having a roadmap for your investment journey. With the right technical indicators, you can identify optimal points to buy low and sell high. This strategic timing can significantly enhance your portfolio's performance. For example, using moving averages can help you spot trends and make informed decisions about when to enter or exit a position. But remember, timing is everything—just like a well-timed joke can make or break a stand-up routine!
Moreover, risk management techniques informed by technical analysis are vital for safeguarding your investments. It’s essential to recognize that the market can be unpredictable, and having a plan in place can protect you from significant losses. By setting stop-loss orders based on technical levels, you can minimize your risk while maximizing potential gains. This approach allows you to stay in control, even when the market throws you a curveball. After all, a well-prepared investor is like a seasoned sailor navigating through stormy seas—ready for anything!
To illustrate the effectiveness of incorporating technical analysis into your portfolio strategy, let’s take a look at a simple example:
| Indicator | Signal | Action |
|---|---|---|
| Moving Average Crossover | Short-term MA crosses above long-term MA | Buy |
| Relative Strength Index (RSI) | RSI above 70 | Sell |
| Support Level Bounce | Price bounces off a support level | Buy |
| Resistance Level Break | Price breaks above a resistance level | Buy |
This table highlights some common technical indicators and the corresponding actions you might consider taking. As you can see, understanding these signals can help you make more informed decisions, ultimately leading to a more robust portfolio strategy.
In conclusion, effectively incorporating technical analysis into your portfolio strategy is not just about crunching numbers and analyzing charts; it’s about creating a comprehensive approach that enhances your investment decisions. By timing your market entries and exits, implementing risk management techniques, and continuously refining your strategy based on market feedback, you can navigate the investment landscape with confidence. So, are you ready to take your portfolio management skills to the next level?
Q: What is technical analysis?
A: Technical analysis is the study of market data, primarily price and volume, to forecast future price movements.
Q: How can I start using technical analysis?
A: Begin by familiarizing yourself with key tools like charts and indicators. Practice analyzing historical data to identify patterns.
Q: Is technical analysis better than fundamental analysis?
A: Both have their strengths. Technical analysis focuses on price movements, while fundamental analysis looks at a company's financial health. Combining both can lead to better investment decisions.
Q: Can technical analysis predict market crashes?
A: While technical analysis can highlight potential downturns, it cannot predict market crashes with certainty. It’s essential to consider multiple factors.
Q: How often should I review my technical analysis?
A: Regularly reviewing your analysis—daily, weekly, or monthly—depending on your trading style, is crucial to stay updated on market trends.

Timing Market Entries and Exits
Timing your market entries and exits can feel like trying to catch lightning in a bottle. It's both an art and a science, and when done correctly, it can dramatically enhance your portfolio's performance. The key here is to use technical analysis as your guiding light, providing you with the signals that indicate when to jump into a position or gracefully exit. But how do you master this timing dance?
First, it's essential to understand that market timing isn't just about picking the perfect moment; it's about understanding market trends and patterns. Technical analysis tools, such as moving averages and momentum indicators, can help you spot these trends. For instance, if the 50-day moving average crosses above the 200-day moving average, it might signal a bullish trend, suggesting that it's a good time to enter the market. Conversely, if the opposite occurs, it could indicate a bearish trend, prompting you to consider exiting your position.
Moreover, employing strategies like support and resistance levels can guide your timing decisions. Support levels act as a safety net for prices, while resistance levels can signal when prices are likely to retreat. By observing these levels, you can make more informed decisions about when to buy or sell. For example, if a stock consistently bounces off a support level, it might be a good entry point. On the flip side, if it struggles to break through a resistance level, it could be time to think about selling.
Another crucial aspect of timing market entries and exits is understanding market sentiment. This involves gauging how other investors feel about a particular stock or the market as a whole. Sentiment can often drive prices in ways that technical indicators may not predict. For instance, during a market rally, even stocks that don't have solid fundamentals can soar due to positive sentiment. Conversely, during a market downturn, even strong companies might see their stock prices plummet due to fear and panic. Thus, keeping an ear to the ground about market sentiment can provide you with valuable insights into the right timing for your trades.
To illustrate this, let’s take a look at a simple table that showcases how different indicators can help in timing your trades:
| Indicator | Entry Signal | Exit Signal |
|---|---|---|
| Moving Average Crossover | Short-term MA crosses above Long-term MA | Short-term MA crosses below Long-term MA |
| RSI (Relative Strength Index) | RSI below 30 (oversold) | RSI above 70 (overbought) |
| Bollinger Bands | Price touches lower band | Price touches upper band |
In conclusion, mastering the timing of your market entries and exits is crucial for effective portfolio management. By leveraging technical analysis tools, understanding market sentiment, and recognizing key support and resistance levels, you can make more informed decisions that align with your investment goals. Remember, it’s not just about timing the market; it’s about understanding it. So, keep your eyes peeled, stay informed, and let your analysis guide you to success!
- What is the best time frame for technical analysis? The best time frame depends on your trading style. Day traders may prefer shorter time frames like 5 or 15 minutes, while swing traders might look at daily or weekly charts.
- Can technical analysis predict market crashes? While technical analysis can provide insights into potential downturns, it cannot predict market crashes with certainty. It's essential to use it in conjunction with other analyses.
- How often should I review my technical analysis? Regularly reviewing your analysis is key. Many traders check their indicators daily, while others may do so weekly or monthly, depending on their trading strategy.

Risk Management Techniques
When it comes to investing, the phrase "no risk, no reward" certainly holds some truth, but it’s crucial to remember that not all risks are worth taking. Effective risk management techniques are essential for safeguarding your portfolio against unexpected market fluctuations and ensuring long-term success. By implementing these techniques, you can protect your investments while still capitalizing on potential gains. So, how do you go about managing risk in your portfolio?
One of the most effective strategies is the use of stop-loss orders. These are predetermined price levels set by investors to automatically sell a security when it reaches a certain price, thus limiting potential losses. For instance, if you purchase a stock at $50 and set a stop-loss order at $45, your losses are capped at 10%. This technique not only helps in minimizing losses but also takes the emotional decision-making out of the equation. After all, when the market turns, it can be easy to let fear dictate your actions.
Another technique involves diversification. By spreading your investments across various asset classes—such as stocks, bonds, and real estate—you can mitigate the impact of a poor-performing asset on your overall portfolio. Imagine your portfolio as a fruit basket; if one type of fruit goes bad, the others can still thrive. This way, you reduce the risk of significant losses because not all assets will react the same way to market conditions. A diversified portfolio can cushion against volatility and provide a more stable return over time.
Additionally, consider employing the risk-reward ratio in your investment strategy. This ratio helps you assess the potential return of an investment relative to its risk. A common approach is to aim for a risk-reward ratio of at least 1:2, meaning that for every dollar you risk, you should aim to gain two dollars. This technique allows you to evaluate whether the potential reward is worth the risk involved, making your investment decisions more calculated and informed.
To further enhance your risk management strategy, you can also utilize position sizing. This technique involves determining the size of your investment based on your risk tolerance and the volatility of the asset. For example, if you are more risk-averse, you might choose to invest a smaller percentage of your total portfolio in a high-volatility stock. This way, even if the stock performs poorly, the impact on your overall portfolio will be minimized. Understanding how much to invest in each asset is crucial for maintaining a balanced risk profile.
Lastly, it’s essential to stay informed about market conditions and economic indicators that could affect your investments. Regularly reviewing your portfolio and adjusting your strategies based on current market trends can help you stay ahead of potential risks. For instance, if you notice increasing volatility in a particular sector, it might be wise to reduce your exposure there or hedge your investments to protect against downturns.
In summary, effective risk management techniques are vital for any investor looking to navigate the complexities of the market. By employing stop-loss orders, diversifying your portfolio, analyzing risk-reward ratios, managing position sizes, and staying informed about market conditions, you can create a robust framework that not only protects your investments but also positions you for success in the ever-evolving financial landscape.
- What is the purpose of risk management in investing?
Risk management aims to minimize potential losses while maximizing potential gains, ensuring long-term financial stability. - How can I determine my risk tolerance?
Your risk tolerance is influenced by factors such as your investment goals, time horizon, and personal comfort with market fluctuations. Consider taking a risk assessment questionnaire to gauge your tolerance. - Is diversification enough to manage risk?
While diversification is a powerful tool, it should be combined with other risk management techniques, such as stop-loss orders and position sizing, for optimal protection. - How often should I review my portfolio?
Regular reviews are recommended, at least quarterly, or during significant market events, to ensure your investments align with your risk management strategies and goals.

Limitations of Technical Analysis
While technical analysis is a powerful tool in the arsenal of investors, it is essential to recognize its limitations. One of the primary drawbacks is its heavy reliance on historical data. Technical analysts often assume that past price movements can predict future trends. However, markets can be unpredictable, and relying solely on historical patterns may lead to misguided conclusions. For instance, a stock that has consistently followed a certain trend might suddenly break from that pattern due to unforeseen events, such as changes in market sentiment or economic conditions.
Another significant limitation is the potential for market anomalies. These anomalies can include sudden price spikes or drops that are not reflected in historical patterns, often driven by news events or macroeconomic factors. Such occurrences can throw a wrench into even the most meticulously crafted technical analysis, leading to poor investment decisions. For example, a trader might identify a bullish pattern only to see the stock plummet due to an unexpected earnings report.
Moreover, technical analysis can be influenced by market sentiment, which is often irrational. Investor emotions can lead to price movements that do not align with the underlying fundamentals of the asset. This means that traders relying solely on technical indicators may find themselves caught off guard by sudden shifts in market mood. It’s like trying to predict the weather based solely on historical averages; sometimes, a storm can roll in out of nowhere, leaving you unprepared.
Additionally, the presence of false signals and market noise is another hurdle for technical analysts. False signals occur when indicators suggest a potential trend reversal or continuation that never materializes. This can lead to premature trades that result in losses. Market noise, on the other hand, refers to random price movements that do not indicate any real change in market sentiment or trend. For instance, a stock might experience a temporary spike due to a rumor, which could mislead traders into making hasty decisions. Therefore, it's crucial for investors to remain vigilant and consider multiple strategies to mitigate these risks.
In summary, while technical analysis offers valuable insights, it is not infallible. Investors should approach it with a critical mind, understanding that it is just one piece of the larger puzzle of portfolio management. Balancing technical analysis with fundamental analysis and being aware of its limitations can lead to more informed decisions and ultimately better investment outcomes.
- What is technical analysis? Technical analysis is the evaluation of securities by analyzing statistics generated by market activity, primarily price movements and trading volume.
- Can technical analysis predict future stock prices? While it can provide insights based on historical data, it cannot guarantee future price movements due to market unpredictability.
- What are some common technical indicators? Common indicators include moving averages, Relative Strength Index (RSI), and Bollinger Bands, which help assess market momentum and trends.
- How can I combine technical and fundamental analysis? By using technical analysis for market timing while considering fundamental analysis for asset valuation, investors can create a more comprehensive investment strategy.

Market Sentiment Impact
Market sentiment plays a crucial role in determining price movements and can often sway the market in unexpected directions. It’s like the weather; just as a sudden storm can change a sunny day, shifts in market sentiment can lead to rapid price fluctuations. Understanding this impact is essential for any investor looking to navigate the complexities of portfolio management effectively.
Investors often react to news, events, and even social media trends, creating a ripple effect that can be felt across the market. For instance, a positive earnings report can send a stock soaring, while negative news can cause it to plummet. This reaction is often driven by emotions—fear, greed, optimism, and panic—which can lead to irrational decision-making. Therefore, while technical analysis provides valuable insights based on historical data, it’s equally important to consider the prevailing market sentiment.
To illustrate the influence of market sentiment, let’s consider a few scenarios:
- Positive Sentiment: When investors are optimistic about the future, they tend to buy more stocks, driving prices up. This bullish sentiment can create a self-fulfilling prophecy where rising prices encourage even more buying.
- Negative Sentiment: Conversely, during times of uncertainty or fear, such as economic downturns or geopolitical tensions, investors may sell off their assets, leading to a market decline. This bearish sentiment can result in panic selling, further exacerbating the downward trend.
- Neutral Sentiment: Sometimes, market sentiment can be neutral, where investors are uncertain and hesitant to make significant moves. This can lead to a stagnant market with little price movement, making it challenging to implement effective portfolio strategies.
Moreover, market sentiment can be gauged through various indicators such as the Consumer Confidence Index and Volatility Index (VIX). These tools can provide insights into how investors feel about the market, helping portfolio managers make informed decisions. For example, a spike in the VIX often indicates increased fear among investors, suggesting that it might be wise to adopt a more defensive strategy.
While technical analysis focuses on price patterns and historical data, it’s vital to remember that market sentiment can lead to price movements that technical indicators may not predict. Thus, integrating sentiment analysis with technical analysis can create a more robust investment strategy. By understanding both the numbers and the emotions driving the market, investors can better position themselves to capitalize on opportunities and mitigate risks.
In conclusion, recognizing the impact of market sentiment is essential for effective portfolio management. It’s not just about the charts; it’s about understanding the human emotions that drive those charts. By marrying technical analysis with an awareness of market sentiment, investors can enhance their decision-making process, ultimately leading to more successful investment outcomes.
- What is market sentiment? Market sentiment refers to the overall attitude of investors toward a particular security or financial market. It can be influenced by news, events, and economic indicators.
- How can I gauge market sentiment? Market sentiment can be gauged through various indicators such as the Consumer Confidence Index, market surveys, and the Volatility Index (VIX).
- Why is market sentiment important in technical analysis? Market sentiment can influence price movements in ways that technical analysis may not predict, highlighting the need for a comprehensive approach to portfolio management.
- Can market sentiment lead to irrational behavior? Yes, market sentiment can lead to emotional decision-making, causing investors to act against their best interests, such as panic selling during market downturns.

False Signals and Noise
In the world of technical analysis, one of the most daunting challenges investors face is the presence of false signals and market noise. These elements can create confusion and lead to misguided investment decisions. Imagine you're navigating through a dense fog; without clear visibility, you might end up taking a wrong turn. Similarly, false signals can mislead traders into believing a price movement is significant when, in reality, it might just be a temporary fluctuation.
False signals often arise from various factors, including unexpected news events, economic reports, or even general market sentiment. For instance, a stock might show a sudden spike in price, leading traders to believe there's a strong bullish trend. However, this spike could be the result of a minor event that doesn't reflect the stock's underlying value. When traders act on these signals, they risk entering or exiting positions at the wrong time, which can severely impact their portfolio performance.
Market noise, on the other hand, refers to the random price movements and fluctuations that occur due to a multitude of factors, including trading volume and market speculation. This noise can drown out the essential signals that technical analysis aims to identify. It's like trying to hear a conversation in a crowded room; the more noise there is, the harder it becomes to focus on what's truly important. To combat this, investors often rely on various techniques to filter out the noise and hone in on the relevant data.
One effective method to mitigate the effects of false signals and noise is to incorporate a combination of technical indicators. For example, using moving averages alongside momentum indicators can help confirm trends and reduce the likelihood of being misled by short-term price movements. Additionally, employing a longer time frame for analysis can provide a clearer picture of the market's direction, helping to smooth out the noise.
It's crucial for investors to remain vigilant and skeptical when interpreting technical signals. Maintaining a healthy dose of skepticism can act as a safeguard against the pitfalls of false signals and noise. By combining technical analysis with fundamental analysis and staying informed about broader market conditions, investors can create a more robust strategy that minimizes the risks associated with misleading signals.
In summary, while false signals and noise are inherent challenges in technical analysis, understanding their nature and employing strategies to mitigate their impact can significantly enhance an investor's decision-making process. By remaining aware of these elements, you can navigate the complexities of the market with greater confidence and precision.
- What are false signals in technical analysis? False signals are misleading indicators that suggest a price movement will continue in a certain direction when it may not.
- How can I identify noise in the market? Noise can be identified by observing random price fluctuations that do not correlate with significant news or trends.
- What strategies can I use to filter out false signals? Combining multiple technical indicators, using longer time frames, and incorporating fundamental analysis can help filter out false signals.
- Why is market sentiment important in technical analysis? Market sentiment can drive price movements that technical analysis may not predict, making it essential to consider in your strategy.
Frequently Asked Questions
- What is technical analysis?
Technical analysis is the study of past market data, primarily price and volume, to forecast future price movements. It helps investors make informed decisions by identifying trends and patterns in market activity.
- How can I use technical analysis for portfolio management?
You can utilize technical analysis by integrating it with your investment strategy to identify optimal entry and exit points for your assets. By analyzing chart patterns and indicators, you can enhance your decision-making process and optimize your asset allocation.
- What are some common chart patterns to look for?
Some common chart patterns include the head and shoulders, double tops and bottoms, and flags. Recognizing these patterns can help you predict potential reversals or continuations in market trends.
- What are support and resistance levels?
Support levels are price points where a stock tends to stop falling and may even bounce back up, while resistance levels are where a stock tends to stop rising and may reverse back down. Identifying these levels is crucial for making strategic trading decisions.
- What technical indicators should I consider?
Key technical indicators include moving averages, Relative Strength Index (RSI), and Bollinger Bands. These tools provide insights into market momentum and can help you identify potential price reversals.
- Can technical analysis predict market movements accurately?
While technical analysis can provide valuable insights, it's important to remember that it relies on historical data and patterns, which may not always predict future movements accurately. Always consider combining it with fundamental analysis for a more comprehensive view.
- What are the limitations of technical analysis?
Some limitations include its reliance on historical data, the potential for false signals, and market anomalies. Additionally, external factors like market sentiment can also influence price movements in ways that technical analysis might not predict.
- How can I manage risk using technical analysis?
Risk management techniques informed by technical analysis include setting stop-loss orders, diversifying your portfolio, and using position sizing strategies. These practices can help protect your investments from significant losses while maximizing potential gains.