Understanding the Basics of Fibonacci Retracement in Trading
Fibonacci retracement is more than just a buzzword in the trading community; it's an essential tool that can help traders navigate the often tumultuous waters of financial markets. Imagine you're sailing a ship through choppy seas, and suddenly you spot a lighthouse guiding you back to safe shores. That's what Fibonacci retracement does for traders—it helps them identify potential reversal levels that could signal a change in market direction. By leveraging the mathematical principles behind the Fibonacci sequence, traders can make informed decisions about when to enter or exit trades, ultimately enhancing their chances of success.
But why is it so significant? Well, the Fibonacci sequence is a series of numbers where each number is the sum of the two preceding ones, starting from 0 and 1. This sequence leads to key ratios—like 23.6%, 38.2%, 50%, 61.8%, and 100%—that traders use to identify potential support and resistance levels in the market. These levels are not random; they are closely watched by many traders, creating a self-fulfilling prophecy where prices often react to these Fibonacci levels. Thus, understanding Fibonacci retracement can be a game-changer in your trading toolkit.
As we delve deeper into this topic, we will explore how to calculate Fibonacci levels, identify swing highs and lows, and apply these concepts in various trading strategies. We’ll also touch on common mistakes traders make when using this tool, ensuring that you have a well-rounded understanding of Fibonacci retracement. So, are you ready to unlock the secrets of this powerful trading tool and take your trading game to the next level?
At its core, Fibonacci retracement is a technical analysis tool that helps traders predict potential support and resistance levels based on the Fibonacci sequence. Think of it as a map that highlights areas where the price might bounce back or reverse. For instance, after a significant price movement, a trader might use Fibonacci retracement to identify levels where the price could pull back before continuing its trend. This is crucial for making effective trading decisions, as knowing these levels can help you set stop-loss orders and take-profit targets more effectively.
When traders apply Fibonacci retracement, they typically look for significant price movements—both upward and downward. By marking the high and low points of these movements, they can draw horizontal lines at the key Fibonacci levels. These levels act as potential turning points in the market, allowing traders to anticipate price action based on historical data. The beauty of Fibonacci retracement lies in its simplicity and effectiveness, making it a favorite among both novice and experienced traders alike.
Calculating Fibonacci levels may sound complex, but it’s quite straightforward once you grasp the basics. The first step involves identifying a price range—this could be the highest and lowest points of a significant price movement. Once you have these points, you apply the key Fibonacci ratios to determine the retracement levels. For example, if a stock moves from $100 to $150, the Fibonacci levels can be calculated as follows:
| Fibonacci Level | Price Level |
|---|---|
| 23.6% | $138.20 |
| 38.2% | $130.90 |
| 50% | $125.00 |
| 61.8% | $119.10 |
| 100% | $100.00 |
These levels indicate potential areas where the price may reverse or stall, giving traders crucial insights into market behavior. Understanding how to calculate these levels is essential for anyone looking to utilize Fibonacci retracement effectively in their trading strategies.
While Fibonacci retracement can be a powerful tool, many traders fall into common traps that can lead to misinterpretations. One of the most frequent mistakes is over-reliance on Fibonacci levels. Just because a price hits a Fibonacci level doesn’t mean it will reverse; it’s merely a signal that traders should pay attention to. Combining Fibonacci retracement with other indicators, like moving averages or RSI, can provide a more comprehensive view of market conditions.
Another critical mistake is ignoring market context. The effectiveness of Fibonacci levels can vary based on broader market trends and news events. For example, if a major economic announcement is pending, it might overshadow any technical signals, including Fibonacci levels. Therefore, always consider the bigger picture when applying Fibonacci retracement in your trading.
- What is the best time frame for using Fibonacci retracement? It depends on your trading style. Short-term traders may prefer smaller time frames, while long-term investors might use daily or weekly charts.
- Can Fibonacci retracement be used in all markets? Yes, Fibonacci retracement can be applied to stocks, forex, commodities, and cryptocurrencies.
- How often should I use Fibonacci retracement? Use it whenever you identify significant price movements, but always in conjunction with other technical analysis tools.
What is Fibonacci Retracement?
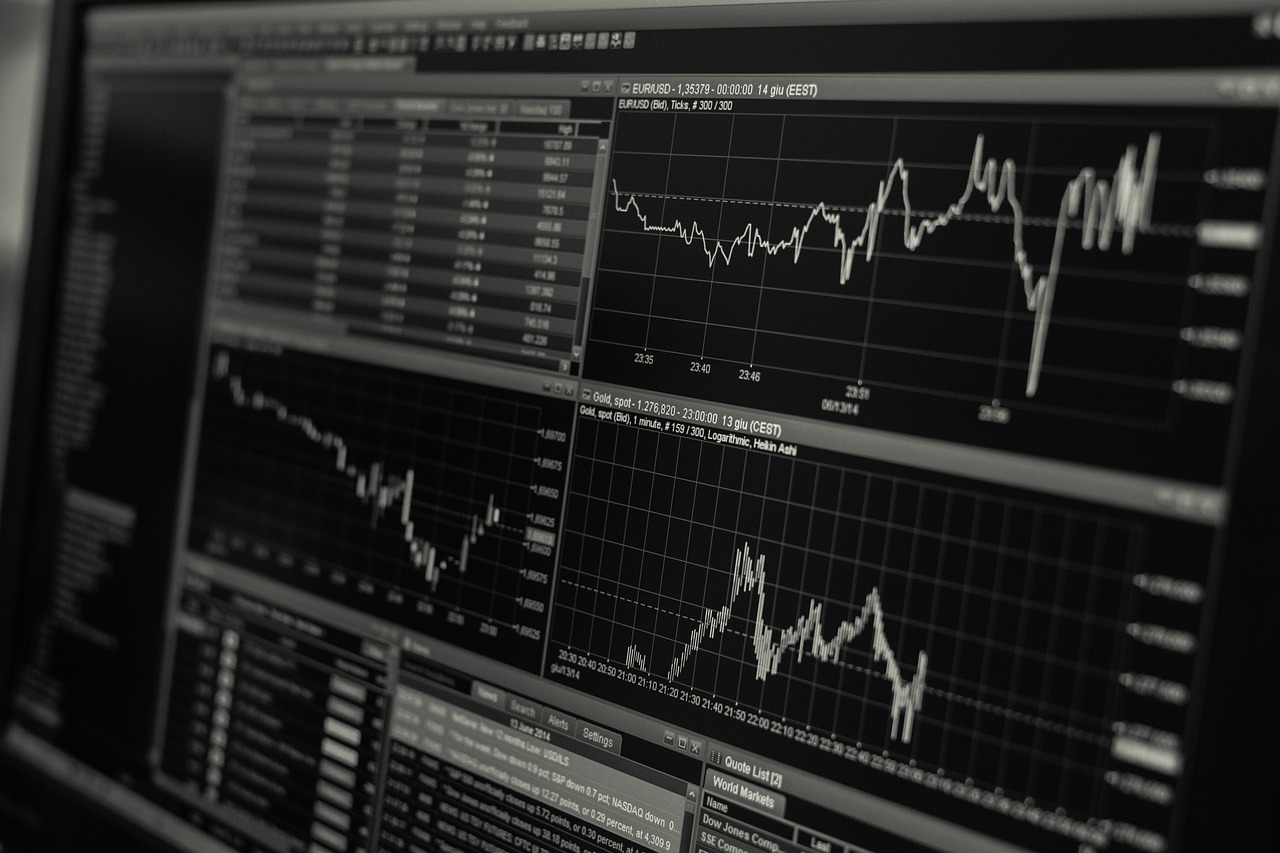
Fibonacci retracement is a powerful technical analysis tool used by traders to identify potential reversal levels in the financial markets. It is based on the Fibonacci sequence, a mathematical sequence where each number is the sum of the two preceding ones, typically starting with 0 and 1. This sequence manifests in various aspects of nature, art, and even financial markets, making it a fascinating and effective tool for predicting price movements.
In trading, Fibonacci retracement levels are horizontal lines that indicate potential support and resistance levels at the key Fibonacci ratios of 23.6%, 38.2%, 50%, 61.8%, and 100%. These levels act as psychological barriers where traders might expect the price to reverse direction. Imagine standing at the edge of a cliff; the Fibonacci levels are like safety nets that can catch you if you fall, helping to prevent significant losses.
Understanding Fibonacci retracement is crucial for any trader looking to make informed decisions. When a stock or asset experiences a significant price movement, whether up or down, it often retraces a portion of that movement before continuing in the original direction. This is where Fibonacci retracement comes into play. By plotting these levels on a chart, traders can visualize where the price might bounce back, allowing them to plan their entries and exits effectively.
To illustrate this concept, consider the following example: if a stock rises from $10 to $20, a trader might use Fibonacci retracement to find potential reversal points as the price pulls back. By applying the Fibonacci ratios to this price range, the trader can identify key levels such as $18.18 (23.6%), $16.36 (38.2%), $15 (50%), and $13.64 (61.8%). These levels can help the trader decide when to enter a position as the price retraces.
In summary, Fibonacci retracement is not just a random number game; it is a well-respected tool that helps traders make sense of price movements. By understanding where these levels lie, traders can enhance their trading strategies and improve their chances of success in the markets.

How to Calculate Fibonacci Levels
Calculating Fibonacci levels might sound a bit daunting at first, but once you break it down, it’s as easy as pie! The Fibonacci retracement tool is built around the Fibonacci sequence, a series of numbers where each number is the sum of the two preceding ones. In trading, these numbers help us predict potential reversal levels in the market. To get started, you need to identify a price range—specifically, the high and low points of a price movement. This is crucial because the Fibonacci levels will be derived from this range.
Once you have your swing high and swing low identified, you can apply the key Fibonacci ratios, which are typically 23.6%, 38.2%, 50%, 61.8%, and 100%. These percentages represent potential levels of support and resistance. For instance, if the price moved from $100 (swing low) to $150 (swing high), you would calculate the levels as follows:
| Fibonacci Level | Calculation | Price Level |
|---|---|---|
| 23.6% | 150 - (0.236 * (150 - 100)) | $138.00 |
| 38.2% | 150 - (0.382 * (150 - 100)) | $130.90 |
| 50% | 150 - (0.5 * (150 - 100)) | $125.00 |
| 61.8% | 150 - (0.618 * (150 - 100)) | $119.10 |
| 100% | 150 | $150.00 |
Now that you have your Fibonacci levels calculated, you can plot them on your trading chart. This will allow you to visualize where potential support and resistance levels lie. But remember, these levels are not set in stone; they are merely guidelines. The market is influenced by a multitude of factors, and prices can behave unpredictably. Therefore, it’s essential to stay alert and combine Fibonacci levels with other technical indicators for a more robust trading strategy.
Finally, don’t forget to adjust your calculations based on the timeframe you’re analyzing. Short-term traders might focus on minute or hourly charts, while long-term investors might look at daily or weekly charts. Each timeframe can yield different Fibonacci levels, so choose one that aligns with your trading goals.
- What is the best way to use Fibonacci retracement levels? Combine them with other indicators like moving averages or MACD for better accuracy.
- Can Fibonacci levels guarantee a reversal? No, they are not foolproof but can provide valuable insights into potential market behavior.
- How often should I recalculate Fibonacci levels? It’s advisable to recalculate them whenever there’s a significant price movement that alters the swing high or low.

Identifying Swing Highs and Lows
Identifying swing highs and lows is a fundamental step in utilizing Fibonacci retracement effectively. These points represent the peaks and troughs in price movement, acting as critical markers for traders. Think of swing highs as the mountain tops where the price has reached its peak before a downward movement, while swing lows are the valleys where the price dips before making a recovery. Recognizing these points can significantly enhance your trading strategy and decision-making process.
To identify swing highs and lows, traders typically look for specific criteria. A swing high is formed when the price reaches a peak and then subsequently declines, while a swing low occurs when the price hits a trough and then begins to rise. This can often be visualized on a price chart, where you can see the peaks and troughs clearly marked. A good practice is to use candlestick patterns, as they provide visual cues about price action. For example, a series of candlesticks that show a clear upward trend followed by a few bearish candles can indicate a potential swing high.
Here are some techniques to help you identify these critical points:
- Trend Analysis: Look at the overall trend of the market. In an uptrend, focus on higher highs and higher lows, while in a downtrend, pay attention to lower highs and lower lows.
- Volume Confirmation: An increase in trading volume often accompanies swing highs and lows. This can serve as a confirmation signal that a reversal might occur.
- Chart Patterns: Familiarize yourself with common chart patterns such as head and shoulders or double tops and bottoms. These patterns can provide additional context for identifying swing points.
Moreover, understanding the context of the market can greatly assist in identifying these swing points. For instance, if you notice a swing high forming during a period of significant market news or events, it may carry more weight than a swing high that appears in a quiet market. Therefore, always consider the broader market environment when pinpointing these critical levels.
In conclusion, identifying swing highs and lows is not just about spotting peaks and troughs; it's an art that combines observation, analysis, and market awareness. By honing this skill, traders can effectively implement Fibonacci retracement levels, leading to more informed trading decisions and potentially increased profitability.

Using Chart Patterns
Chart patterns are like the fingerprints of the market; they tell a story about previous price movements and can significantly aid traders in pinpointing swing highs and lows. When it comes to using Fibonacci retracement, recognizing these patterns can enhance your ability to identify potential reversal points, making your trading strategy more robust. Patterns such as head and shoulders, double tops and bottoms, and triangles can provide valuable insights into market sentiment and price dynamics.
For instance, the head and shoulders pattern often signals a reversal in trend. When you see this pattern forming, it’s a good idea to apply Fibonacci levels to the peak of the head. This way, you can gauge where the price might retrace before continuing its downward journey. Similarly, a double top can indicate that the market is struggling to break through a resistance level, and when combined with Fibonacci retracement, it can provide a clearer picture of where the price might bounce back or reverse.
Moreover, the triangle patterns, whether ascending, descending, or symmetrical, can be pivotal in determining potential breakout points. As the price consolidates within a triangle, traders can use Fibonacci retracement levels to anticipate where the price might retrace before making a decisive move. This not only helps in identifying entry points but also in setting stop-loss orders effectively.
To further illustrate the significance of chart patterns in conjunction with Fibonacci levels, consider the following table that summarizes key patterns and their implications:
| Chart Pattern | Implication | Fibonacci Application |
|---|---|---|
| Head and Shoulders | Trend reversal from bullish to bearish | Apply Fibonacci from the head to the neckline |
| Double Top | Potential bearish reversal | Use Fibonacci to find retracement levels below the peak |
| Ascending Triangle | Continuation of bullish trend | Fibonacci levels can help set targets for breakout |
| Descending Triangle | Continuation of bearish trend | Fibonacci can identify retracement levels before a breakdown |
In conclusion, incorporating chart patterns into your Fibonacci retracement analysis can provide a multi-dimensional view of the market. By recognizing these patterns, you can significantly enhance your trading decisions, allowing you to better navigate the complexities of price movements. Remember, while Fibonacci retracement is a powerful tool, it becomes even more formidable when used in conjunction with chart patterns. This combination not only increases your likelihood of success but also boosts your confidence in executing trades.
- What is Fibonacci retracement?
Fibonacci retracement is a technical analysis tool that uses horizontal lines to indicate areas of support or resistance at the key Fibonacci levels before the price continues in the original direction.
- How do I calculate Fibonacci levels?
To calculate Fibonacci levels, you need to identify the highest and lowest points in a price range and apply the key Fibonacci ratios (23.6%, 38.2%, 50%, 61.8%, and 100%) to find potential retracement levels.
- Can Fibonacci retracement be used in any market?
Yes, Fibonacci retracement can be applied in various markets, including stocks, forex, and commodities, making it a versatile tool for traders.
- What are common mistakes when using Fibonacci retracement?
Common mistakes include over-reliance on Fibonacci levels without considering market context, and failing to combine Fibonacci analysis with other indicators for a comprehensive trading strategy.

Timeframes for Analysis
When it comes to trading, the timeframe you choose can significantly impact your analysis and decision-making process. Think of it like choosing the lens through which you view a beautiful landscape; different lenses reveal different details. In the world of Fibonacci retracement, selecting the right timeframe is crucial for accurately identifying swing highs and lows, which are essential for calculating Fibonacci levels.
Traders often operate on various timeframes, such as minute, hourly, daily, and weekly. Each of these timeframes has its distinct characteristics and can yield different results. For instance, a short-term trader might focus on minute or hourly charts to make quick decisions, while a long-term investor may prefer daily or weekly charts to identify broader trends. The choice of timeframe can also depend on your trading strategy; are you looking for quick gains or holding positions for the long haul?
One of the most effective ways to determine the appropriate timeframe is by analyzing your trading style. Let’s break it down:
- Scalping: If you're a scalper, you might want to use 1-minute or 5-minute charts. These allow you to catch small price movements and make quick trades.
- Day Trading: Day traders typically operate on 15-minute to 1-hour charts. This timeframe provides a good balance between detail and broader market trends.
- Swing Trading: Swing traders often use daily charts to capture larger price swings over several days or weeks, allowing for a more relaxed trading approach.
- Position Trading: For position traders, weekly charts are ideal for identifying long-term trends and making informed investment decisions.
However, it’s essential to remember that while focusing on a specific timeframe, you should also consider the overall market context. For instance, if you’re trading on a 1-hour chart but significant news is expected that could impact the market, it might be wise to adjust your analysis accordingly. In such cases, looking at higher timeframes can provide valuable insights into market sentiment and potential reversals.
In summary, the timeframe you choose can dramatically influence your trading outcomes. By aligning your selected timeframe with your trading strategy and remaining aware of the broader market context, you can enhance your ability to utilize Fibonacci retracement effectively. So, before diving into a trade, ask yourself: what timeframe best supports my trading goals? The answer could be the key to unlocking your trading potential.
1. What is the best timeframe for Fibonacci retracement?
There isn’t a one-size-fits-all answer. The best timeframe depends on your trading style. Scalpers may prefer shorter timeframes, while long-term investors might benefit from daily or weekly charts.
2. Can I use Fibonacci retracement on any timeframe?
Absolutely! Fibonacci retracement can be applied to any timeframe, but its effectiveness may vary based on market conditions and your trading strategy.
3. How do I know which timeframe to use?
Consider your trading goals and style. If you prefer quick trades, shorter timeframes are ideal. If you’re looking for long-term investments, focus on daily or weekly charts.
4. Should I combine multiple timeframes in my analysis?
Yes! Analyzing multiple timeframes can provide a more comprehensive view of the market, helping you make better-informed decisions.
Applying Fibonacci Levels in Trading Strategies
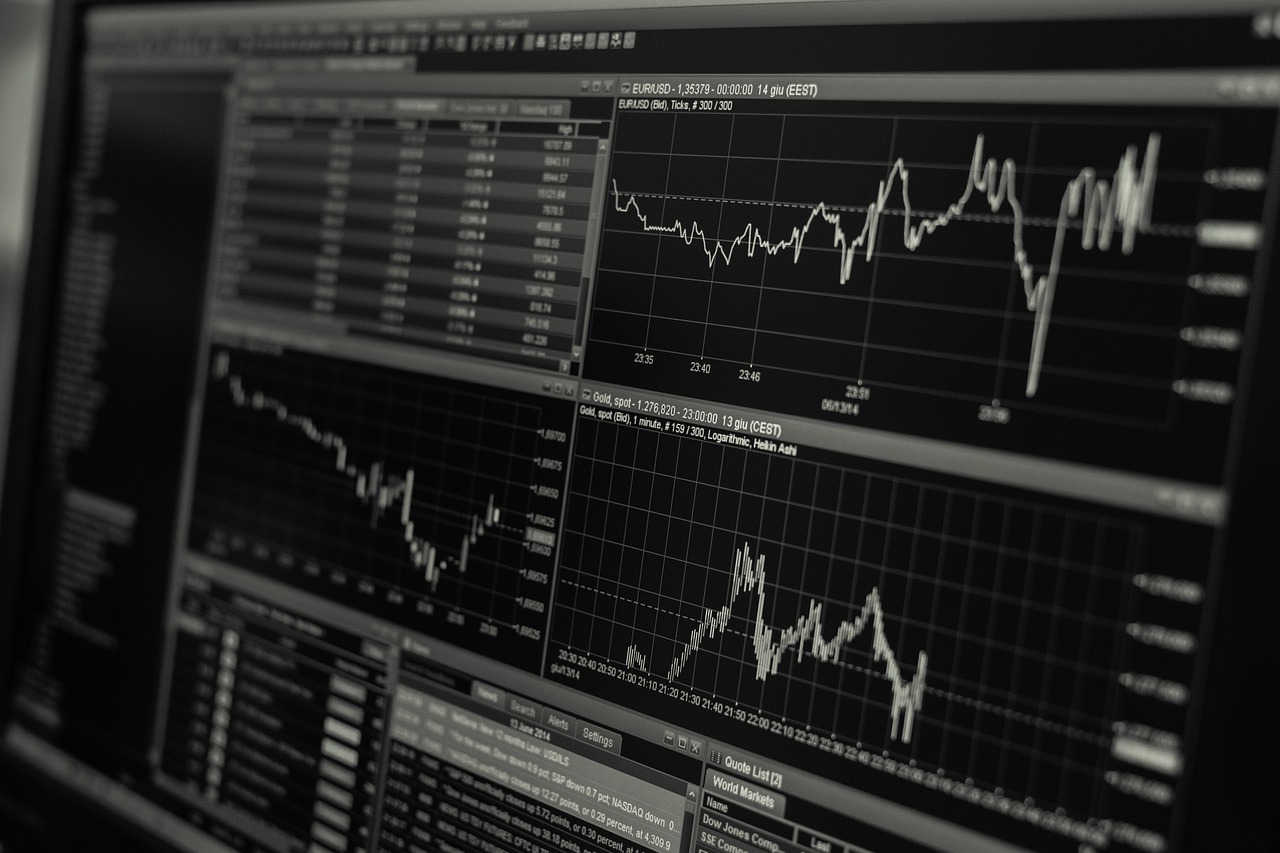
When it comes to trading, understanding how to effectively apply Fibonacci retracement levels can be a game-changer. These levels serve as potential support and resistance points where price reversals may occur. By integrating Fibonacci retracement into your trading strategy, you can enhance your decision-making process, whether you're a day trader, swing trader, or long-term investor.
One of the most common ways to apply Fibonacci levels is by using them to determine entry and exit points. For instance, after a significant price movement, traders often look for retracement levels to identify when to enter a position. A trader might buy when the price retraces to the 38.2% level, anticipating that the price will bounce back. Similarly, the 61.8% level is often seen as a strong support area, making it a crucial point for placing stop-loss orders.
Another practical application is using Fibonacci levels in conjunction with other technical indicators. For example, if a trader notices that the price is approaching the 50% Fibonacci retracement level and simultaneously sees a bullish divergence on the Relative Strength Index (RSI), this confluence of signals can strengthen the case for entering a long position. The idea is to combine Fibonacci retracement with other tools to create a more robust trading strategy.
Additionally, Fibonacci levels can be utilized to set profit targets. After entering a trade, traders can look at the next Fibonacci extension levels (like 161.8% or 261.8%) to determine where to take profits. This approach not only helps in maximizing gains but also in planning exit strategies effectively.
Moreover, the significance of Fibonacci levels can vary based on the timeframe being analyzed. For instance, a level that appears significant on a daily chart may not hold the same weight on a 15-minute chart. Therefore, it's essential to consider the timeframe that aligns with your trading style. Many traders find that using multiple timeframes can provide a clearer picture of potential price movements.
To illustrate the effectiveness of Fibonacci retracement in trading strategies, consider the following
| Fibonacci Level | Potential Action | Market Context |
|---|---|---|
| 23.6% | Watch for potential reversal | Minor pullbacks |
| 38.2% | Consider buying | Strong bullish momentum |
| 50% | Potential entry point | Consolidation period |
| 61.8% | Strong buy signal | Market correction |
In conclusion, applying Fibonacci levels in trading strategies is not just about identifying numbers on a chart; it's about understanding market psychology and price action. By recognizing how these levels interact with market trends and other indicators, traders can significantly improve their chances of making profitable trades. Remember, the key is to remain flexible and adapt your strategy as market conditions change.
Q: What is the best Fibonacci level to use for trading?
A: While there is no definitive answer, many traders consider the 61.8% level to be particularly significant, as it often acts as a strong support or resistance point.
Q: Can Fibonacci retracement be used in all markets?
A: Yes, Fibonacci retracement can be applied to various markets, including stocks, forex, and commodities. However, its effectiveness may vary depending on the asset and market conditions.
Q: How do I know when to trust Fibonacci levels?
A: It's essential to look for confirmation from other technical indicators or chart patterns. If multiple signals align with a Fibonacci level, it increases the likelihood of a price reversal.

Common Mistakes in Using Fibonacci Retracement
When diving into the world of trading, Fibonacci retracement is often hailed as a magical tool that can pinpoint potential reversal levels. However, like any powerful tool, it can lead to pitfalls if not used correctly. One of the most prevalent mistakes traders make is over-reliance on Fibonacci levels. While these levels can provide valuable insights, they should never be the sole basis for trading decisions. Think of it like a compass; it can guide you, but you still need to be aware of your surroundings. Ignoring other indicators and market conditions can lead to significant misinterpretations.
Another common blunder is ignoring market context. The market is a dynamic environment influenced by a myriad of factors, including economic news and geopolitical events. If a trader solely focuses on Fibonacci levels without considering what's happening in the broader market, they risk making decisions based on incomplete information. For instance, if a major economic report is due, it can dramatically shift market sentiment, rendering Fibonacci levels less effective. It's crucial to assess the market context to enhance the reliability of your analysis.
Moreover, traders often struggle with misidentifying swing highs and lows. Accurate identification of these points is essential for calculating Fibonacci levels correctly. A small error in recognizing these critical points can lead to a domino effect of miscalculations down the line. To avoid this, traders should practice using various chart patterns and technical indicators to confirm their swing points. Utilizing tools such as moving averages or trend lines can help solidify your analysis.
Another mistake is failing to adjust Fibonacci levels for different timeframes. Just as a painter chooses the right brush for their canvas, traders must select appropriate timeframes for their analysis. Fibonacci levels can vary significantly across different timeframes, so it’s essential to align your analysis with your trading strategy. For example, day traders might focus on 15-minute or hourly charts, while swing traders may look at daily or weekly charts. Each timeframe can yield different insights, and understanding this can greatly enhance your trading strategy.
Finally, it’s important to remember that Fibonacci retracement is not a crystal ball. It doesn’t guarantee success, and traders should always be prepared for unexpected market movements. Incorporating a risk management strategy is vital. This means setting stop-loss orders and managing your position sizes to mitigate potential losses. By understanding the common mistakes associated with Fibonacci retracement, traders can refine their approach and enhance their decision-making process.
- What is Fibonacci retracement?
Fibonacci retracement is a technical analysis tool that uses horizontal lines to indicate areas of support or resistance at the key Fibonacci levels before the price continues in the original direction. - How do I identify swing highs and lows?
Swing highs and lows can be identified by looking for peaks and troughs in price movements on a chart. Use technical indicators and chart patterns to confirm these points. - Can Fibonacci retracement be used in all markets?
Yes, Fibonacci retracement can be applied to various financial markets, including stocks, forex, and cryptocurrencies, making it a versatile tool for traders. - Should I use Fibonacci retracement alone?
It's advisable not to rely solely on Fibonacci retracement. Combining it with other indicators and market analysis can provide a more comprehensive view of potential price movements.
Over-reliance on Fibonacci Levels
When diving into the world of trading, it's easy to get enamored with tools like Fibonacci retracement. After all, these levels can seem almost magical, revealing potential support and resistance points as if they were written in the stars. However, can be a trap that many traders fall into. It's crucial to remember that while Fibonacci retracement is a powerful tool, it should never be the sole basis for trading decisions.
Imagine you're navigating a ship through stormy seas. Relying solely on one navigational tool, like a compass, without considering other factors such as the wind direction, currents, or even the weather forecast, could lead to disaster. Similarly, traders who depend exclusively on Fibonacci levels may find themselves caught off guard by sudden market movements or external factors that the retracement levels simply can't account for.
One of the main pitfalls of over-reliance is the tendency to ignore the broader market context. Fibonacci levels can provide insights, but they don't exist in a vacuum. For instance, if a trader sees a Fibonacci level aligning with a strong bullish trend but ignores significant news events or economic indicators, they might enter a trade that could lead to losses instead of gains. It's essential to integrate other forms of analysis, such as fundamental analysis or the use of additional technical indicators, to create a more robust trading strategy.
To illustrate this point, consider the following table that outlines some common indicators that can complement Fibonacci retracement:
| Indicator | Purpose |
|---|---|
| Moving Averages | Helps identify the overall trend direction and potential support/resistance levels. |
| Relative Strength Index (RSI) | Indicates overbought or oversold conditions, aiding in identifying potential reversals. |
| MACD (Moving Average Convergence Divergence) | Provides insights into momentum and trend changes, which can enhance entry/exit points. |
By combining Fibonacci retracement with these indicators, traders can create a multi-faceted approach to their analysis. This way, they don’t just rely on the Fibonacci levels but also consider other vital aspects of market behavior. For example, if a Fibonacci level coincides with a moving average, it might strengthen the case for a potential reversal. However, if the RSI indicates that the asset is overbought, it could suggest caution.
In conclusion, while Fibonacci retracement is a valuable tool in any trader's toolkit, it's imperative to use it wisely. By avoiding the trap of over-reliance and integrating other analytical methods, traders can enhance their decision-making process and navigate the markets with greater confidence. Remember, the best strategies are those that consider multiple viewpoints and pieces of information, rather than relying solely on one aspect.
Ignoring Market Context
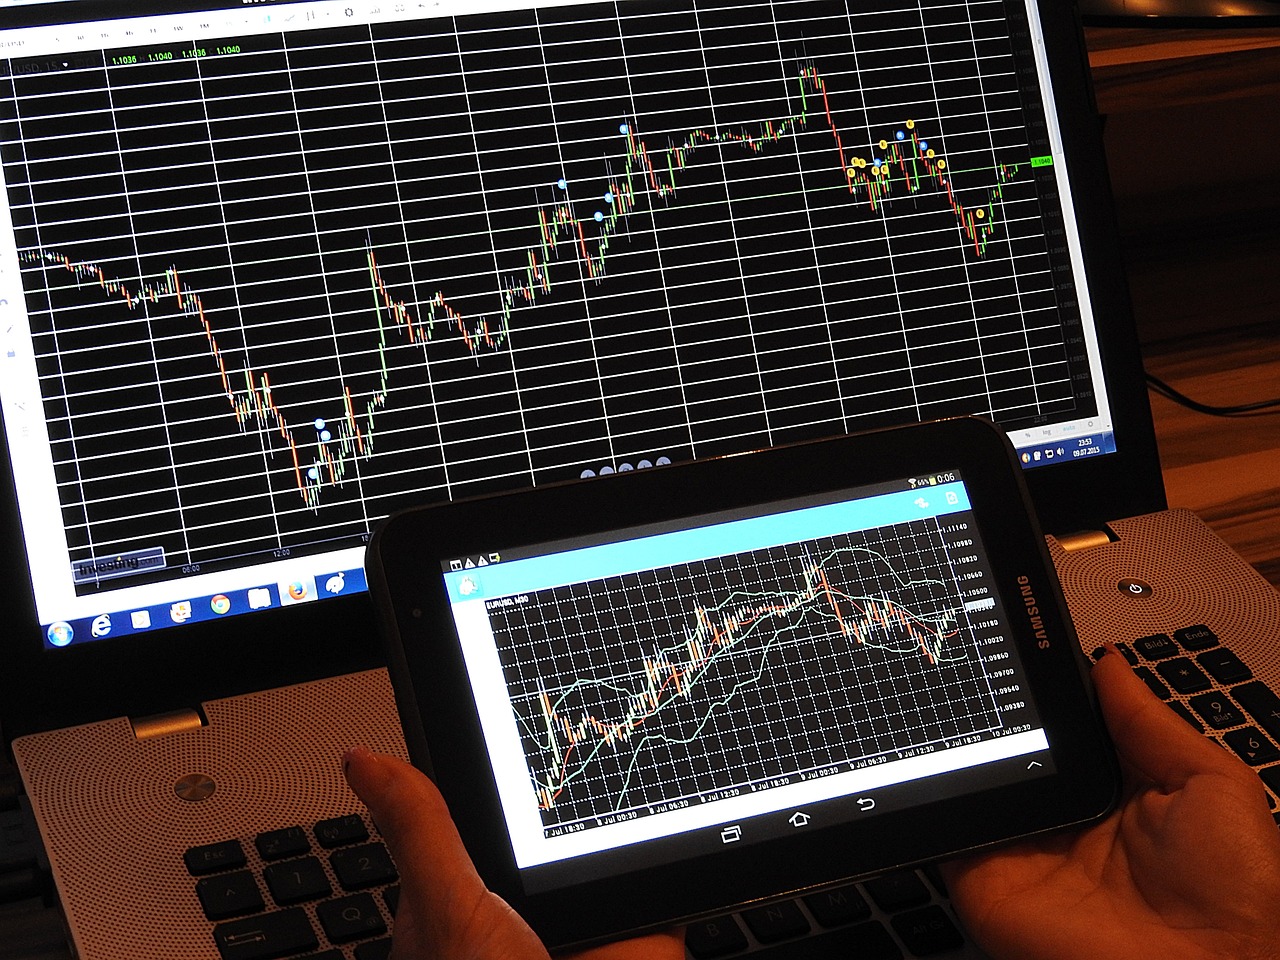
When it comes to trading, one of the biggest mistakes you can make is . Think of it like trying to navigate a river without considering the weather conditions; you might find yourself swept away by unexpected currents. Market context encompasses a variety of factors, including economic indicators, geopolitical events, and overall market sentiment, all of which can significantly influence the effectiveness of Fibonacci retracement levels.
Many traders fall into the trap of focusing solely on Fibonacci levels, believing that these numbers alone will guide them to success. However, this narrow focus can lead to disastrous decisions. For instance, if a trader identifies a Fibonacci level that suggests a potential reversal, but the broader market is trending strongly in the opposite direction due to negative economic news, the likelihood of that reversal occurring diminishes significantly. It's like trying to plant a seed in winter; without the right conditions, it simply won't grow.
To illustrate the importance of market context, consider the following factors:
- Economic Reports: Key reports such as employment figures, GDP growth, and inflation rates can create significant volatility in the markets.
- Geopolitical Events: News regarding elections, trade agreements, or conflicts can shift market sentiment rapidly.
- Market Sentiment: Understanding whether the market is in a bullish or bearish phase can help traders interpret Fibonacci levels more accurately.
By incorporating market context into your analysis, you can enhance the reliability of your Fibonacci retracement levels. For example, if you notice a Fibonacci level aligning with a significant support area during a bullish trend, the chances of a successful reversal increase. Conversely, if the market sentiment is overwhelmingly negative, even a strong Fibonacci level may not hold.
In conclusion, while Fibonacci retracement is a powerful tool, it should never be used in isolation. Always consider the broader market context to make informed trading decisions. Remember, trading is not just about numbers; it's about understanding the story behind those numbers. By acknowledging the market's pulse and adapting your strategy accordingly, you can significantly improve your trading outcomes.
1. What is Fibonacci retracement?
Fibonacci retracement is a technical analysis tool that utilizes the Fibonacci sequence to identify potential support and resistance levels in the market, helping traders predict price reversals.
2. How do I calculate Fibonacci levels?
To calculate Fibonacci levels, identify a significant price range (swing high to swing low), then apply the key Fibonacci ratios (23.6%, 38.2%, 50%, 61.8%, and 100%) to determine potential retracement levels.
3. Can I use Fibonacci retracement in any market?
Yes, Fibonacci retracement can be applied in various financial markets, including stocks, forex, and commodities, as long as you have a clear price chart to analyze.
4. What are common mistakes when using Fibonacci retracement?
Common mistakes include over-reliance on Fibonacci levels without considering market context, ignoring other technical indicators, and failing to adapt to changing market conditions.
Frequently Asked Questions
- What is Fibonacci retracement and why is it important?
Fibonacci retracement is a technical analysis tool that helps traders identify potential support and resistance levels in the market based on the Fibonacci sequence. It's important because it assists in predicting price movements, allowing traders to make informed decisions about entry and exit points.
- How do I calculate Fibonacci levels?
To calculate Fibonacci levels, you first need to identify a significant price range, typically between a swing high and a swing low. Then, apply the key Fibonacci ratios (23.6%, 38.2%, 50%, 61.8%, and 100%) to this range to determine potential retracement levels where price may reverse.
- What are swing highs and lows in trading?
Swing highs and lows are significant price points that indicate the peaks and troughs in market movement. Identifying these points is crucial for calculating Fibonacci retracement levels accurately, as they form the basis for determining where potential reversals may occur.
- Can I use Fibonacci retracement on any timeframe?
Absolutely! Fibonacci retracement can be applied across various timeframes, from minutes to daily charts. However, the effectiveness may vary based on your trading strategy, so it's essential to choose a timeframe that aligns with your overall trading goals.
- What are some common mistakes when using Fibonacci retracement?
Some common mistakes include over-reliance on Fibonacci levels without considering other indicators and ignoring the broader market context. It's crucial to combine Fibonacci analysis with other tools and to stay informed about market trends and news for better trading outcomes.
- How can I improve my use of Fibonacci retracement?
To improve your use of Fibonacci retracement, practice identifying swing highs and lows accurately, integrate Fibonacci levels with other technical indicators, and always consider the market context. Continuous learning and adapting your strategies will enhance your trading effectiveness.


